


Cosmos (ATOM) has been falling since completing a double top pattern on Sept. 17 but has managed to hold on above the $13.30 horizontal support area.
ATOM has been increasing since June even though the rest of the market has shown considerable signs of weakness. It is possible that this has occurred as a result of the anticipation around ATOM 2.0, which is expected to be released on Sept. 26, the first day of Cosmoverse.
While there are no definite details on what upgrades it will bring, the community is speculating that ATOM 2.0 will tackle the issue of the current inflationary economics.
As it stands, the annual inflation is capped between 7% and 20%. The actual value depends on the amount of ATOM that is being staked. If more than two-thirds of the supply is staked, then block rewards decrease until the 7% floor is reached.
If less than two-thirds of the supply is staked, the inflation rate gradually increases until it reached the 20% ceiling. As a result, the supply is projected to increase to more than 300 million by the end of the year and to nearly 400 million by 2027.
Another interesting release is interchain security, which allows Cosmos to share its security with other blockchains. Cosmos validators will also have the ability to validate other blockchains. Therefore, other projects can be secured by staked ATOMs.
The first public testnet for this release, called Game of Chains, has been put into a vote and could go live in the next few days.
ATOM price unsettled
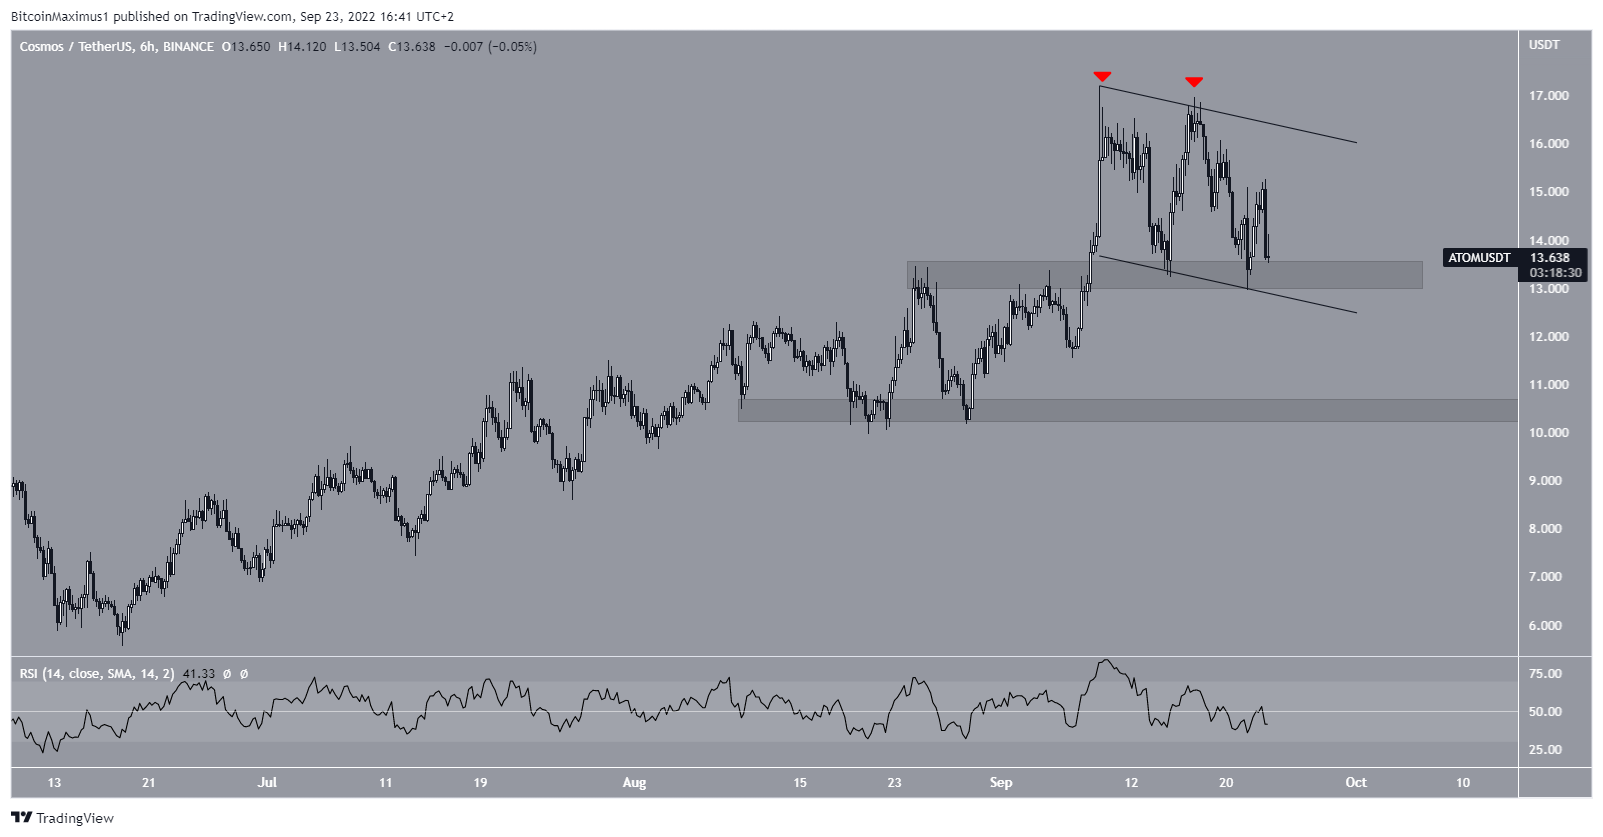
Between Sept. 8 and 18, ATOM created a slightly lower high in what looks like a double top pattern (red icons). Since then, it has been decreasing inside a descending parallel channel.
ATOM bounced at the $13.30 support area and the support line of the channel on Sept. 21 and is now trading just above this area.
The six-hour RSI is moving freely above and below 50, a sign of a neutral trend. Therefore, the direction of the future movement is undetermined.
A breakdown from the support area and support line of the channel would confirm the double top pattern. Then, it could lead to a downward movement towards the $10.50 support area.
Conversely, a breakout from the channel would likely lead to new highs towards $20.
For Be[In]Crypto’s latest Bitcoin (BTC) analysis, click here


