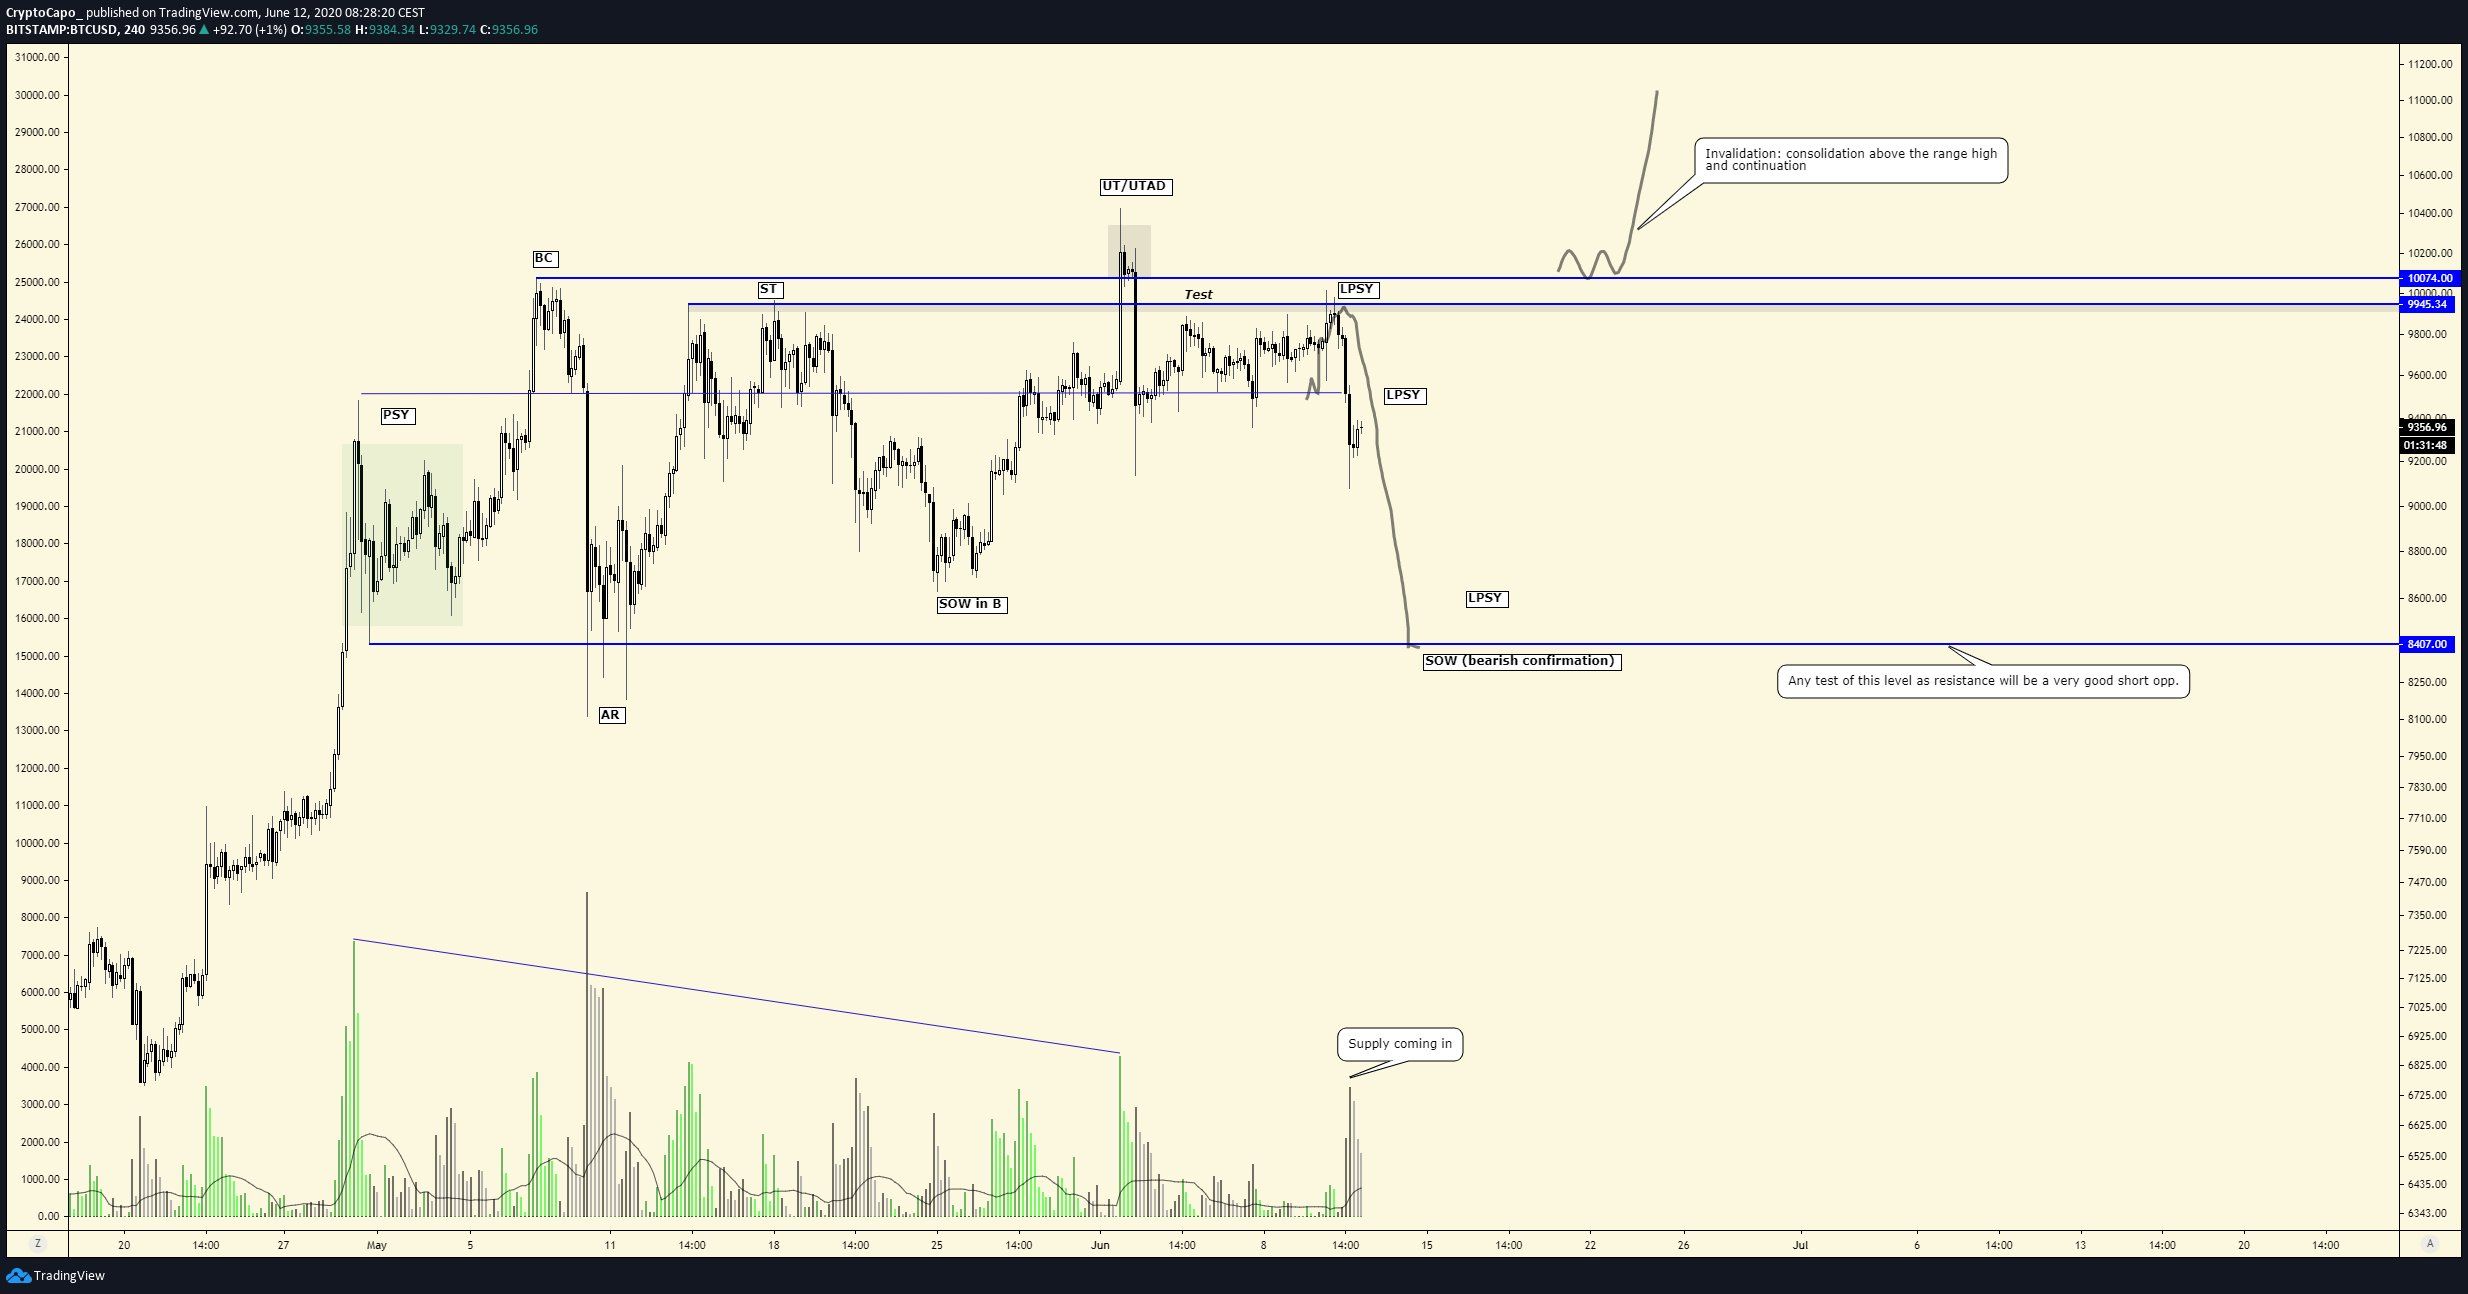
The June 11 decline in the Bitcoin price confirmed weakness in the ongoing bullish trend and made it very likely that the BTC price has been trading in a Wyckoff distribution pattern between $8500 – $10,050 since April 29.
The pattern will be confirmed by a decline below $8,500, indicating that a longer-term correction has begun.
Breaking Down the Wyckoff Distribution
The stages of the Wyckoff distribution are explained in text and shown in the image below:- Preliminary Supply (PSY)– After a pronounced upward move, bullish volume is at its highest. Large sellers begin to unload their assets.
- Buying Climax (BC) – While the price makes a higher high, volume is considerably lower. This area is likely to act as resistance in the future.
- Automatic Reaction (AR) – heavy selling after the buying climax, which defines the lower boundary of the range. Volume is higher than during the buying climax.
- Secondary Test (ST) – An upward move that fails to reach the highs of the buying climax.
- Upthrust (UT) – The upper boundary is broken, but the price gets rejected on extremely high volume, falling back within the range.
- Last Point Of Supply (LPS) – Feeble bounces without considerable volume.
- Show Of Weakness (SOW) – The range low is broken, and the price moves downwards. Volume should pick up during the ensuing downward move.

Alternative Scenario
There is another possibility in which there is an upthrust after distribution, which would create another high, but that is less common.
Nothing has changed here, it just took a little longer. Distribution confirmation: 3D candle closing below $8.5k Distribution invalidation: consolidation + continuation above the range high If confirmed, the important supports are: $7k, $6k, $4.5k, $3k, $2k and $1k

Long-Term Movement
In the longer-term, we can see that BTC has broken down from an ascending support line that had been in place since March 13. This is another sign that suggests the upward move for BTC has ended. In addition, since the price often validates the support line it broke down from, this gives us a time-line for the possible highs in the re-test of the range resistance. If the ST test occurs (first image in the previous section), the high cannot be reached earlier than June 20, since that would breach the rising support line. If the UTAD test occurs (second image), the high shouldn’t be reached before July 2, since that would invalidate the rising support line. After the possible breakdown, the first area of reversal can be found at $7,100 – the 0.5 Fib level of the entire upward move.
Disclaimer
In line with the Trust Project guidelines, this price analysis article is for informational purposes only and should not be considered financial or investment advice. BeInCrypto is committed to accurate, unbiased reporting, but market conditions are subject to change without notice. Always conduct your own research and consult with a professional before making any financial decisions. Please note that our Terms and Conditions, Privacy Policy, and Disclaimers have been updated.

Valdrin Tahiri
Valdrin discovered cryptocurrencies while he was getting his MSc in Financial Markets from the Barcelona School of Economics. Shortly after graduating, he began writing for several different cryptocurrency related websites as a freelancer before eventually taking on the role of BeInCrypto's Senior Analyst.
(I do not have a discord and will not contact you first there. Beware of scammers)
READ FULL BIO
Sponsored
Sponsored
