
Last month, we saw an uptick in trading activity across the cryptocurrency market. The US Securities and Exchange Commission’s (SEC) approval of spot Ethereum exchange-traded funds (ETFs) fueled the global cryptocurrency market capitalization by 13% in the past 30 days.
With signs of rising buying pressure in some altcoins, BeInCrypto dives into lesser-known cryptocurrencies, identifying coins with the potential for significant growth in the next month.
Monero (XMR) Poised To Cross Key Moving Average
Exchanging hands at $142, Monero (XMR) traded close to its 50-day Exponential Moving Average (EMA) at press time, hinting at a possible breakout attempt.
When an asset’s price trades close to this key moving average and shows signs of breaking above it, it indicates that buying pressure is increasing. Therefore, a price uptrend might be on the horizon.
Confirming the rise in buying pressure, readings from XMR’s Moving Average Convergence Divergence (MACD) indicator showed that its MACD line (blue) recently crossed above its signal line (orange).
This indicator gauges the momentum behind an asset’s price movement and identifies potential buying and selling opportunities. When the MACD line crosses above the signal line, it is bullish, suggesting a possible shift in power from sellers to buyers.
Read More: Monero: A Comprehensive Guide to What It Is and How It Works
If this momentum is maintained, XMR’s price can be pushed above the upper channel of its horizontal line, which forms resistance at $152.25.
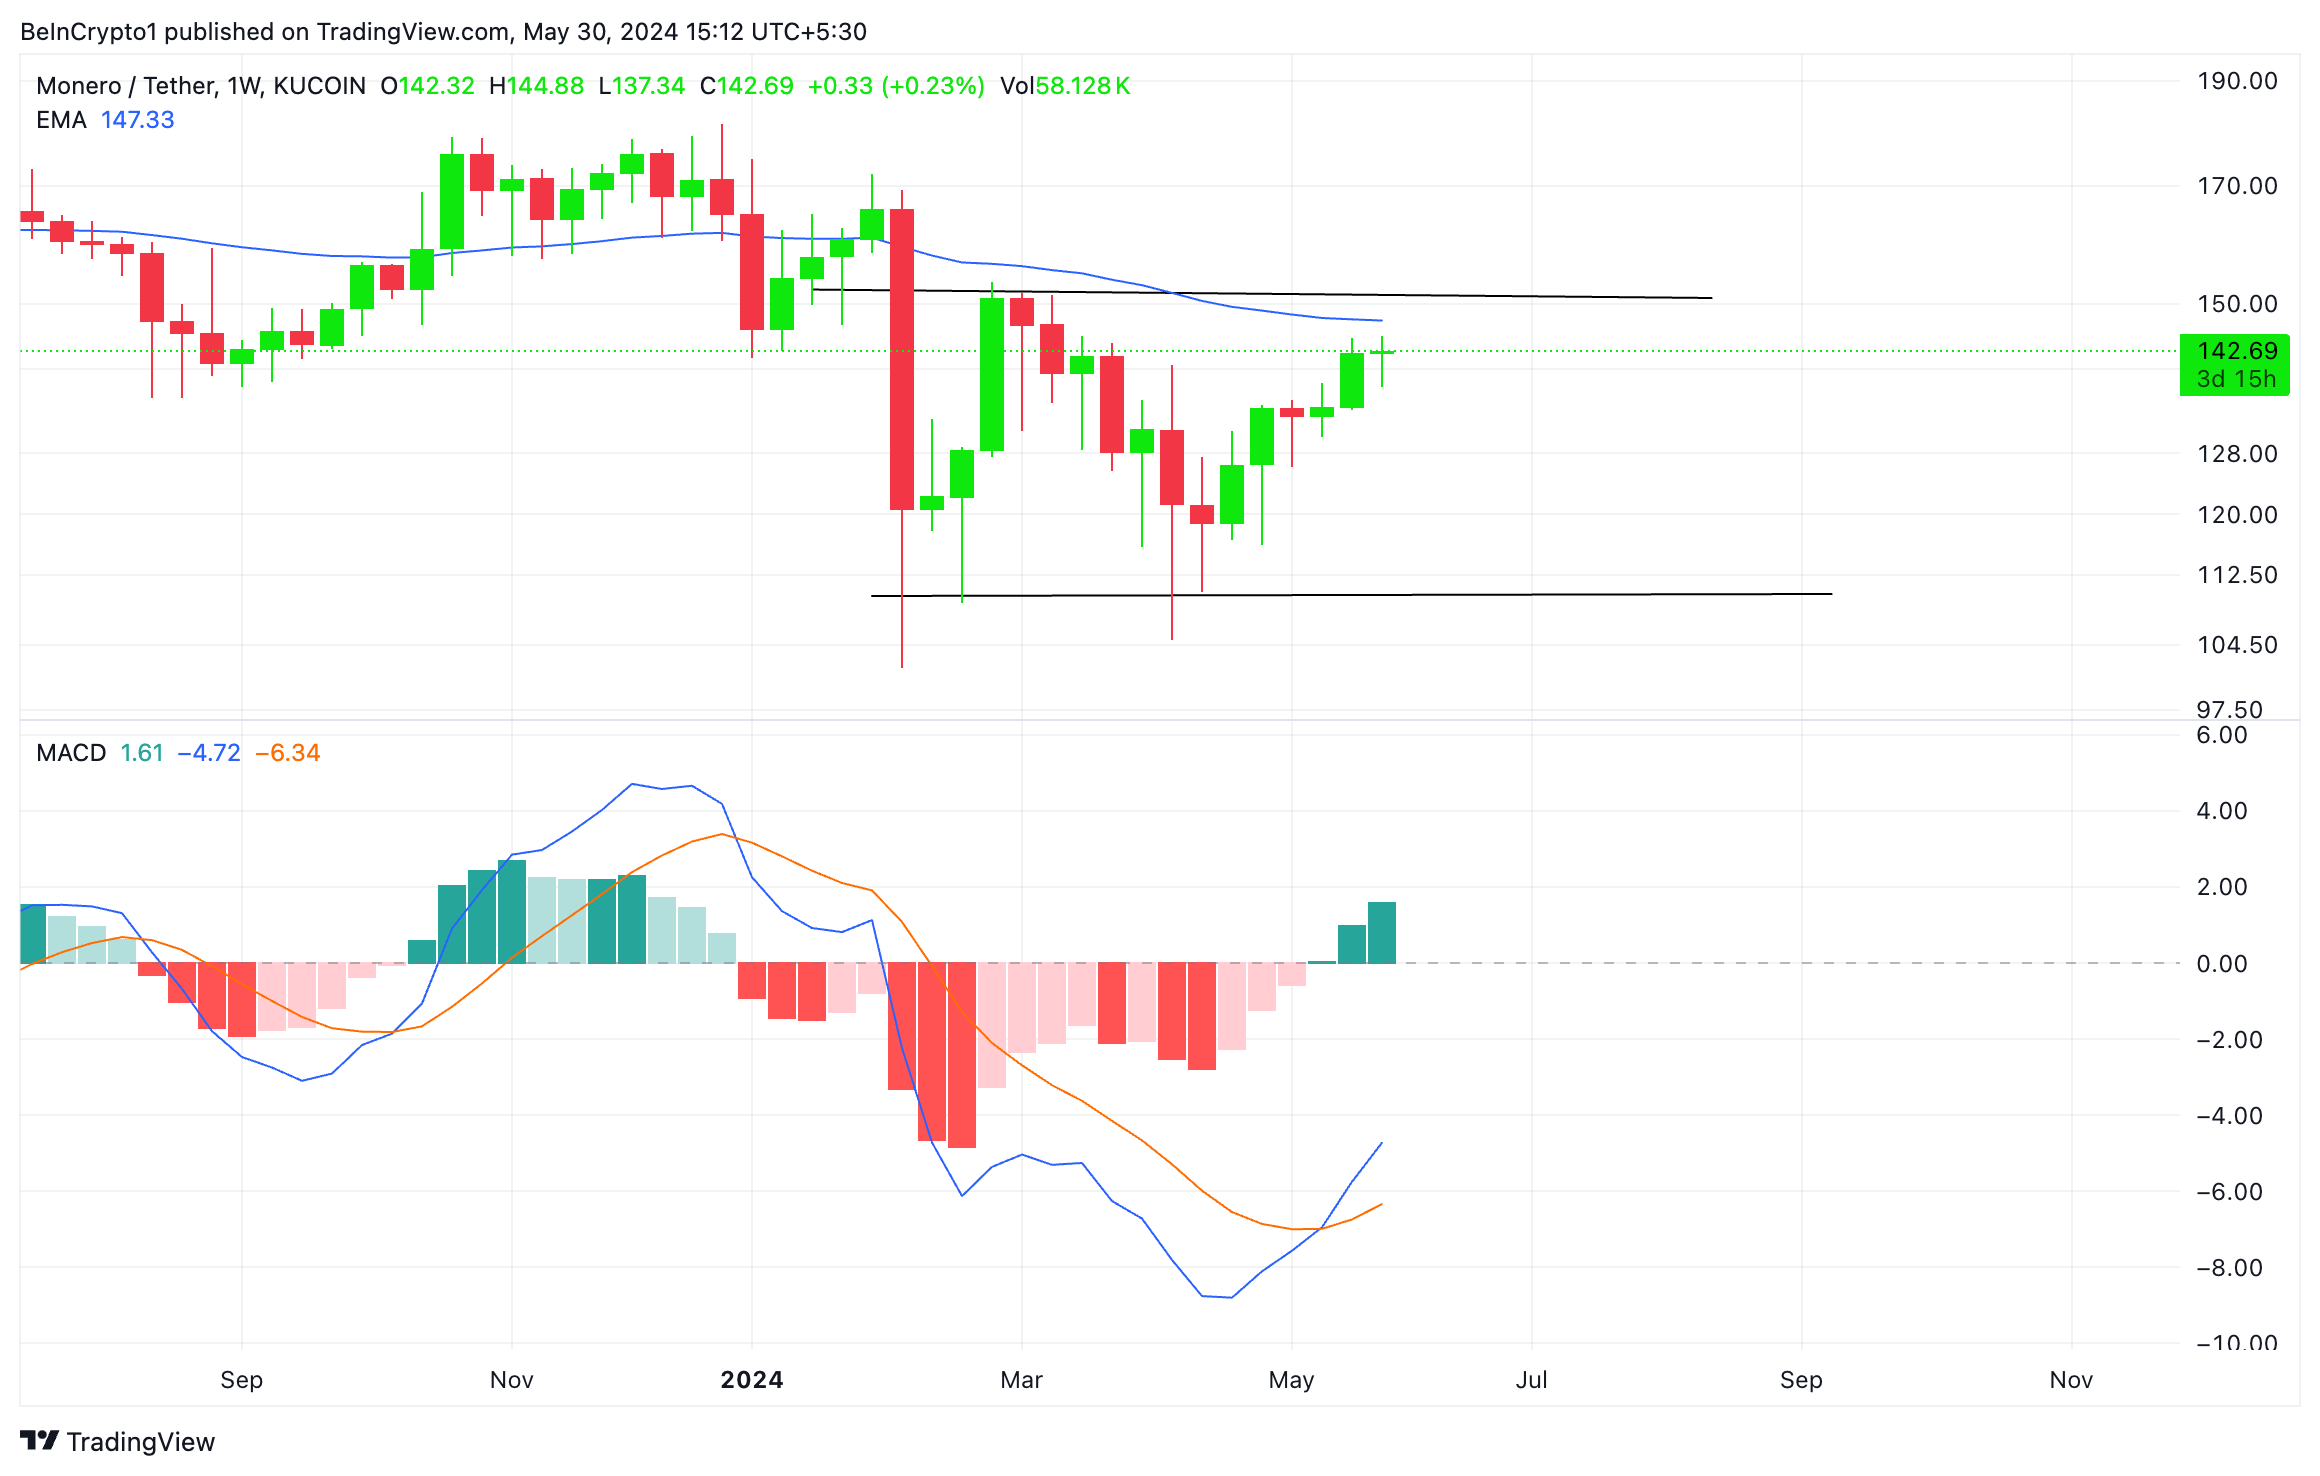
However, if selling activity returns to the market, the token might trend toward support at $110.
Kaspa (KAS) Sees Increased Liquidity
Kaspa (KAS) has seen a steady surge in capital inflow into its market. This was gleaned from its rising Chaikin Money Flow (CMF), which measures the buying and selling pressure behind the token’s price movement.
The gradual increase in this indicator’s value suggests a steady hike in buying pressure for the asset in question. As of this writing, KAS’ CMF was in an uptrend and rested on the center lines.
KAS’s Money Flow Index (MFI) was 68.37, confirming the rally in buying pressure. The value of this indicator, which also tracks an asset’s buying and selling, signaled a steady uptick in demand for KAS.
If this demand continues, KAS may rally above $0.13 to trade at $0.144.
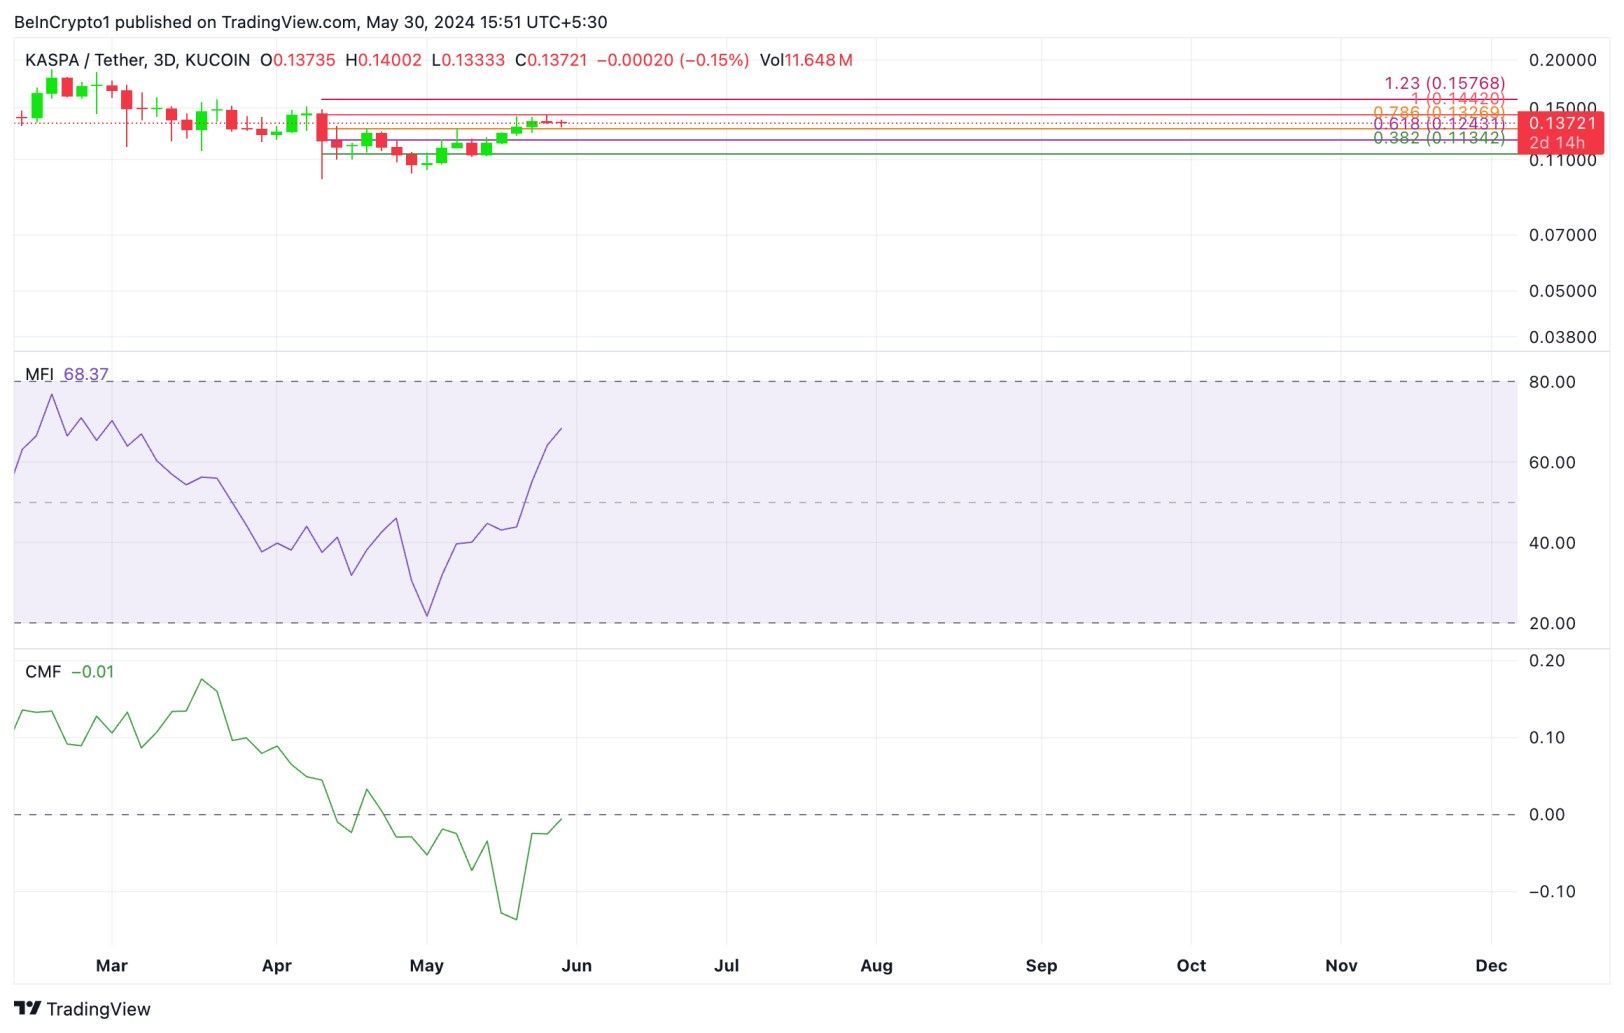
However, if buyer exhaustion sets in and demand for the altcoin plummets, the bears may push its price down to $0.12
Decentraland (MANA) Bulls Attempt a Takeover
Assessed on a weekly chart, Decentraland (MANA) currently trades close to the upper line of the horizontal channel, which it has trended within since April 8.
A horizontal channel is formed when the price of an asset consolidates within a range for an extended period. This happens when a relative balance between buying and selling pressures prevents the price from trending strongly in either direction.
The upper line of this channel forms resistance, while the lower line forms support. Readings from MANA’s Directional Movement Index (DMI) suggested an uptick in buying pressure, with its positive directional index (green) above its negative index (red).
This indicator is used to assess an asset’s trend direction and the strength of that trend. When its positive directional index lies above its negative index, bulls (might be in control, potentially pushing the price higher.
If the bulls continue to exert influence, they can push MANA’s price to $0.47.
Read more: What Is Decentraland (MANA)?
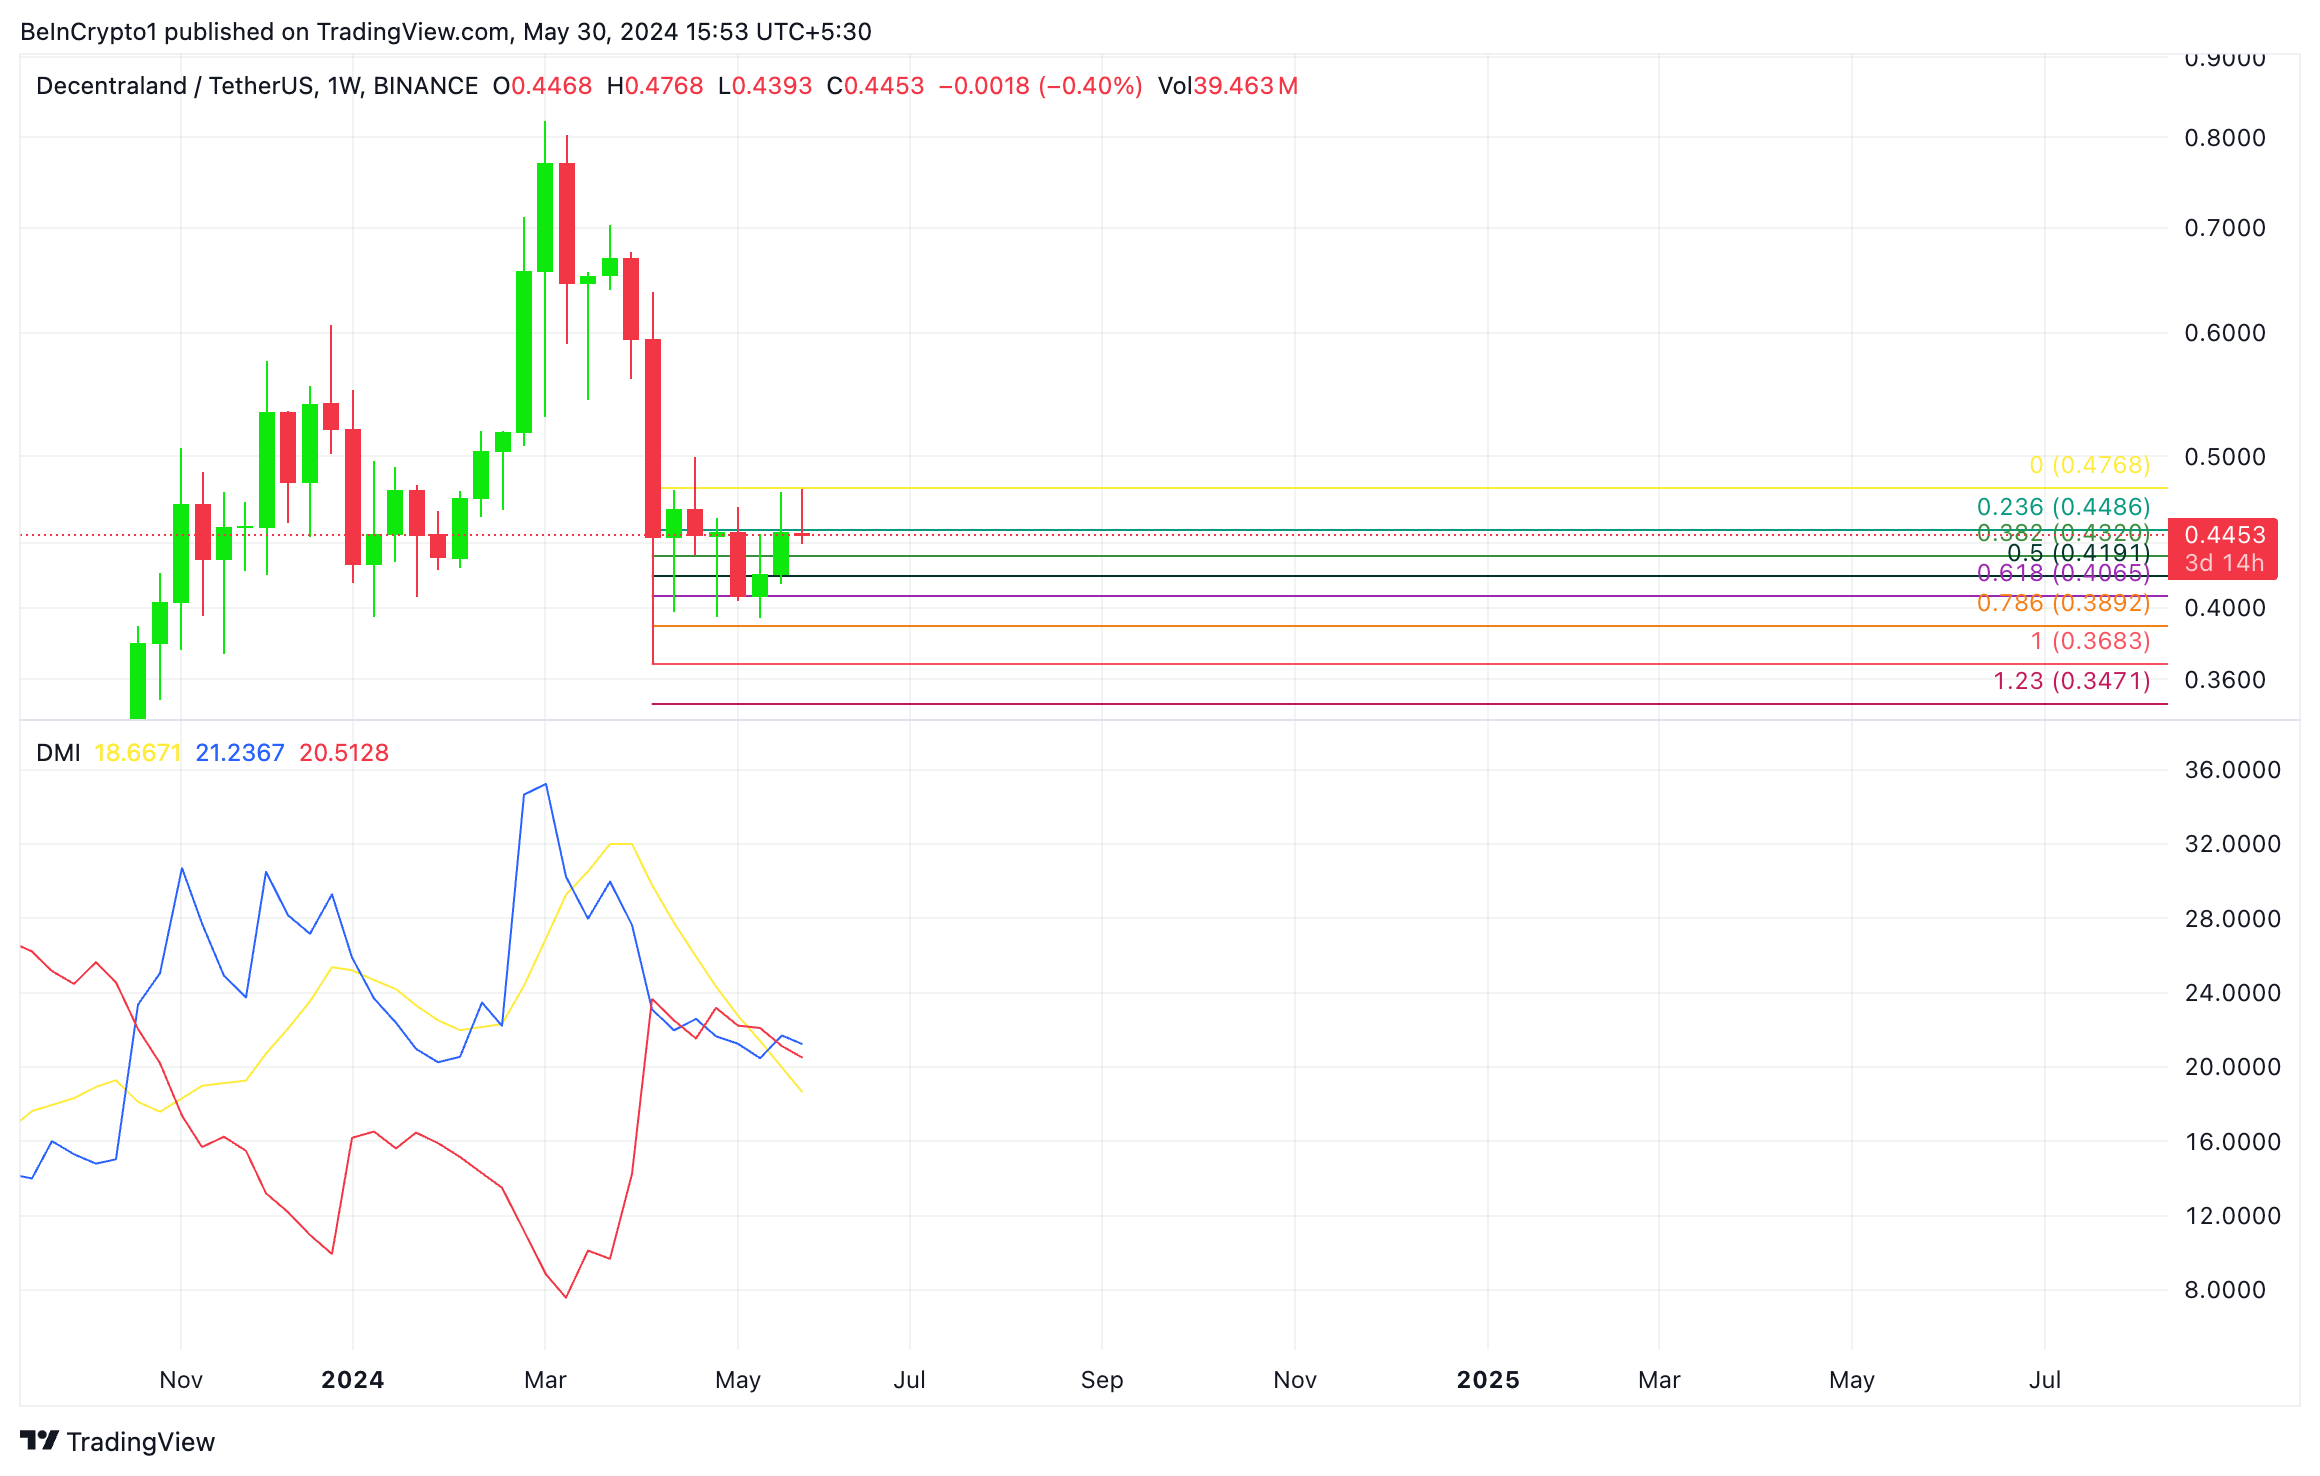
However, if the bears regain control, the token’s value might plummet to $0.41.
