
The Altcoin Market Cap (ALTCAP) has bounced at the long-term $591 Billion support area three times since May 23.
It followed this up with a breakout from a descending resistance line, indicating that it will likely continue heading higher.
ALTCAP bounces at long-term support
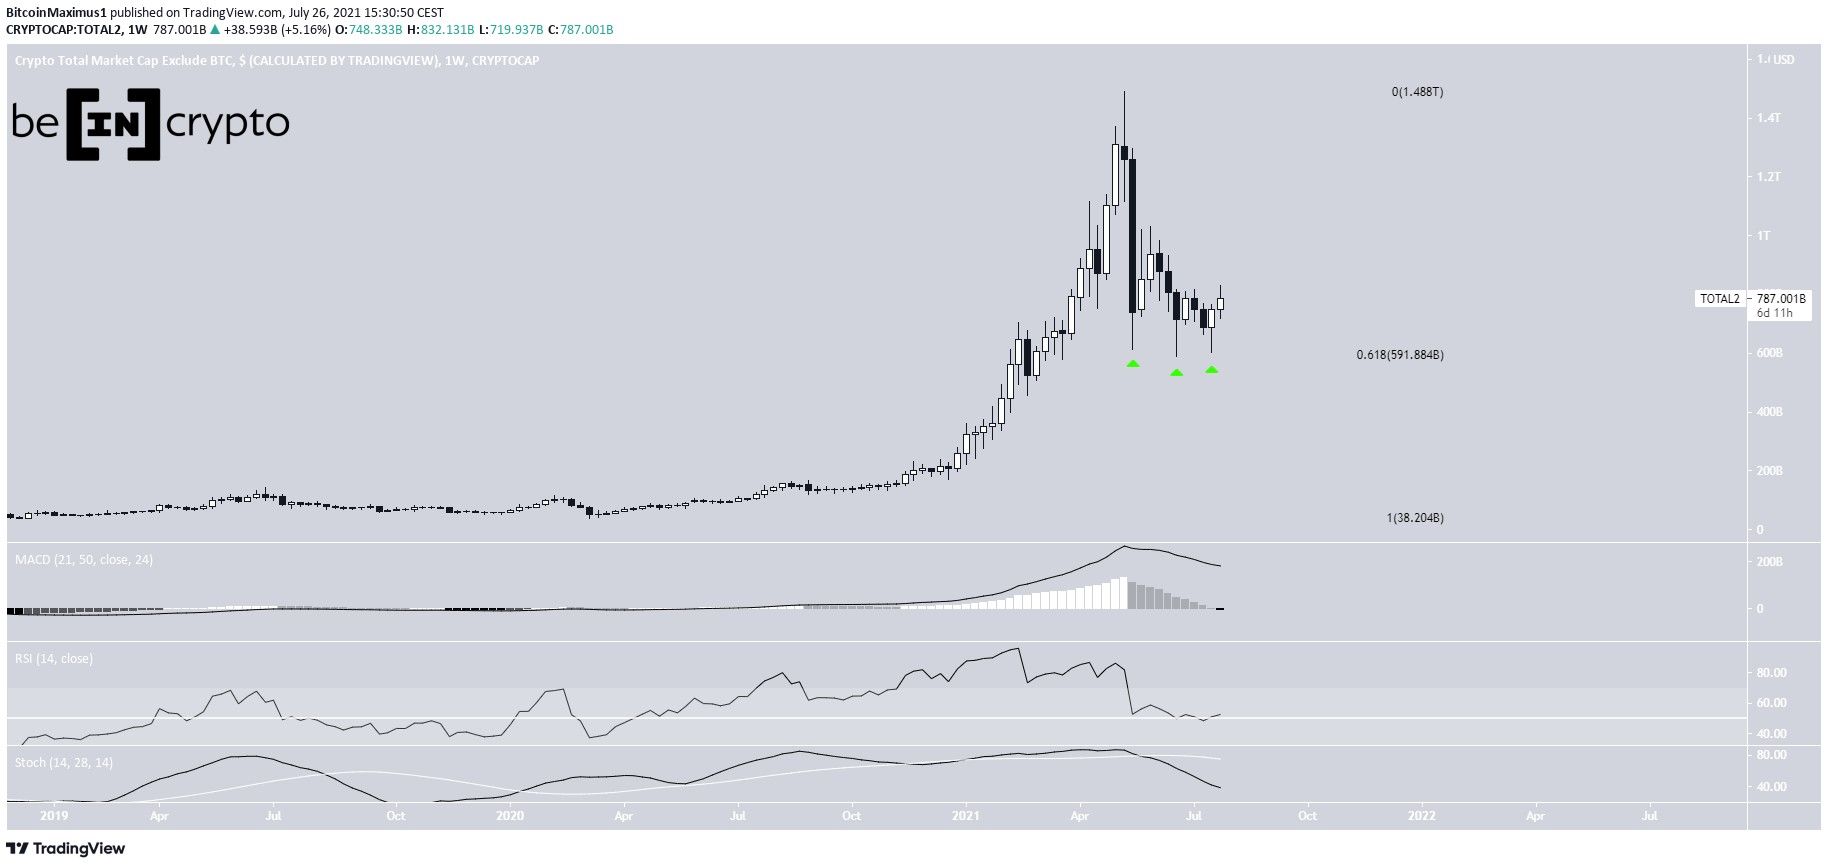
ALTCAP has been moving downwards since an all-time high of $1.49 Trillion was reached on May 12.
The decrease took it thrice to the $591 Billion support area, which is the 0.618 Fib retracement support level. Once there, ALTCAP created three long lower wicks, a sign of buying pressure.
Despite the wicks, technical indicators in the weekly time-frame are still bearish. The MACD is decreasing and is nearly negative. The RSI has fallen below 50 while the Stochastic oscillator has made a bearish cross.
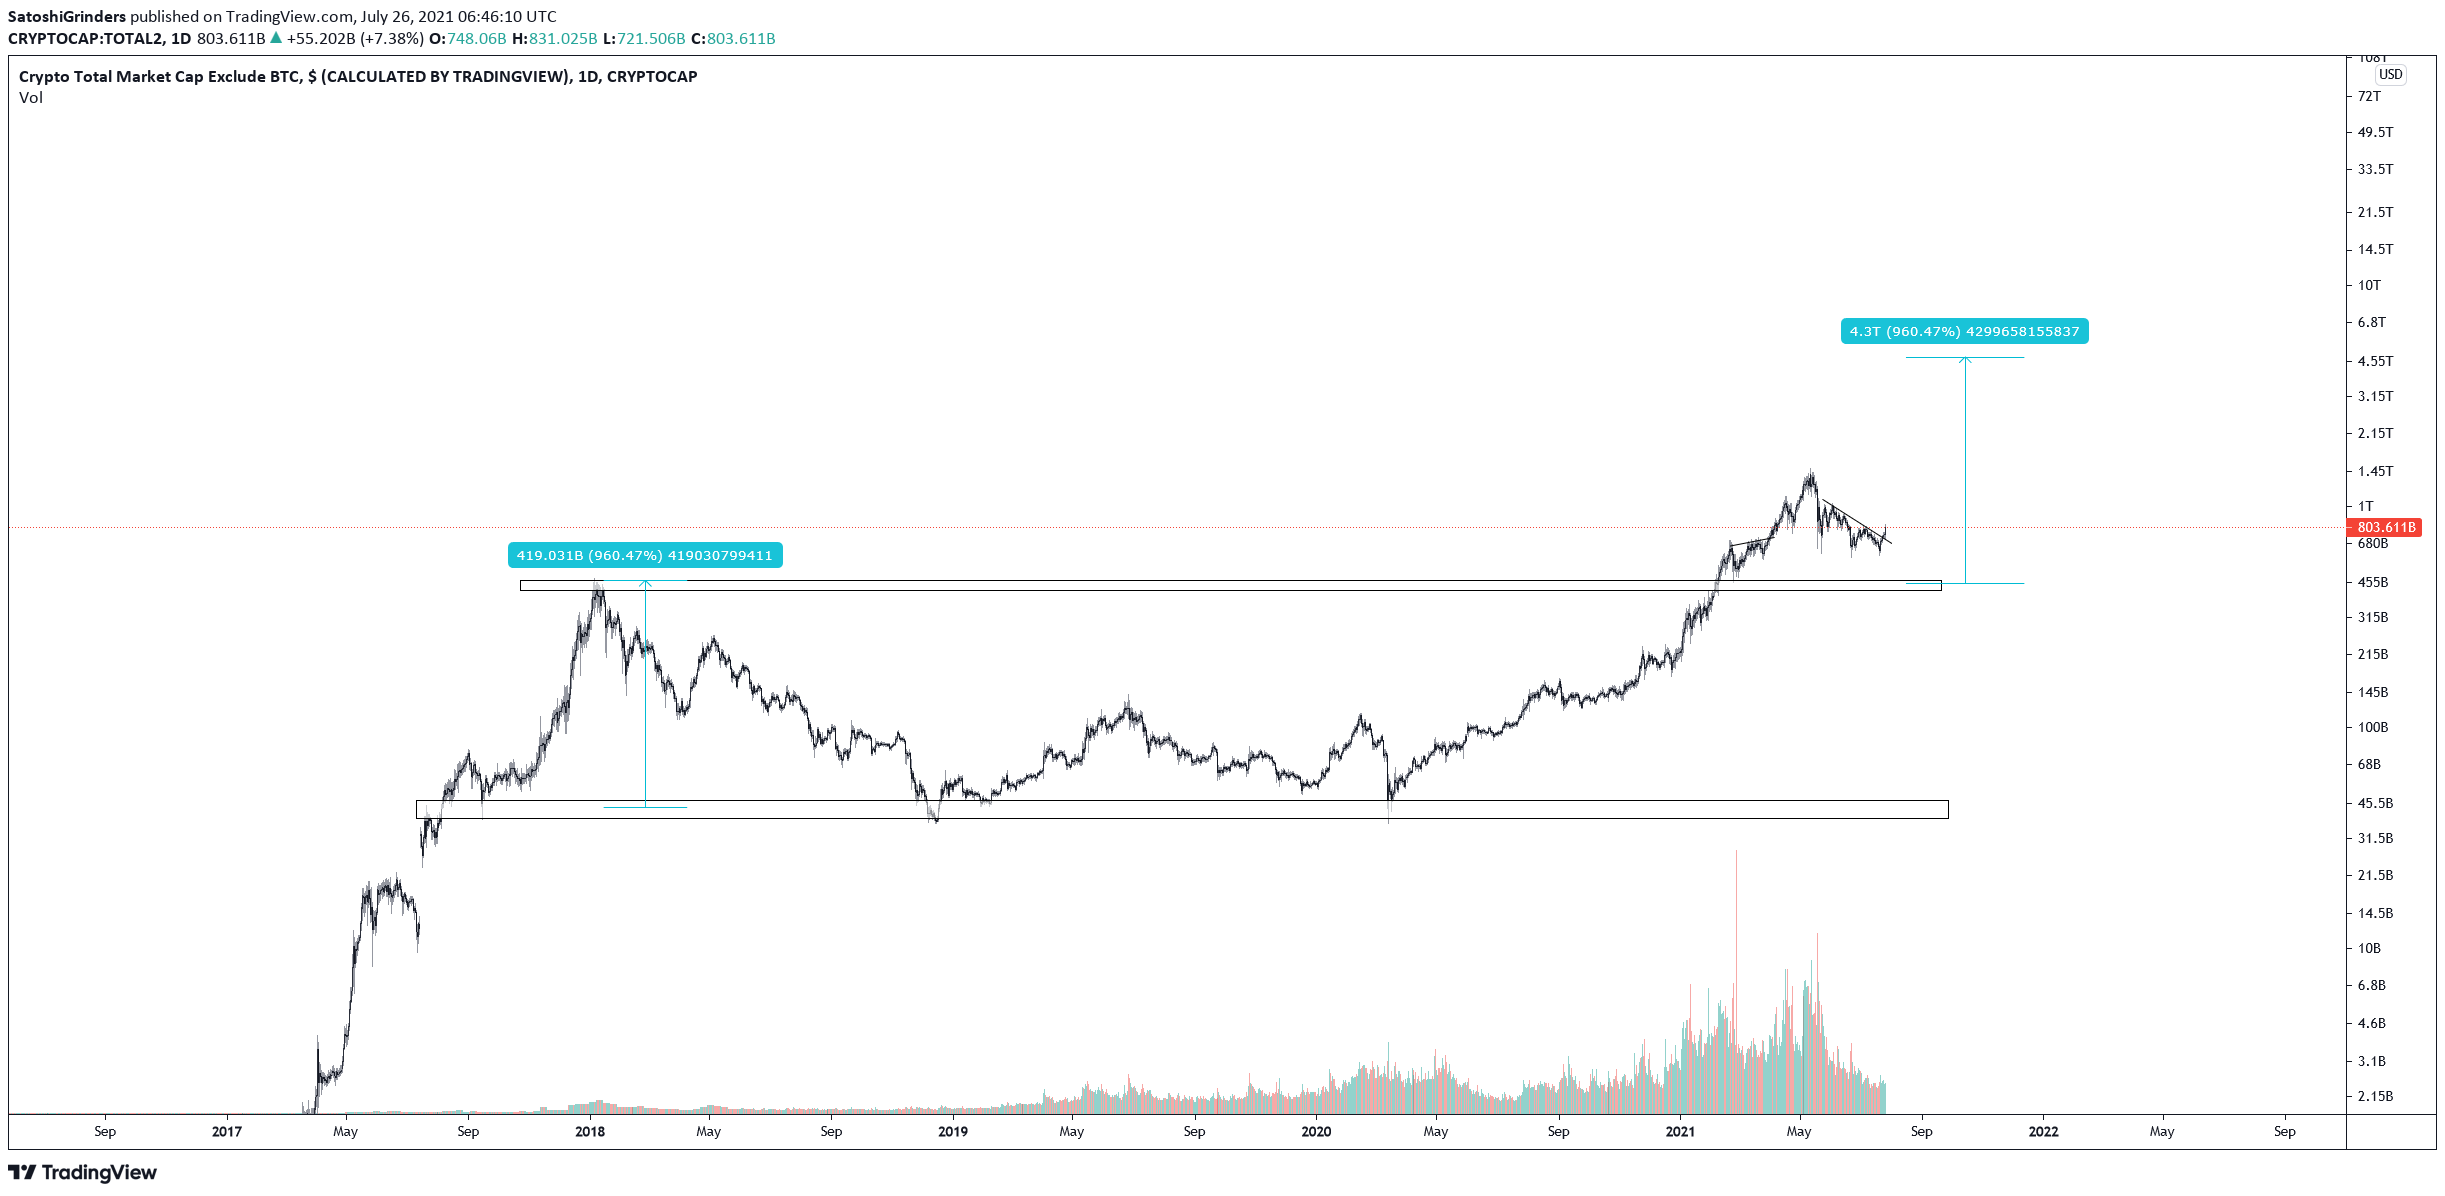
Cryptocurrency trader @Thebull_crypto outlined an altcoin market cap, stating that a new all-time high will be reached by the end of the year.
Since the weekly time-frame looks relatively bearish, a look at the daily one is required in order to determine the direction of the next move.
Future movement
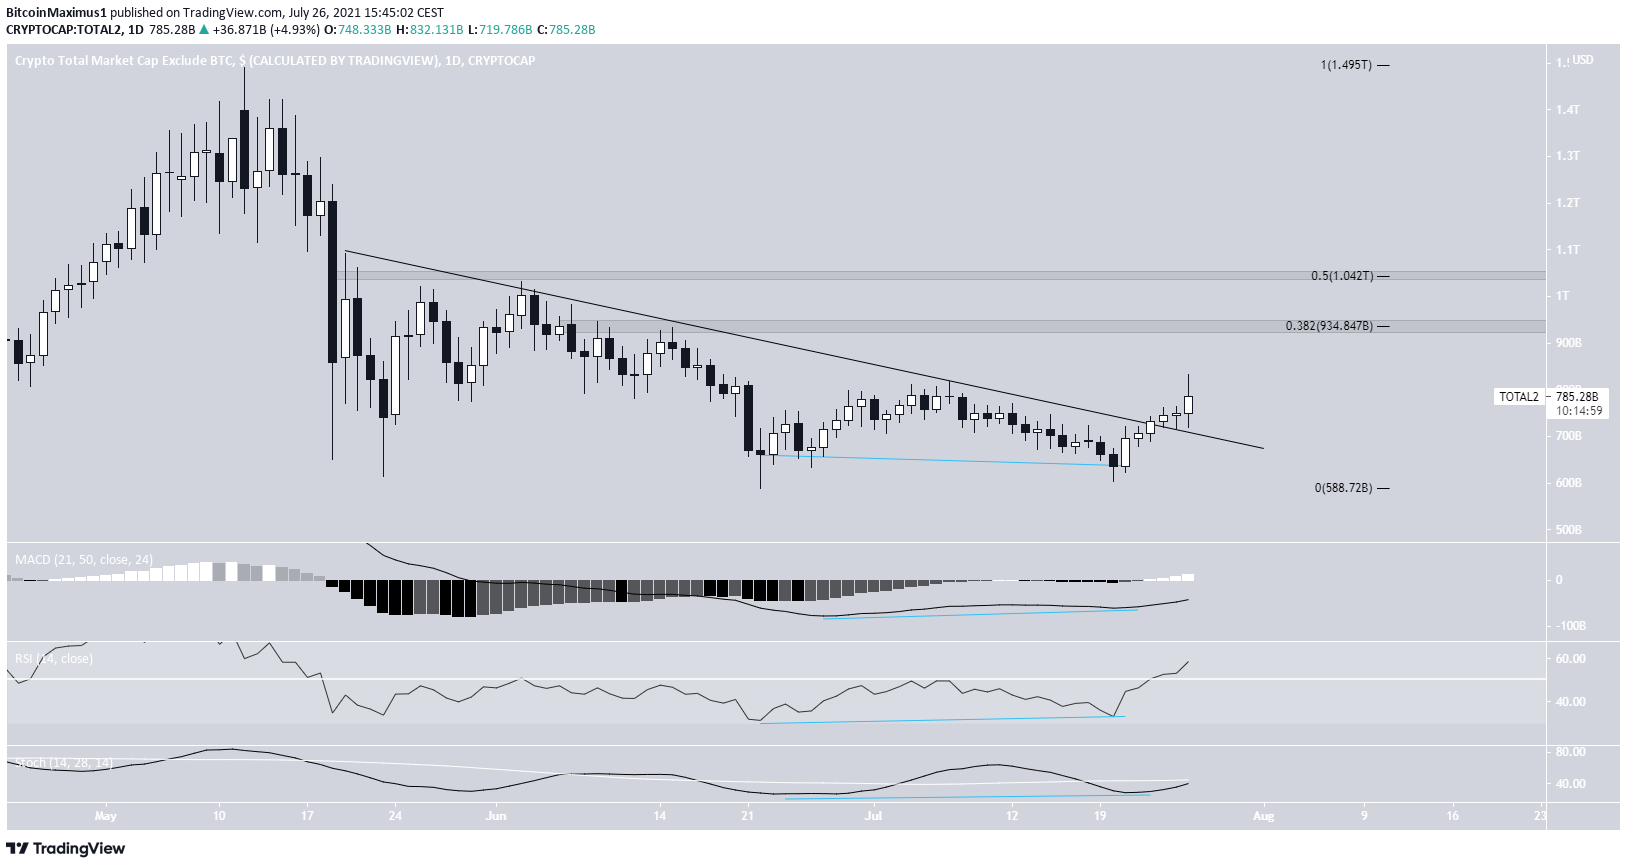
The daily chart provides a more bullish outlook.
The two final touches of the previously outlined long-term support area were combined with bullish divergences in the MACD, RSI & Stochastic oscillator. This effectively created a double bottom pattern.
ALTCAP has been increasing since the second bottom and broke out from a descending resistance line shortly afterwards.
The closest resistance areas are at $934 Billion and $1.04 Trillion. These are the 0.382 and 0.5 Fib retracement resistance levels, respectively.
Total market cap
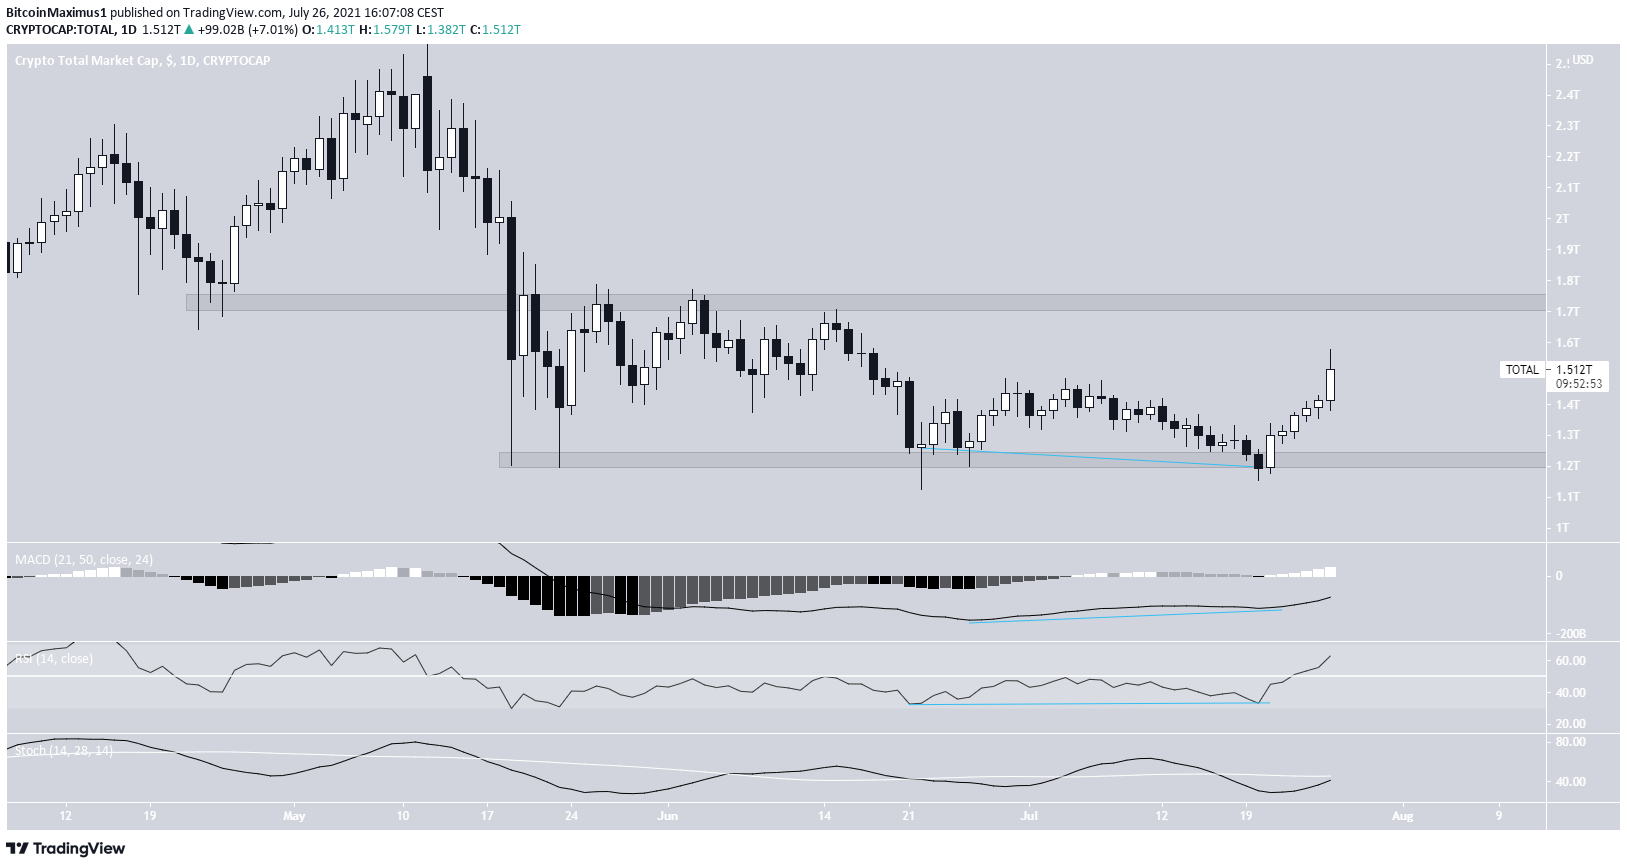
Similarly to ALTCAP, the total market cap (TOTALCAP) bounced at its $1.22 Trillion support area numerous times, before finally initiating an upward movement.
The final two bottoms were combined with multiple bullish divergences.
The closest resistance area is at $1.74 Trillion. TOTALCAP has not traded above this level since the drop on May 19.
For BeInCrypto’s latest bitcoin (BTC) analysis, click here.
