


The Altcoin Market Cap (ALTCAP) has bounced at a crucial Fib level after decreasing by 69% since its all-time high.
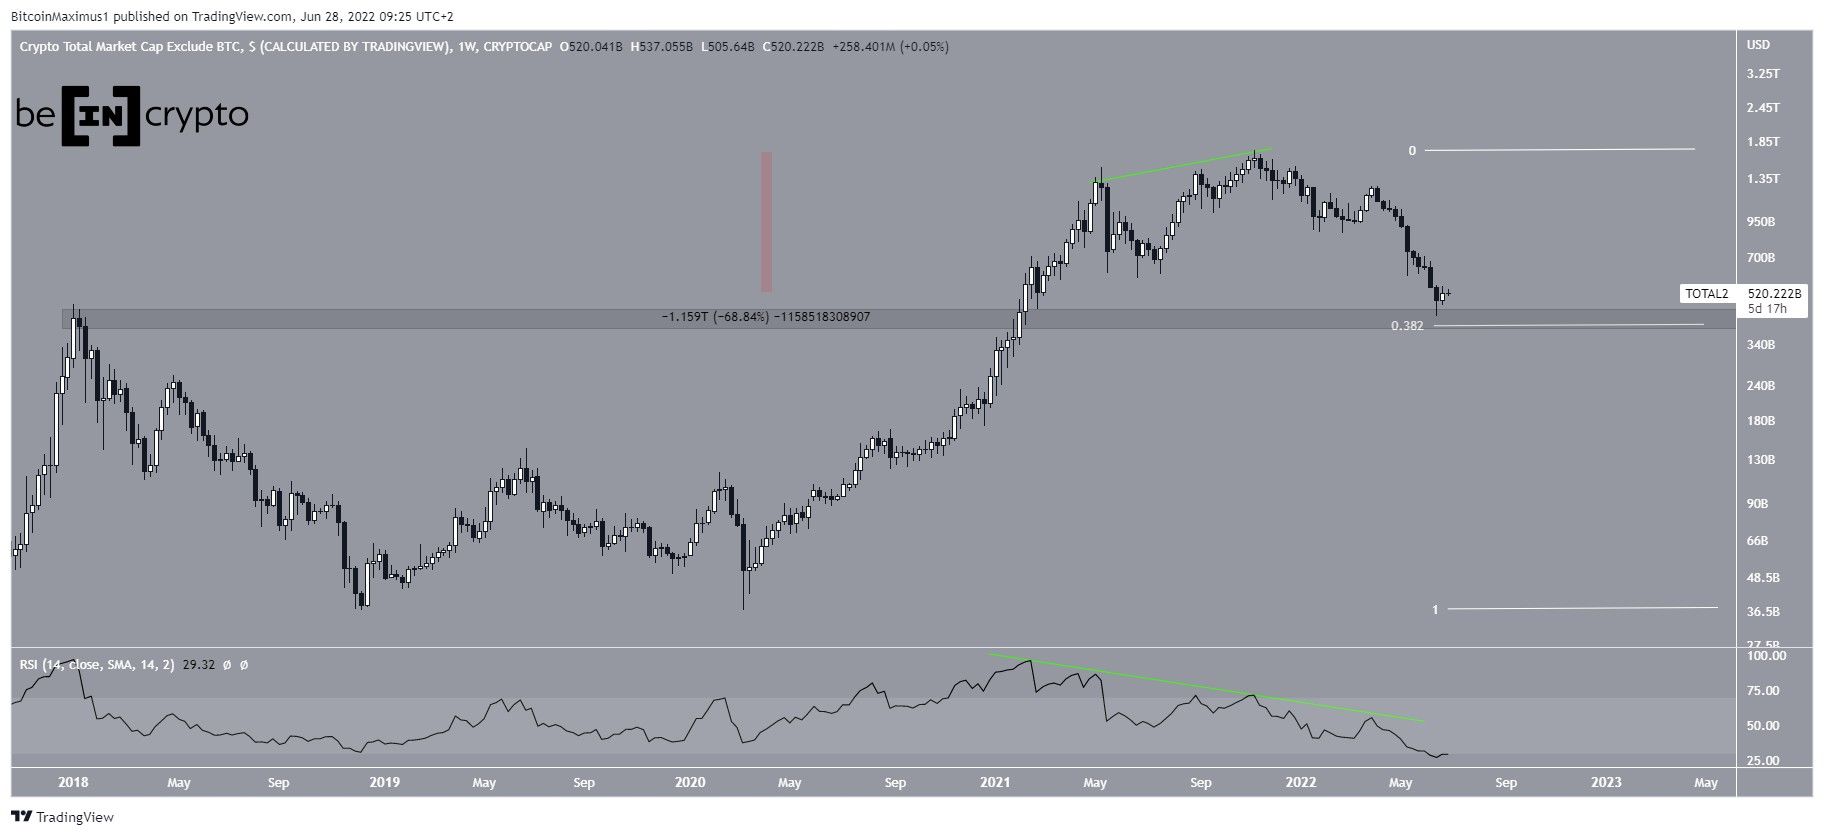
ALTCAP has been falling since reaching an all-time high price of $1.70 trillion in Nov 2021. The decrease was preceded by a bearish divergence in the weekly RSI (green), which has now fallen to oversold territory.
The downward movement continued until a low of $427 billion was reached on June 18. The low was made very close to the 0.382 Fib retracement support level at $395 billion, and inside the previous all-time high support of $445 billion.
So, it is possible to say that the main support area is between $395 and $445 billion. Measuring from the all-time high, ALTCAP has so far fallen by 69%.
Current resistance
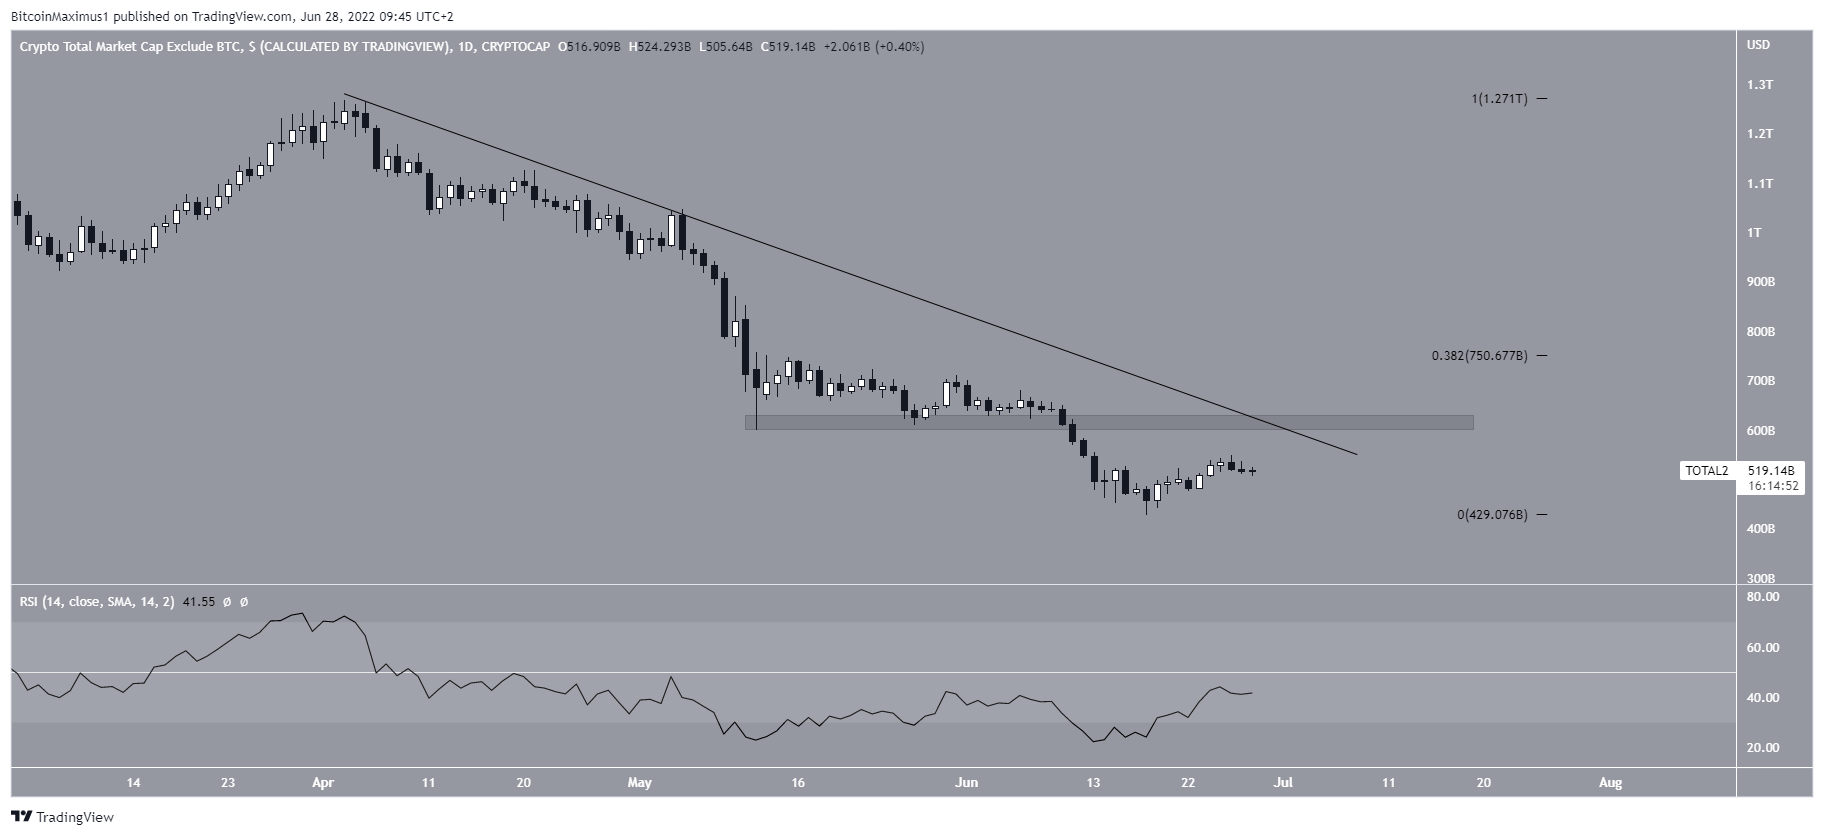
The daily chart shows that ALTCAP has been decreasing underneath a descending resistance line since the beginning of April.
Currently, the resistance line is at $600 billion, coinciding with a horizontal resistance area.
The daily RSI is also increasing and has moved outside its oversold territory. A breakout from the line/area and an RSI movement above 50 would be required in order for the trend to be considered bullish.
If this occurs, the next resistance area would be at $750 billion.
Wave count analysis
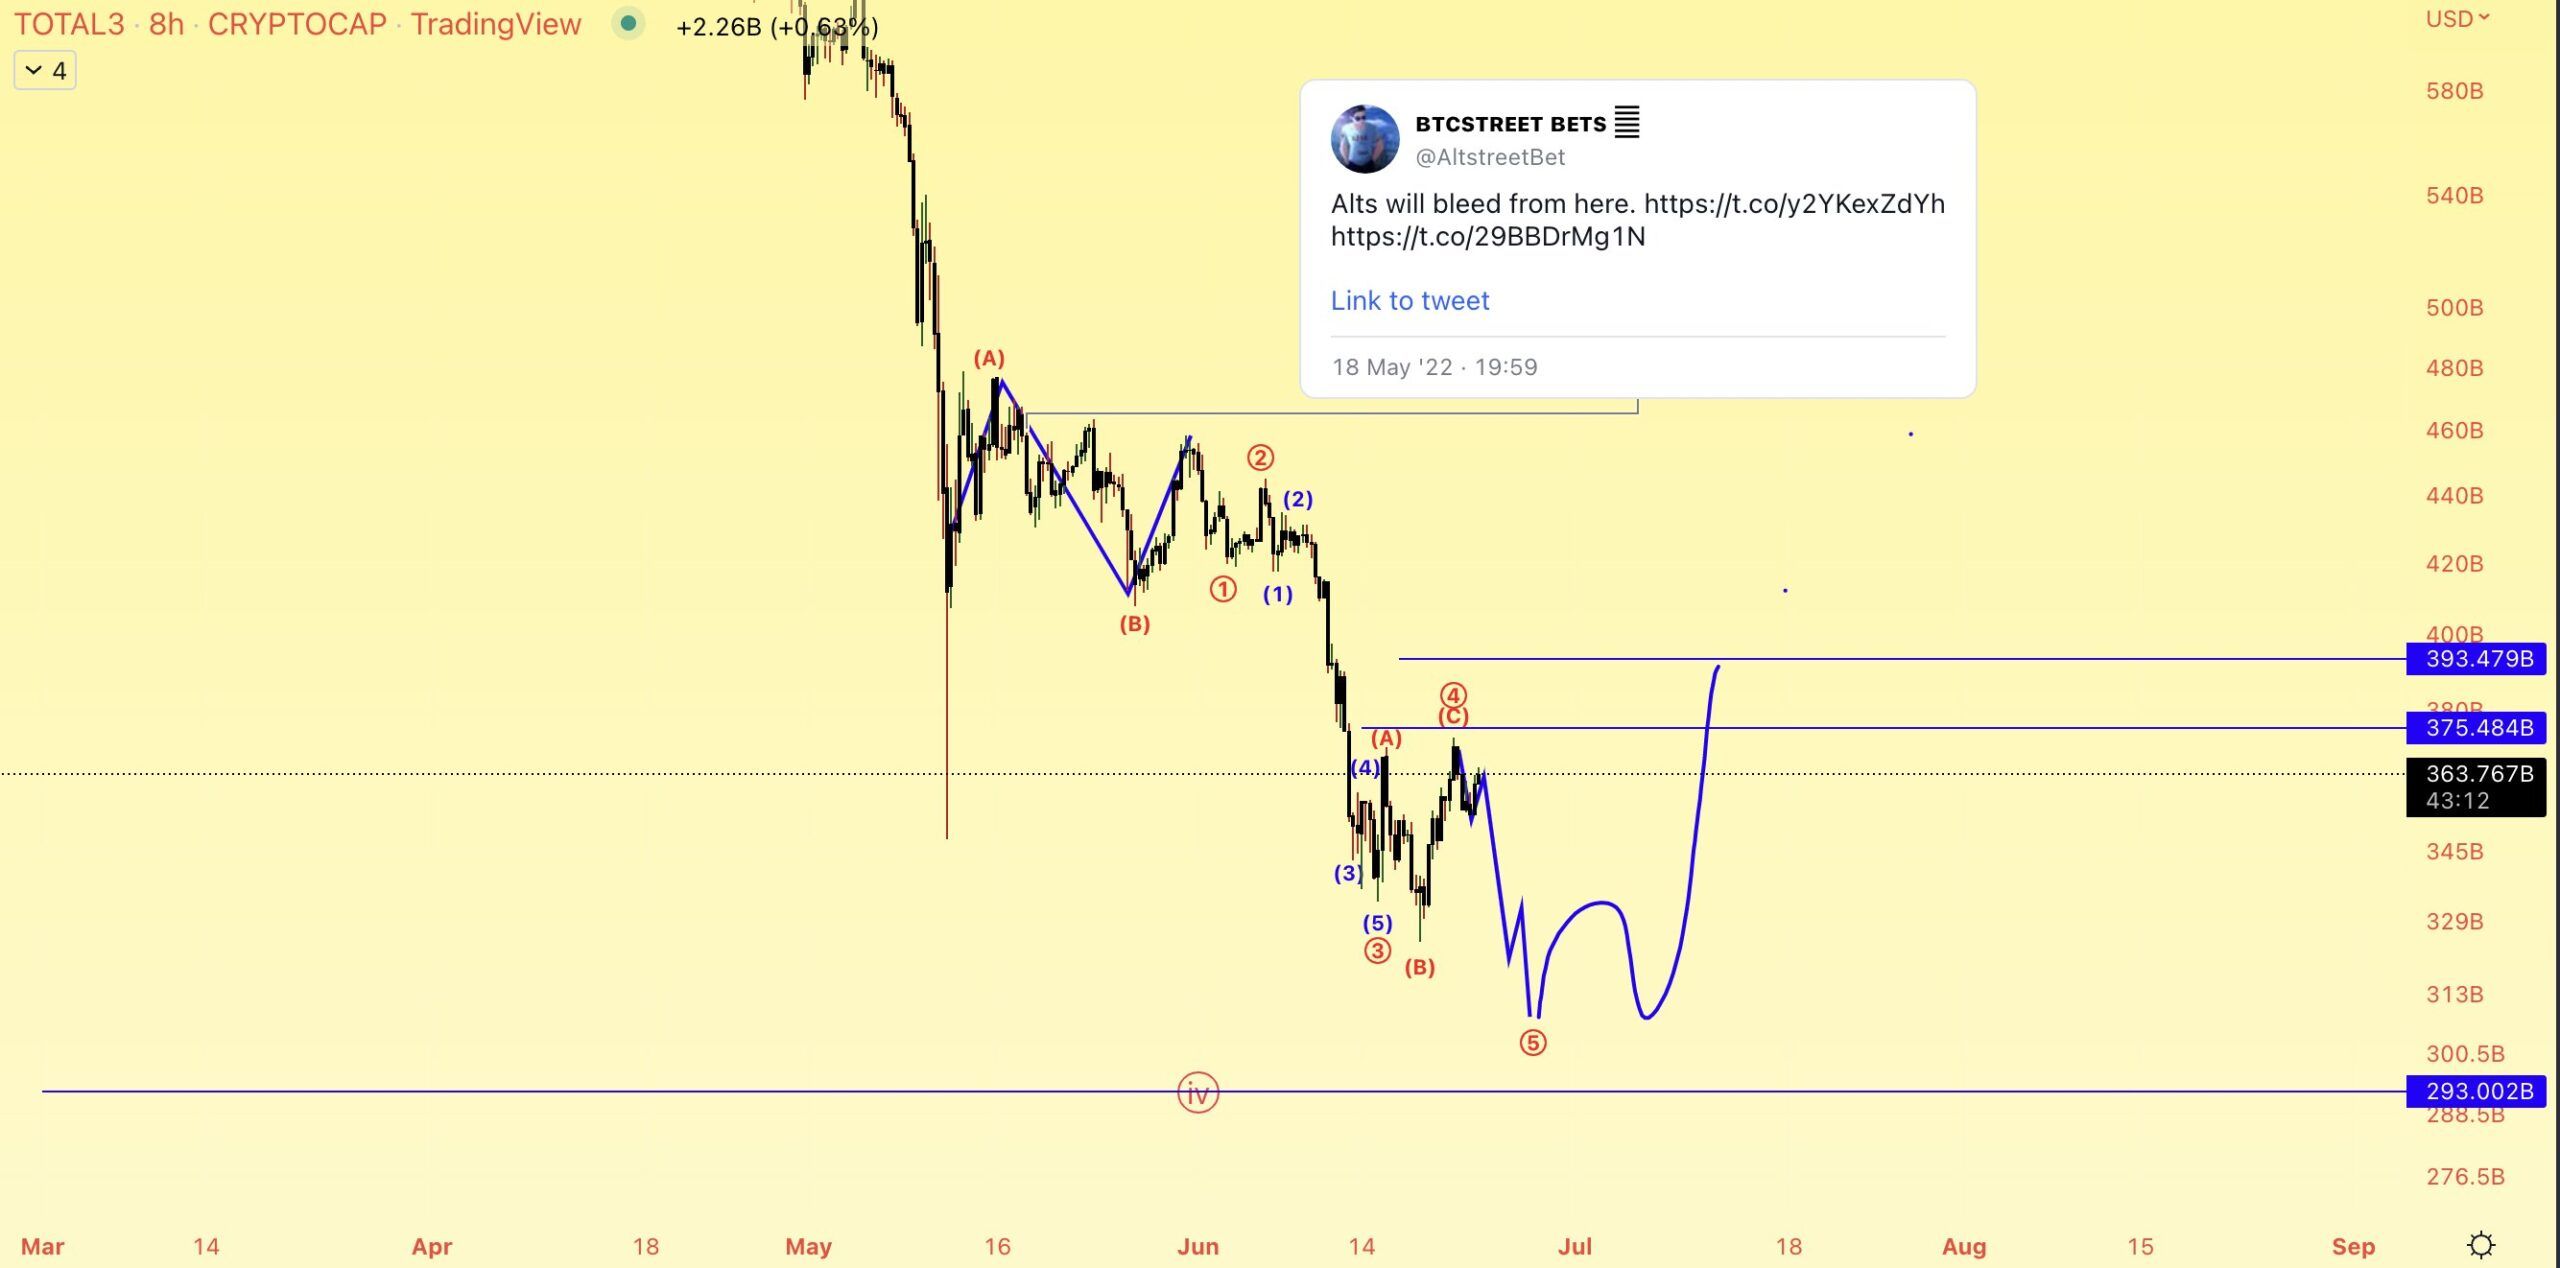
Cryptocurrency trader @Altstreetbet tweeted a chart of ALTCAP, stating that the entire downward movement will be complete after another final drop.
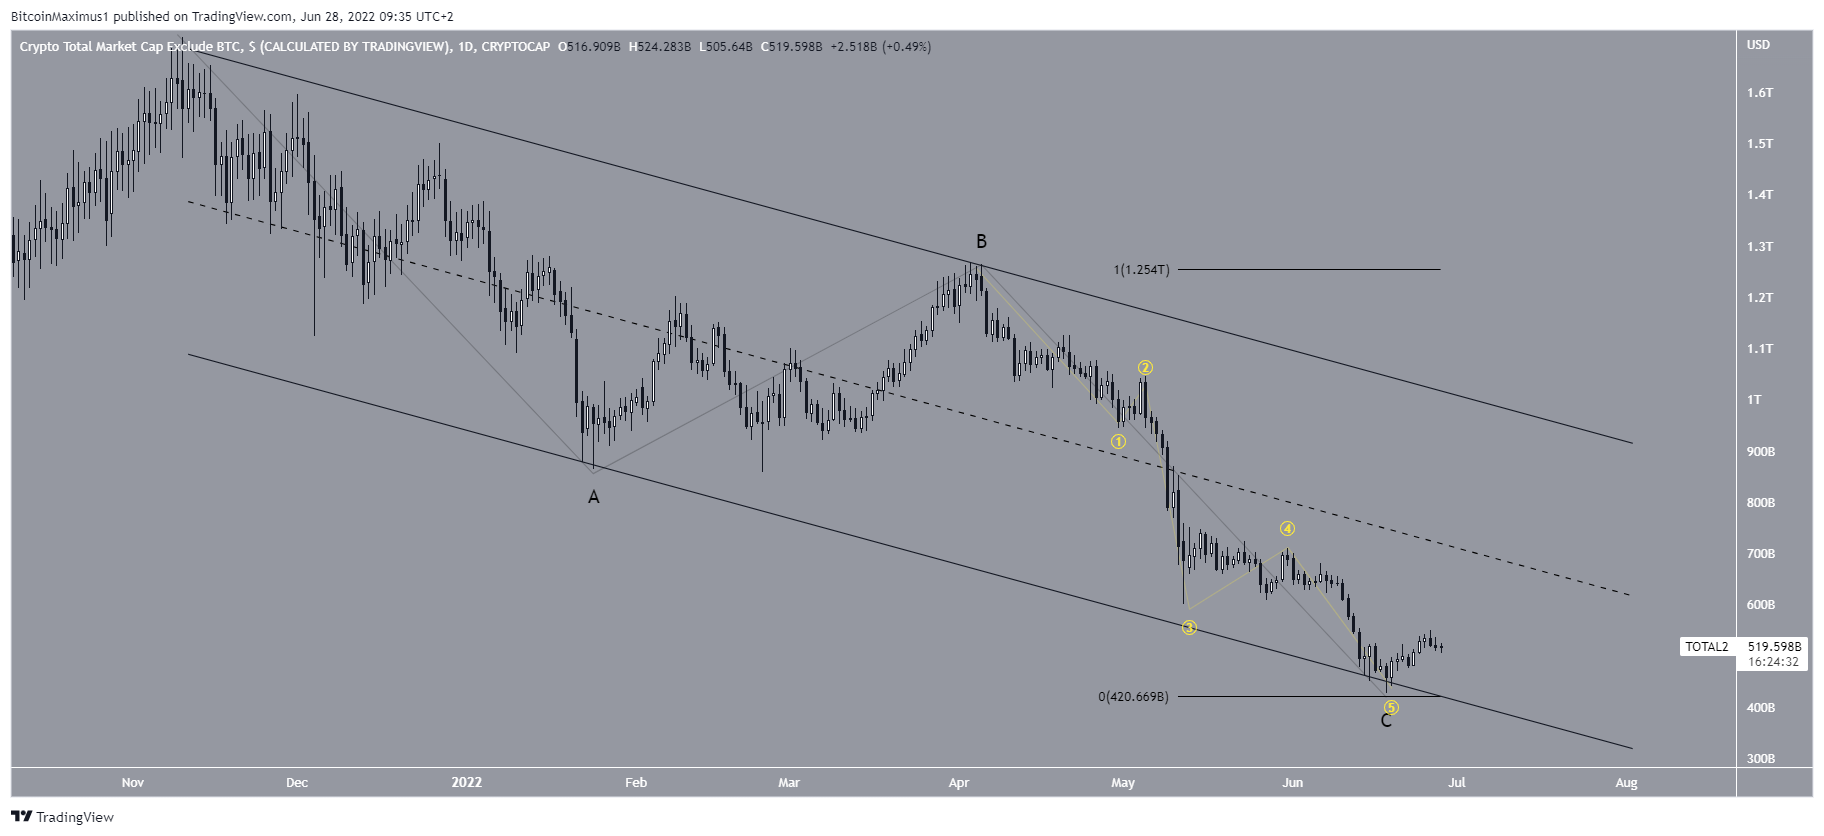
Since the aforementioned all-time high, it is possible that ALTCAP has completed an A-B-C corrective structure (black). The sub-wave count is given in yellow, showing a completed five wave downward movement.
The two main reasons for this are the fact that waves A:C have so far had a 1:1 ratio, and that the movement is contained perfectly inside a descending parallel channel.
An increase above the middle of the channel at $600 billion, which also coincides with the previously outlined resistance line/area would be a strong sign that the correction is complete, and a new upward movement has begun.
For Be[in]Crypto’s latest bitcoin (BTC) analysis, click here


