The altcoin market cap (ALTCAP) has created a bullish pattern just above the $760 Billion support area and could soon initiate an upward movement.
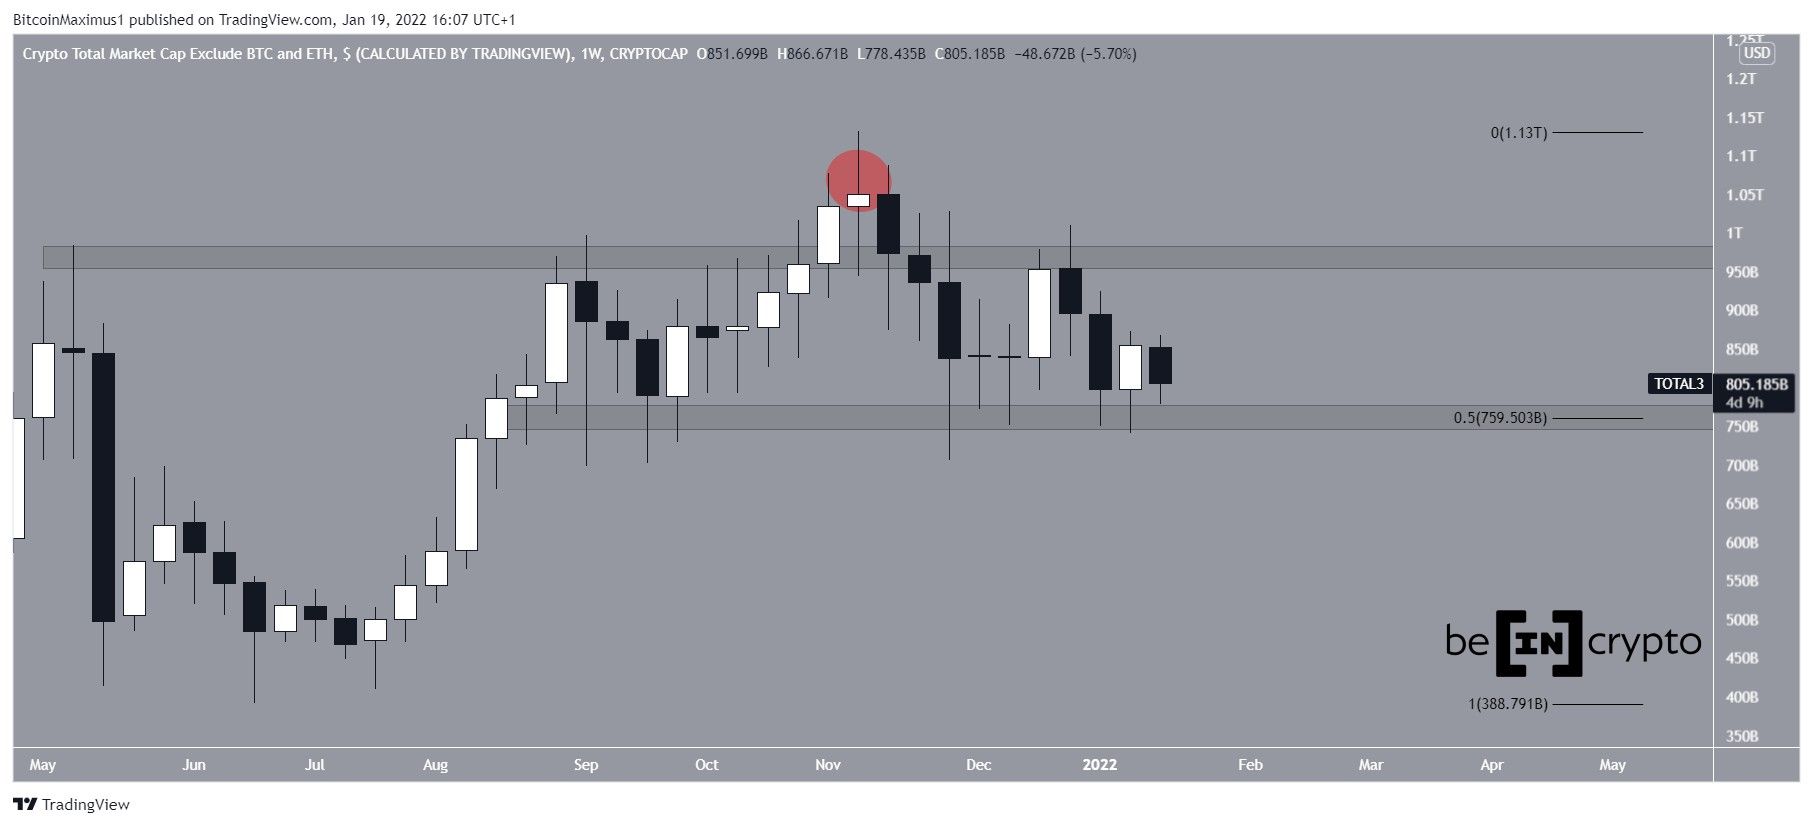
On Nov 10, the total altcoin market cap reached a new all-time high price of $1.31 Trillion. However, it has been moving downwards since.
ALTCAP has fallen below the previous all-time high resistance area of $970 billion, rendering the previous breakout as a deviation (red circle). The $970 area is now acting as resistance once more, most recently causing a rejection in December.
Currently, ALTCAP is trading just above the $760 billion support, which is both a horizontal support area and the 0.5 Fib retracement support level. Due to the confluence of these factors, it is a very strong support level.
Future movement
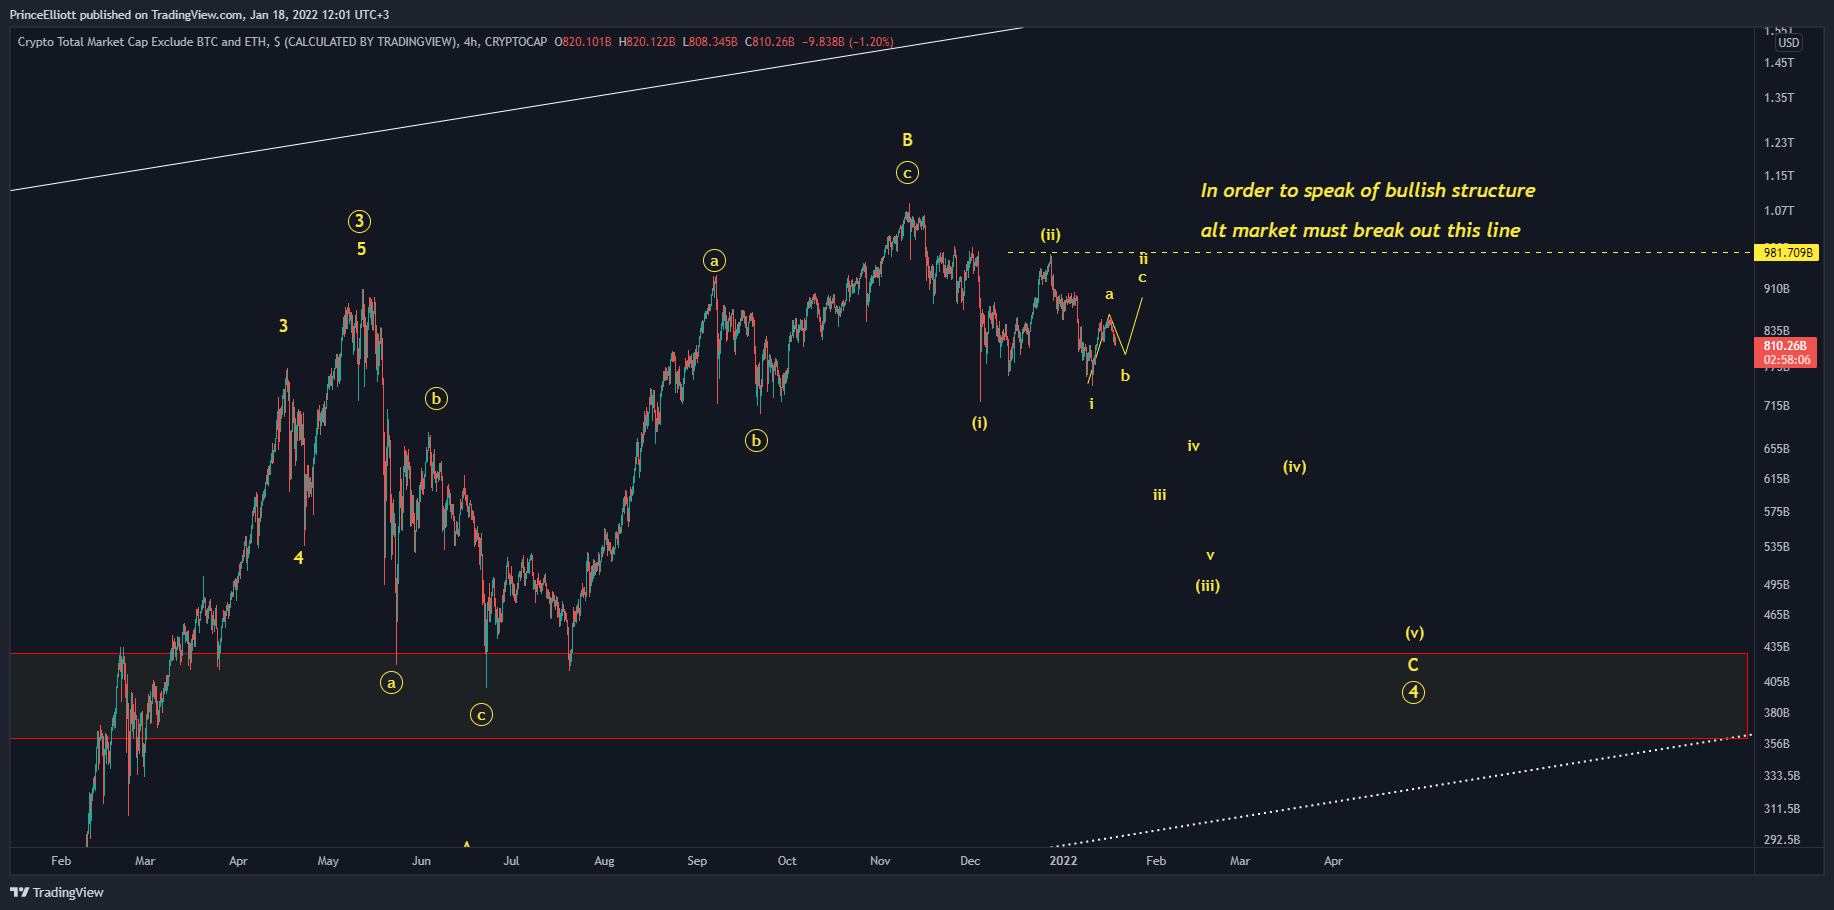
Trader @PrinceofElliott tweeted an ALTCAP chart, stating that it is likely to resume its downtrend in the near future towards $400 billion. However, he suggests an upward movement will transpire prior to the decrease.
A closer look at the daily chart aligns with this assessment.
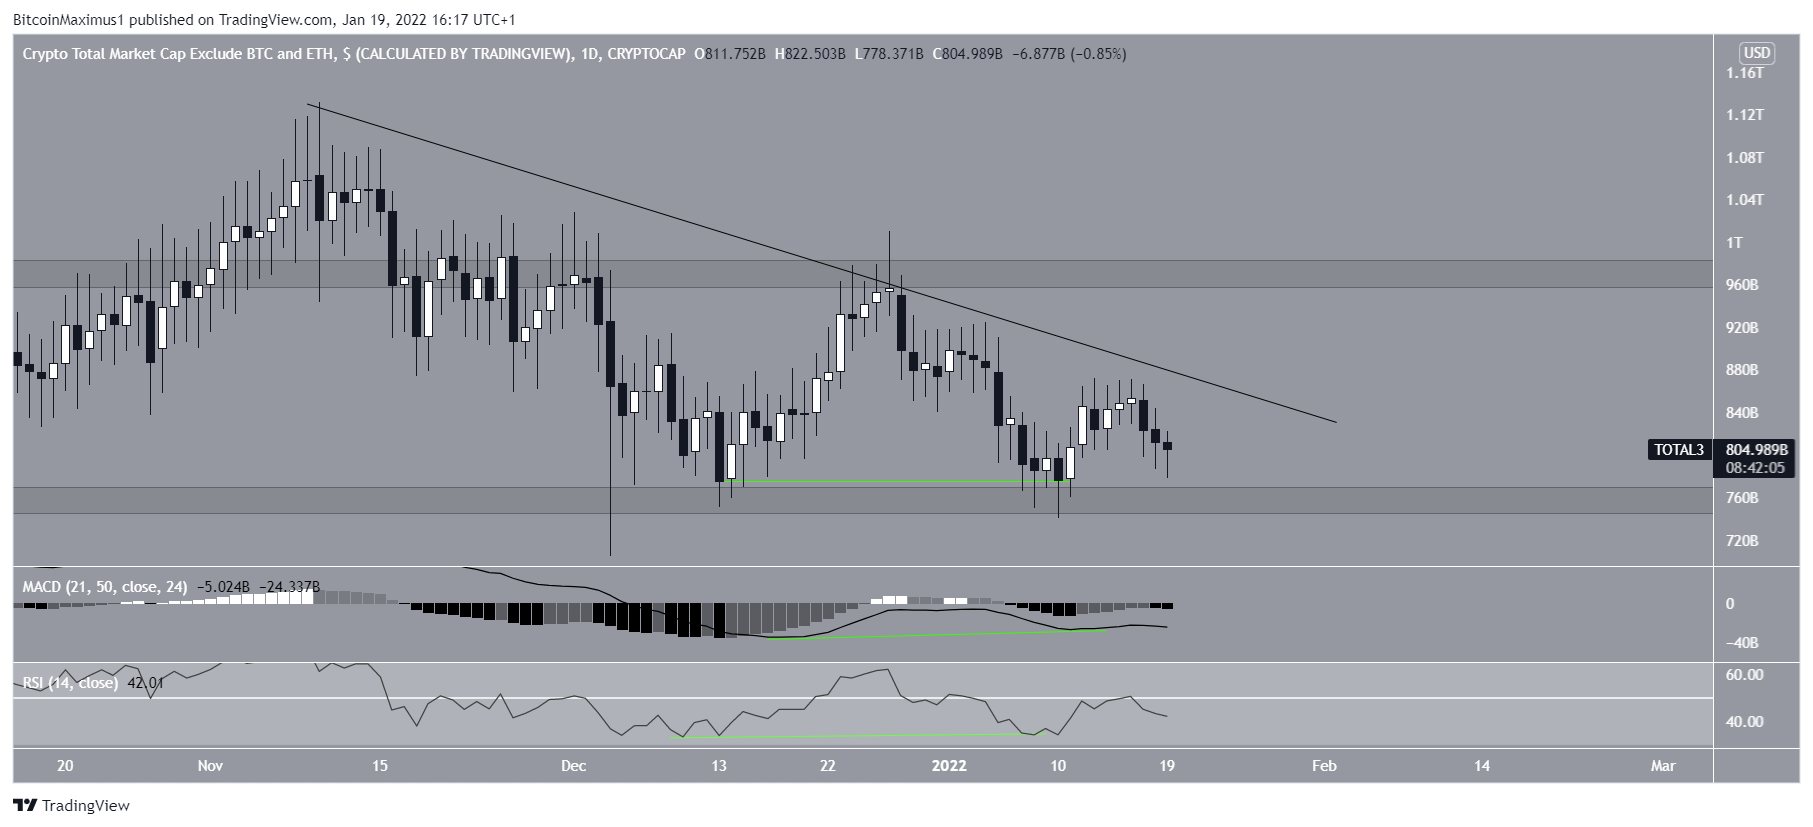
ALTCAP has created a double bottom above the $760 billionn support area. The double bottom is considered a bullish pattern, meaning that it often leads to upward movements.
Furthermore, the pattern has been combined with bullish divergences in both the RSI and MACD (green lines). Such divergences often precede upward movements. The fact that they are transpiring alongside a bullish pattern further supports the possibility that an increase will follow.
A breakout from the descending resistance line in place since Nov 10 would confirm that the upward movement has begun.
In that case, an ALTCAP upward movement towards the $970 billion resistance area would be the most likely scenario.