


Alpha Finance Lab (ALPHA) bounced on May 23, temporarily halting a downward movement that has been going on since May 11.
It’s possible that the correction that began on Feb. 5 has ended and the token has now begun an upward movement.
Ongoing ALPHA decrease
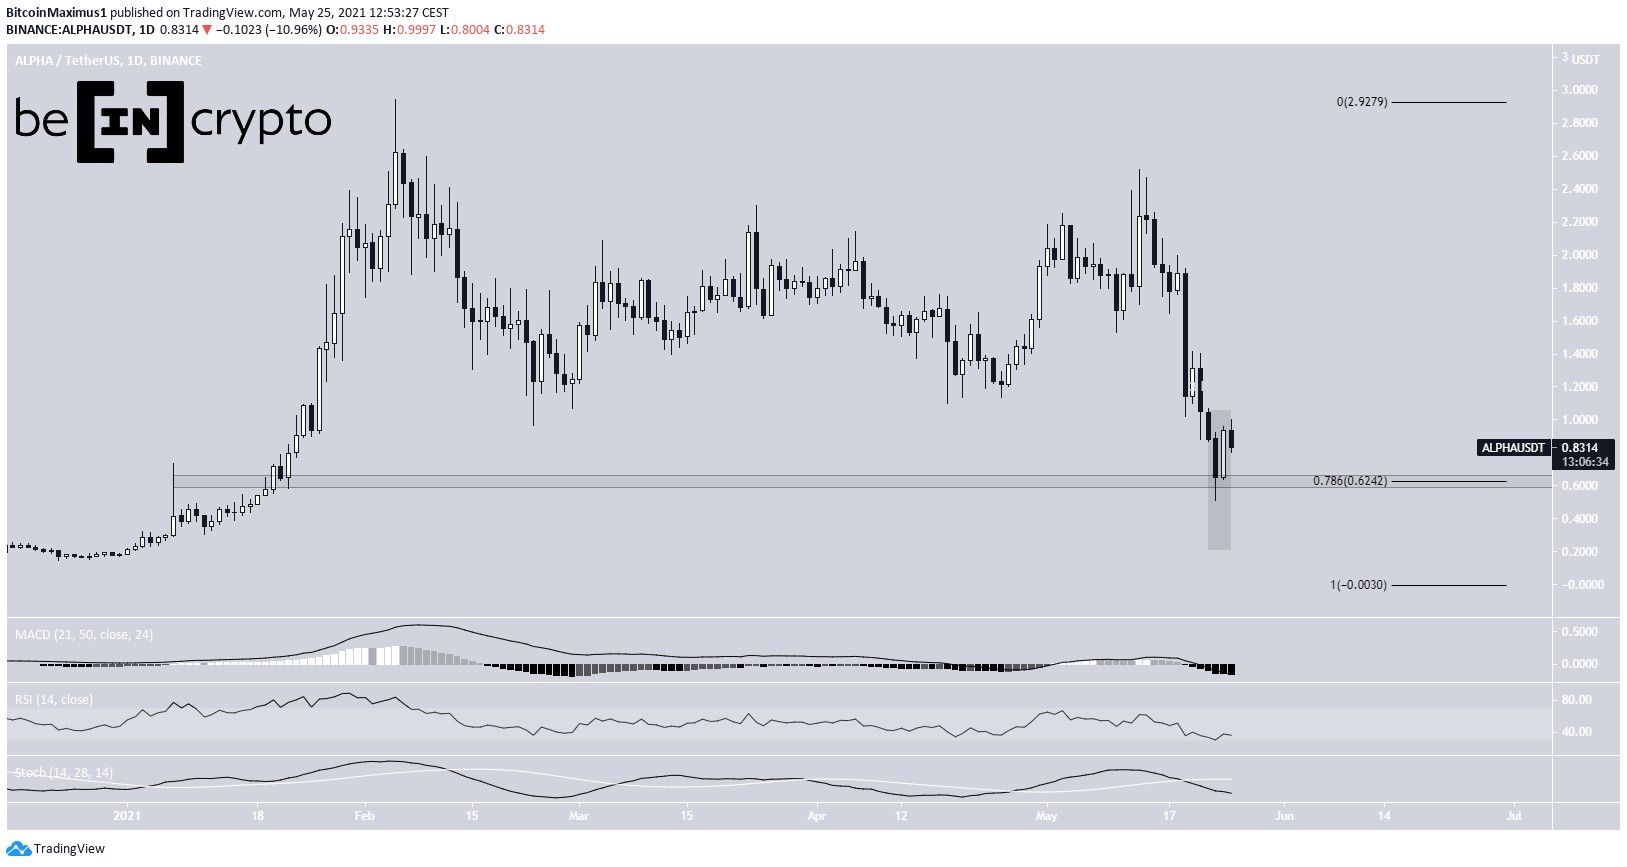
ALPHA has been decreasing since reaching an all-time high price of $2.94 on Feb. 5. It created a lower high on May 11 and resumed its downward movement after.
The decrease culminated with a low of $0.50 on May 23. The next day, ALPHA created a bullish engulfing candlestick. As a result, it has now reclaimed the 0.786 Fib retracement support level at $0.625.
However, technical indicators are still bearish. The MACD is decreasing, the Stochastic oscillator has made a bearish cross, and the RSI is close to crossing below 30.
Short-term movement
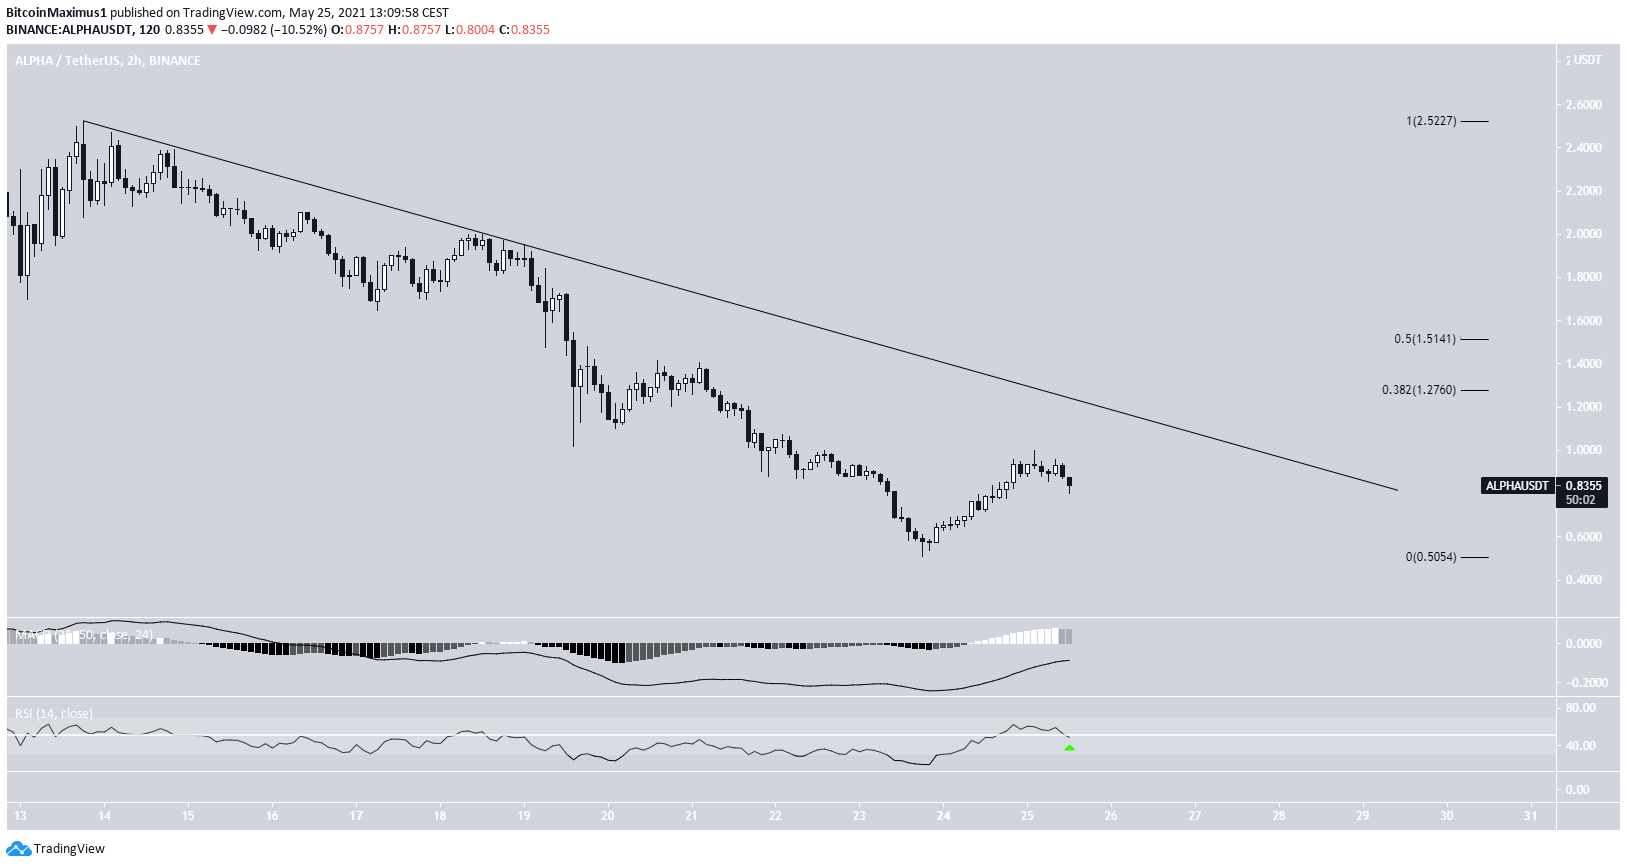
The two-hour chart shows a descending resistance line that has been in place since the May 11 high. So far, ALPHA has made three unsuccessful breakout attempts.
However, technical indicators are bullish. The RSI is just above 50 and the MACD is close to turning positive.
If a breakout occurs, the closest resistance levels would be found at $1.27 and $1.51. These are the 0.382 and 0.5 Fib retracement levels when measuring from the high.
ALPHA wave count
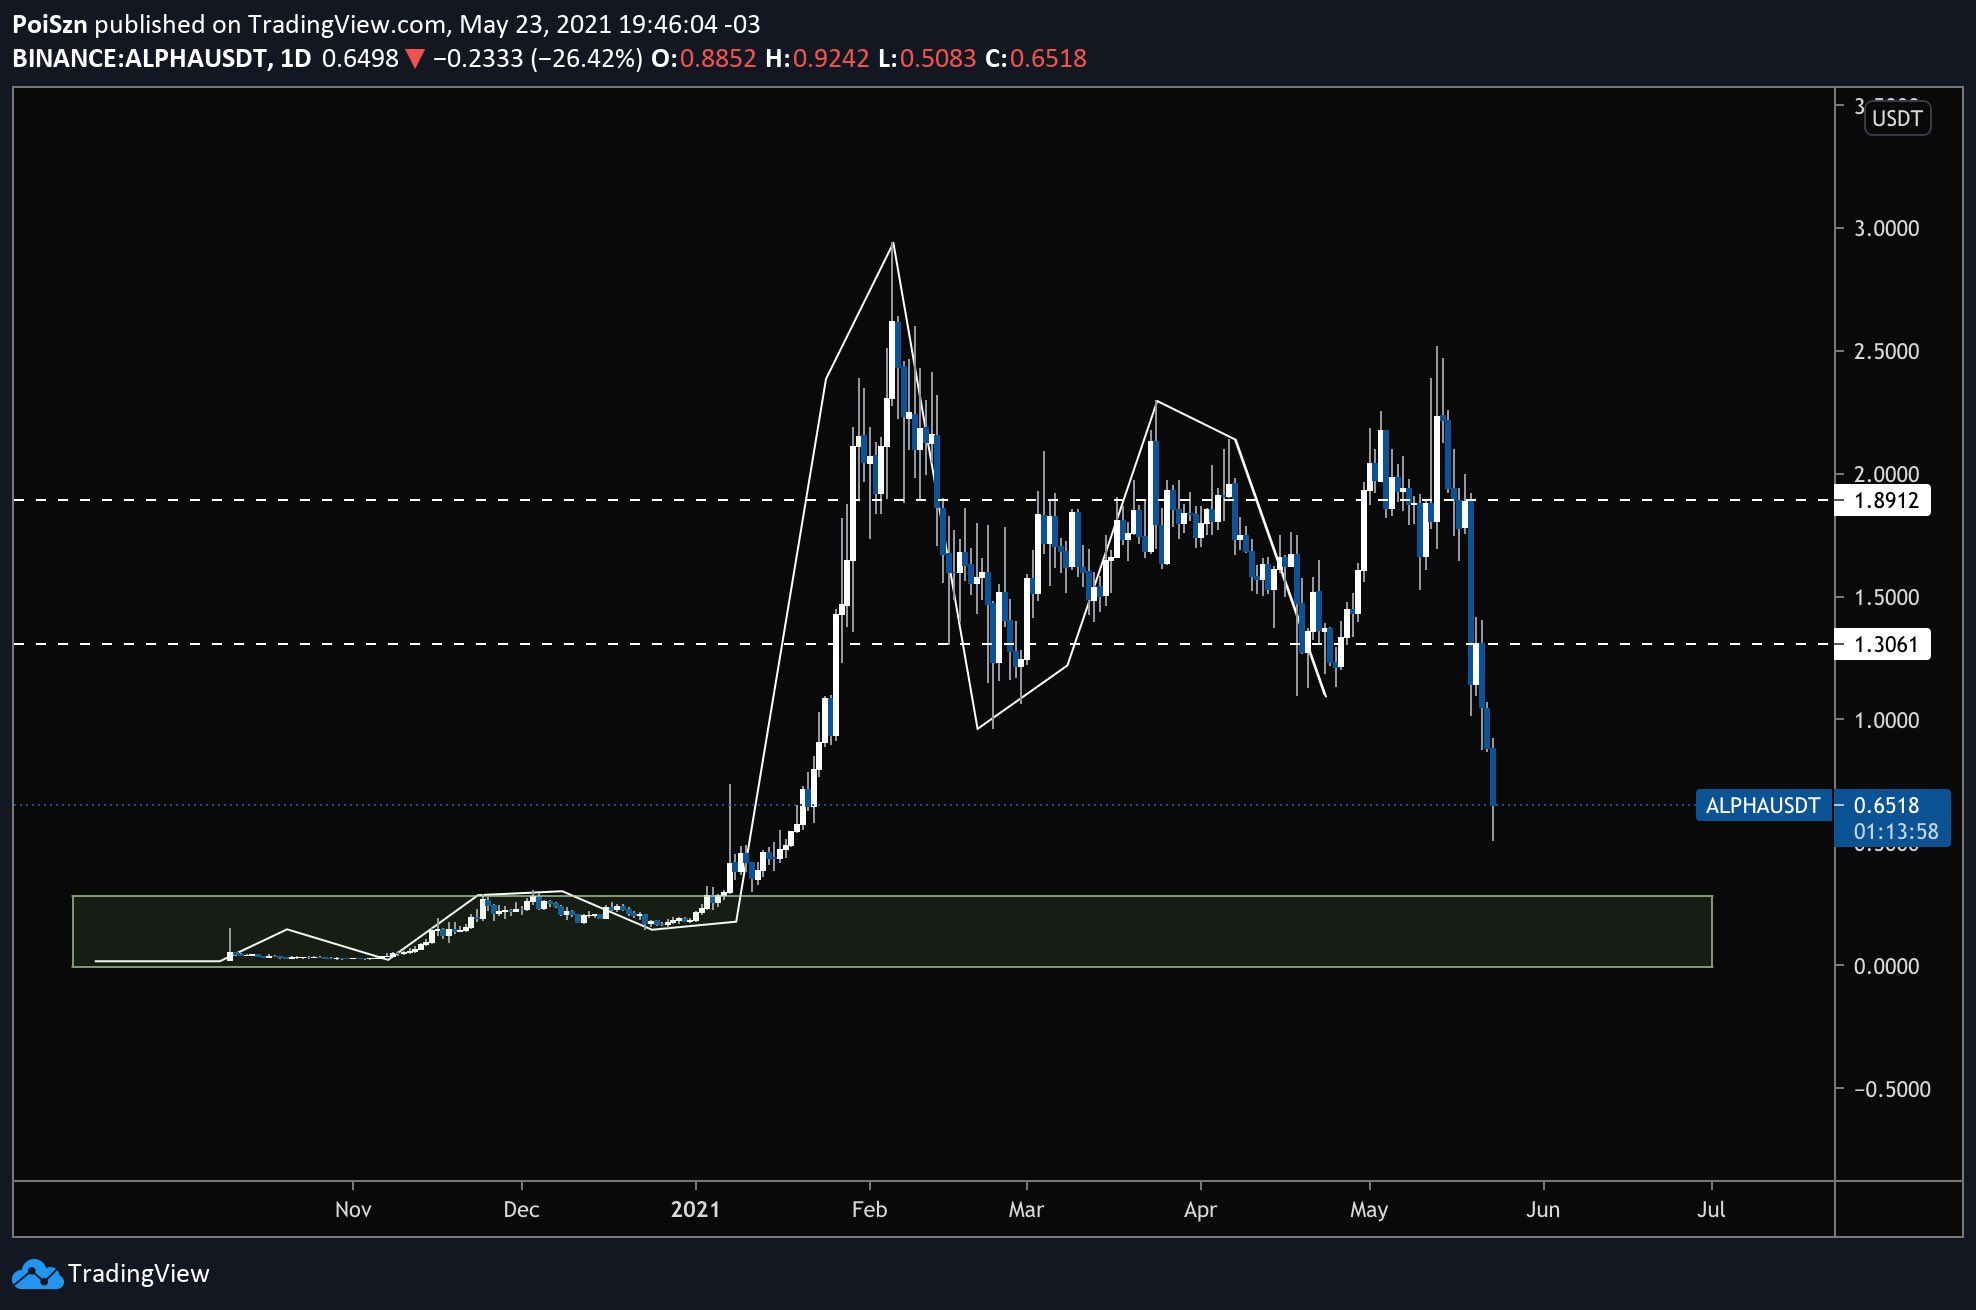
Cryptocurrency trader @PoiSzn outlined an ALPHA chart, stating that it is approaching the range which was the catalyst for the initiation of the upward movement.
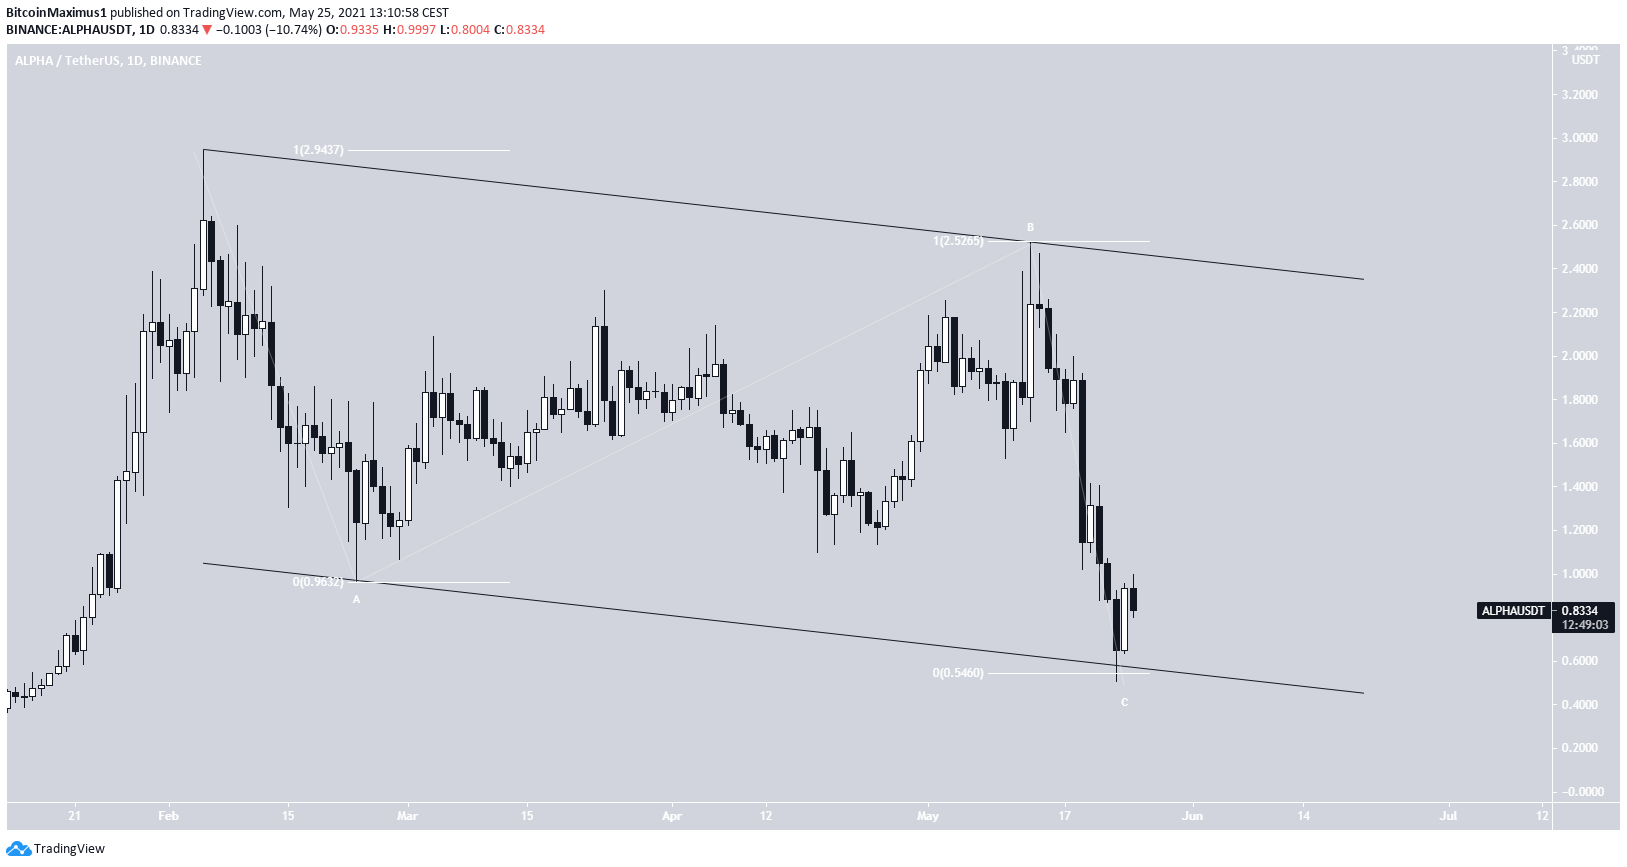
Since the all-time high, ALPHA has been trading inside a descending parallel channel. Such channels often contain corrective structures.
In addition, both portions of the decrease have a 1:1 ratio. This suggests that the movement inside the channel is an A-B-C corrective structure.
If so, ALPHA would be expected to break out and eventually head to new highs.
For BeInCrypto’s latest bitcoin (BTC) analysis, click here.



