


The Algorand (ALGO) price has reached a make-or-break resistance level. Moving above it would confirm the bullish trend reversal.
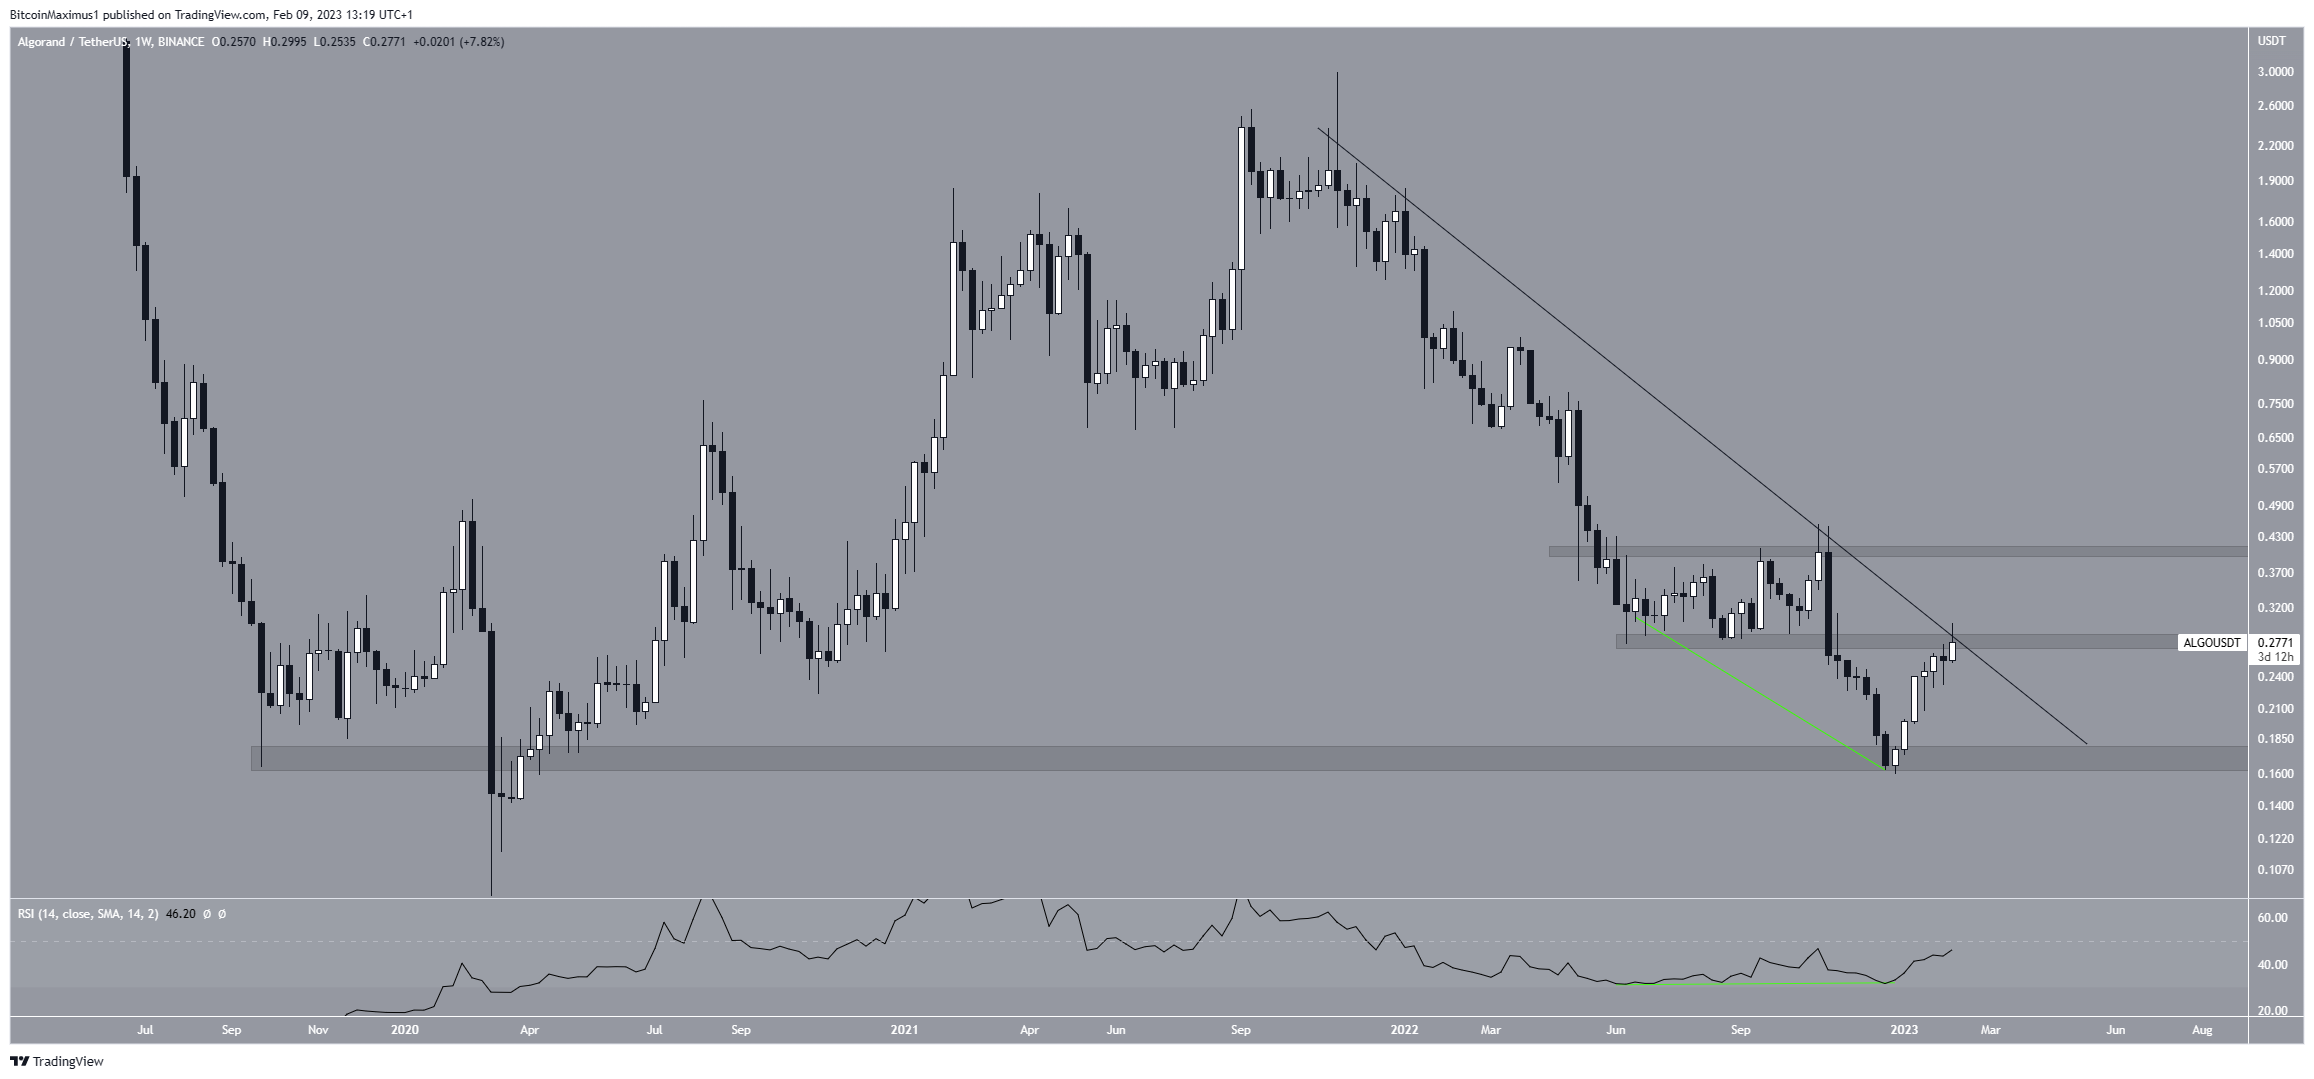
Since reaching an all-time high of $2.99 in Nov. 2021, the Algorand price has fallen below a descending resistance line. The lowest price reached was $0.16, from there ALGO began the current upward movement.
The increase was preceded by bullish divergence in the weekly RSI (green line). The indicator could now move above 50, confirming the bullish trend.
The price action also shows that the ALGO price is at the crucial resistance level of $0.28. The level coincides with the long-term descending resistance line. While the Algorand price has increased above it, it has yet to reach a weekly close above $0.28.
So, if the price breaks out, it will confirm the bullish reversal and could lead to a movement toward the next resistance area at $0.41.
Algorand Price Moves Above Key Resistance
The technical analysis from the daily chart shows that the Algorand price broke out from the $0.273 resistance area on Feb. 7. Over the past 24 hours, it has been in the process of validating it as support. If successful, this could lead to an upward movement toward the next resistance at $0.34.
The daily RSI reading is very interesting. While the indicator previously generated bearish divergence, it broke out from the trend line on Feb. 7 and could now be validating it as support. Therefore, the daily readings lean on the trend being bullish. ALGO may increase to the next resistance area at $0.34. If this occurs, it will also cause a breakout from the long-term descending resistance line.
However, if the ALGO price were to break down below the $0.27 area, it would also break down from an ascending support line in place since the beginning of the year. Therefore, it would confirm that the upward movement has come to an end. In that case, the price could fall to the 0.5 Fib retracement support level at $0.23.
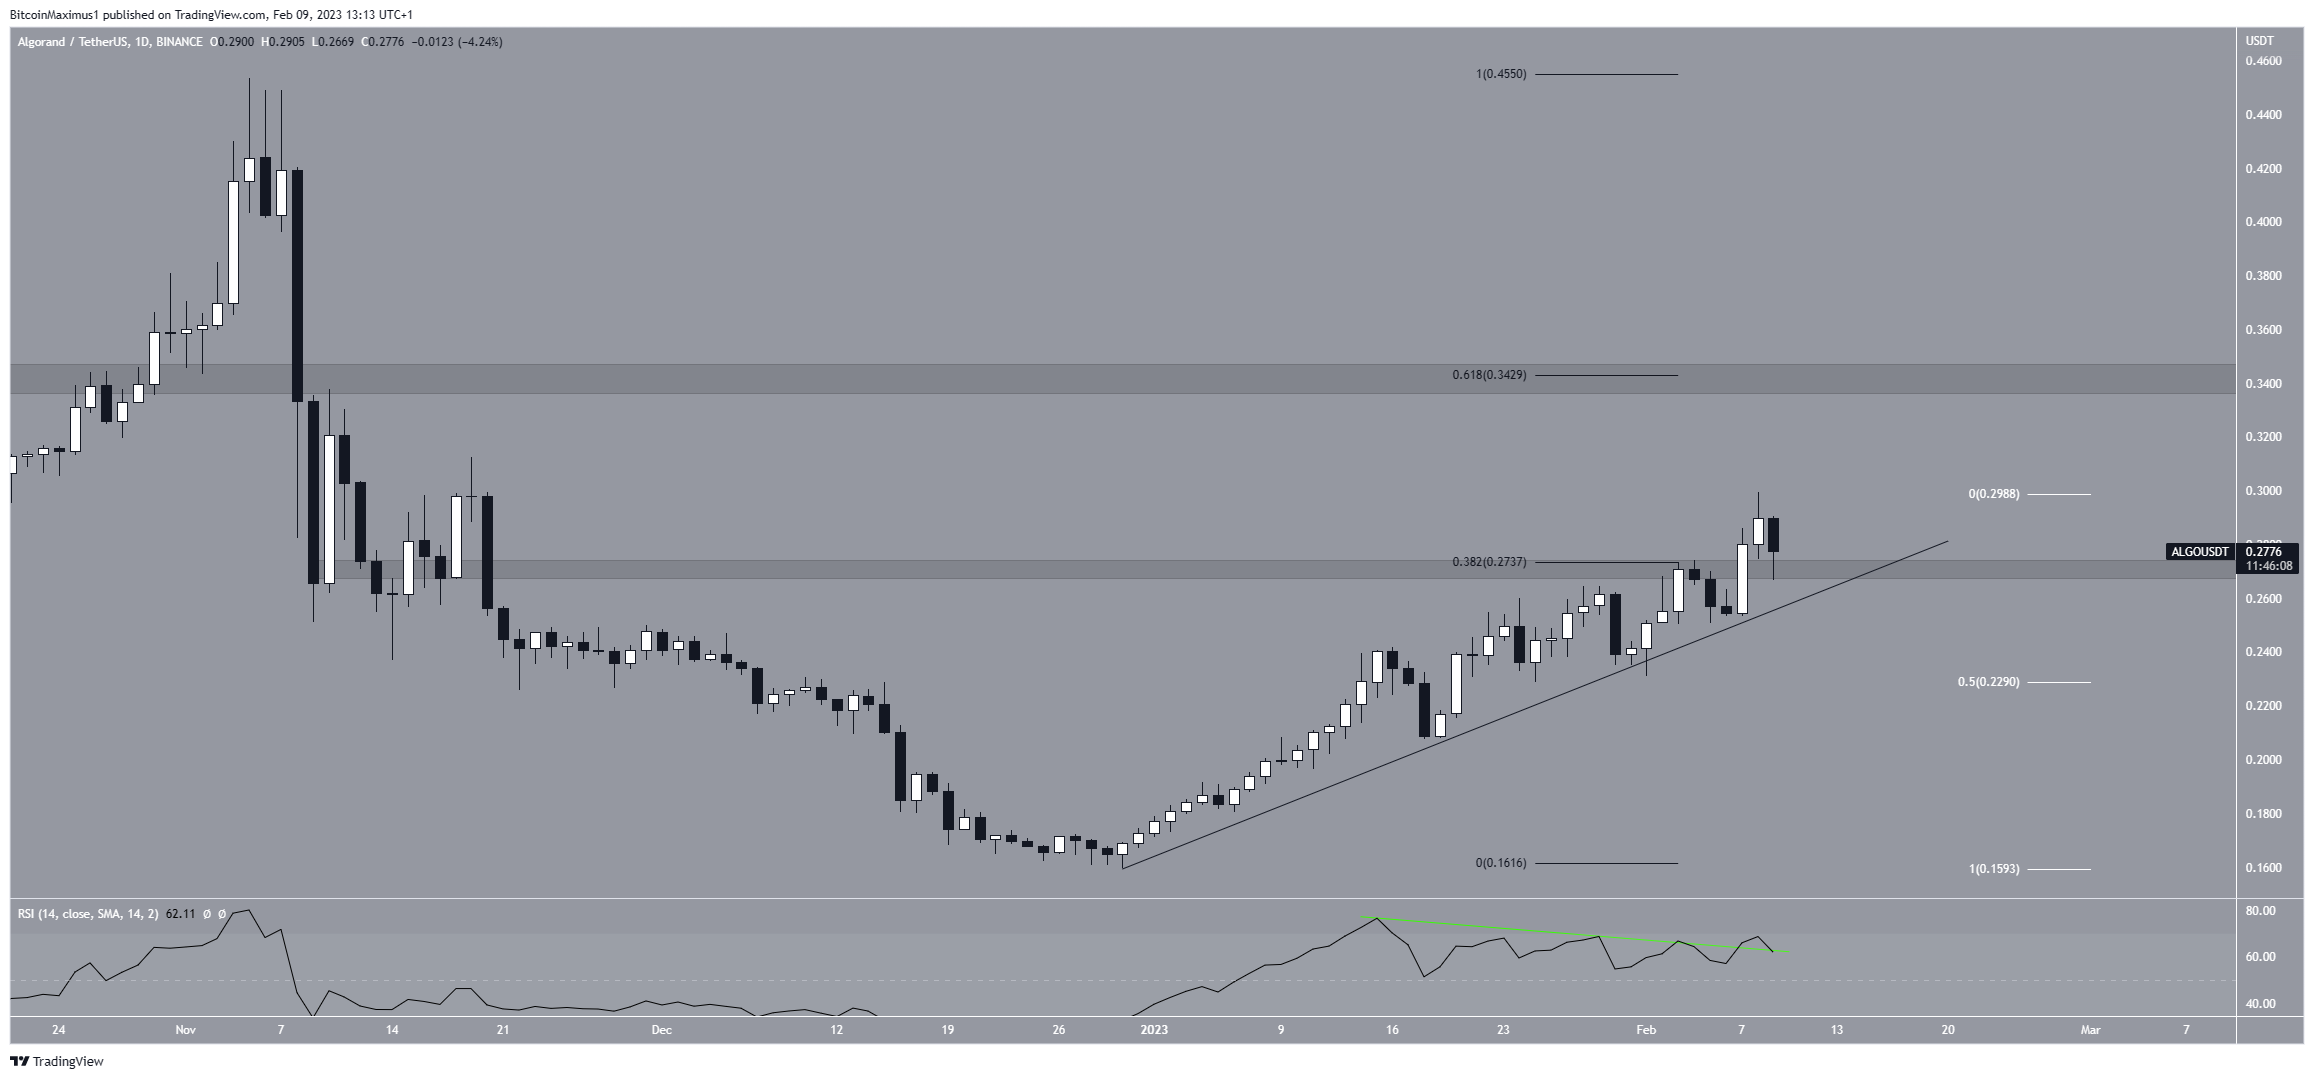
To conclude, the most likely Algorand price forecast is an increase to the next resistance area at $0.34. However, a daily close below $0.27 would invalidate this outlook and suggest that the price will fall to the closest support area at $0.23 instead.
For BeInCrypto’s latest crypto market analysis, click here.


