The Algorand (ALGO) price still holds above a crucial support area at $0.29. Whether it breaks down or bounces can have massive implications for the future price.
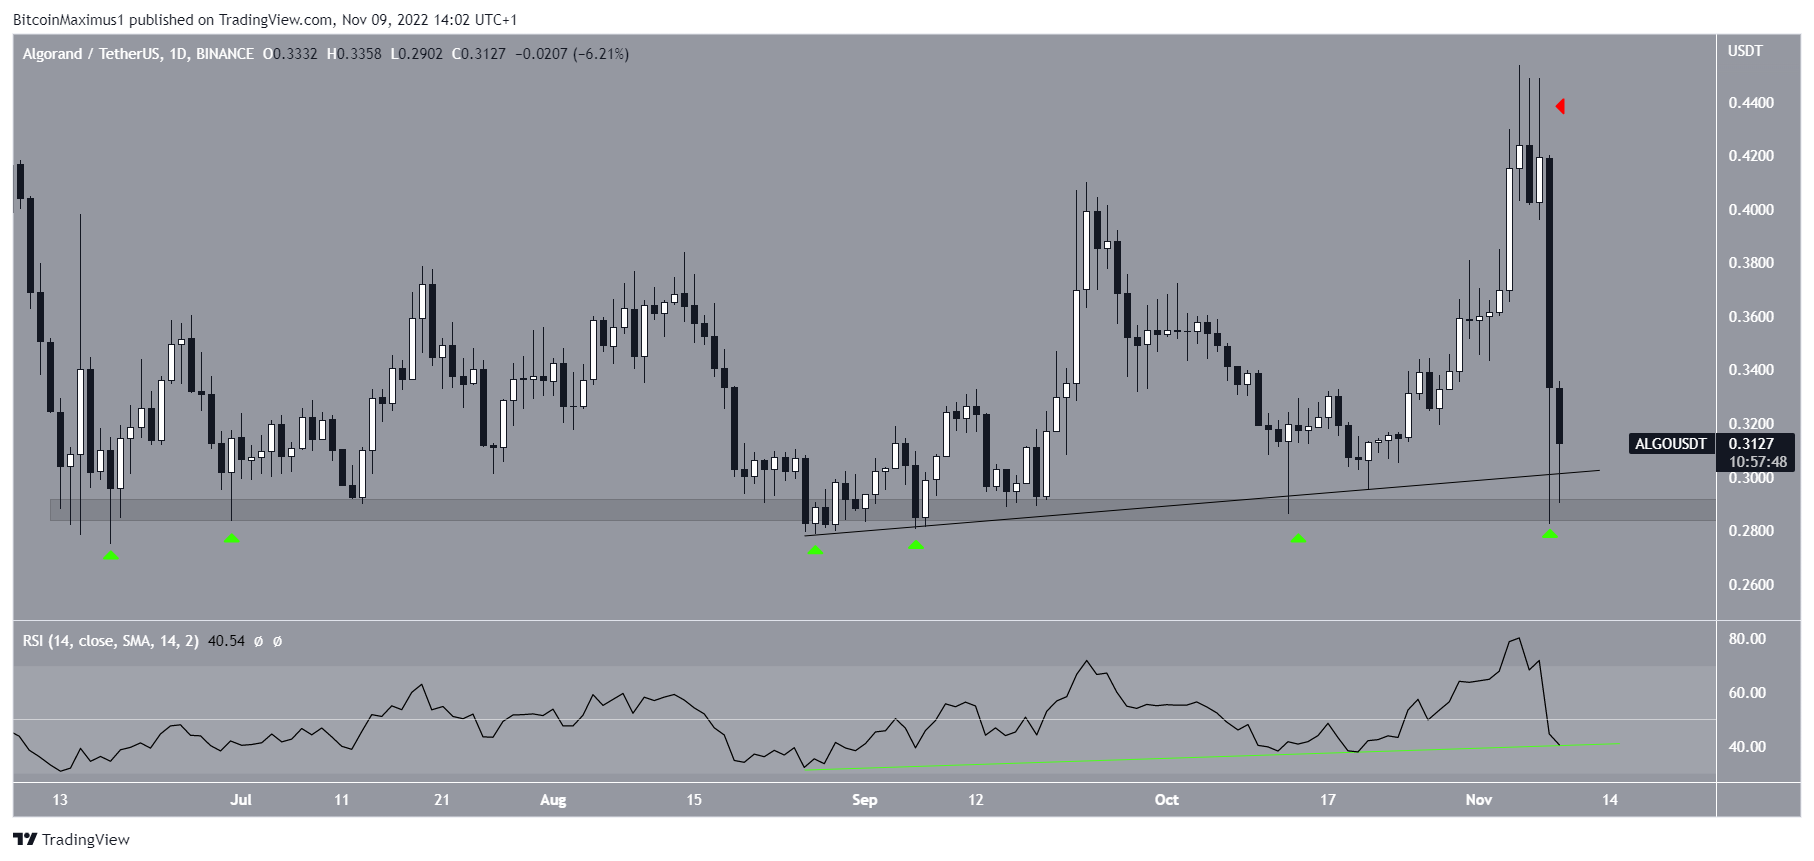
ALGO has fallen since reaching a high of $0.45 on Nov. 5. It created a few long upper wicks in the following days before accelerating its rate of decrease. On Nov. 9, ALGO fell to a low of $0.28 before bouncing.
The bounce validated the $0.29 horizontal support area. This is a crucial area that has been in place since June 15. It has been validated six times so far (green icons).
The Algorand price also follows an ascending support line, and the daily RSI does the same (green line).
Therefore, whether it breaks down from this line will determine if the ALGO price prediction is bullish or bearish. A breakdown would lead to a much lower future price. Conversely, failure to do so would likely lead to bullish price movements and new maximum prices.
Algorand Price Prediction: Weekly Level is Crucial for Future Trend
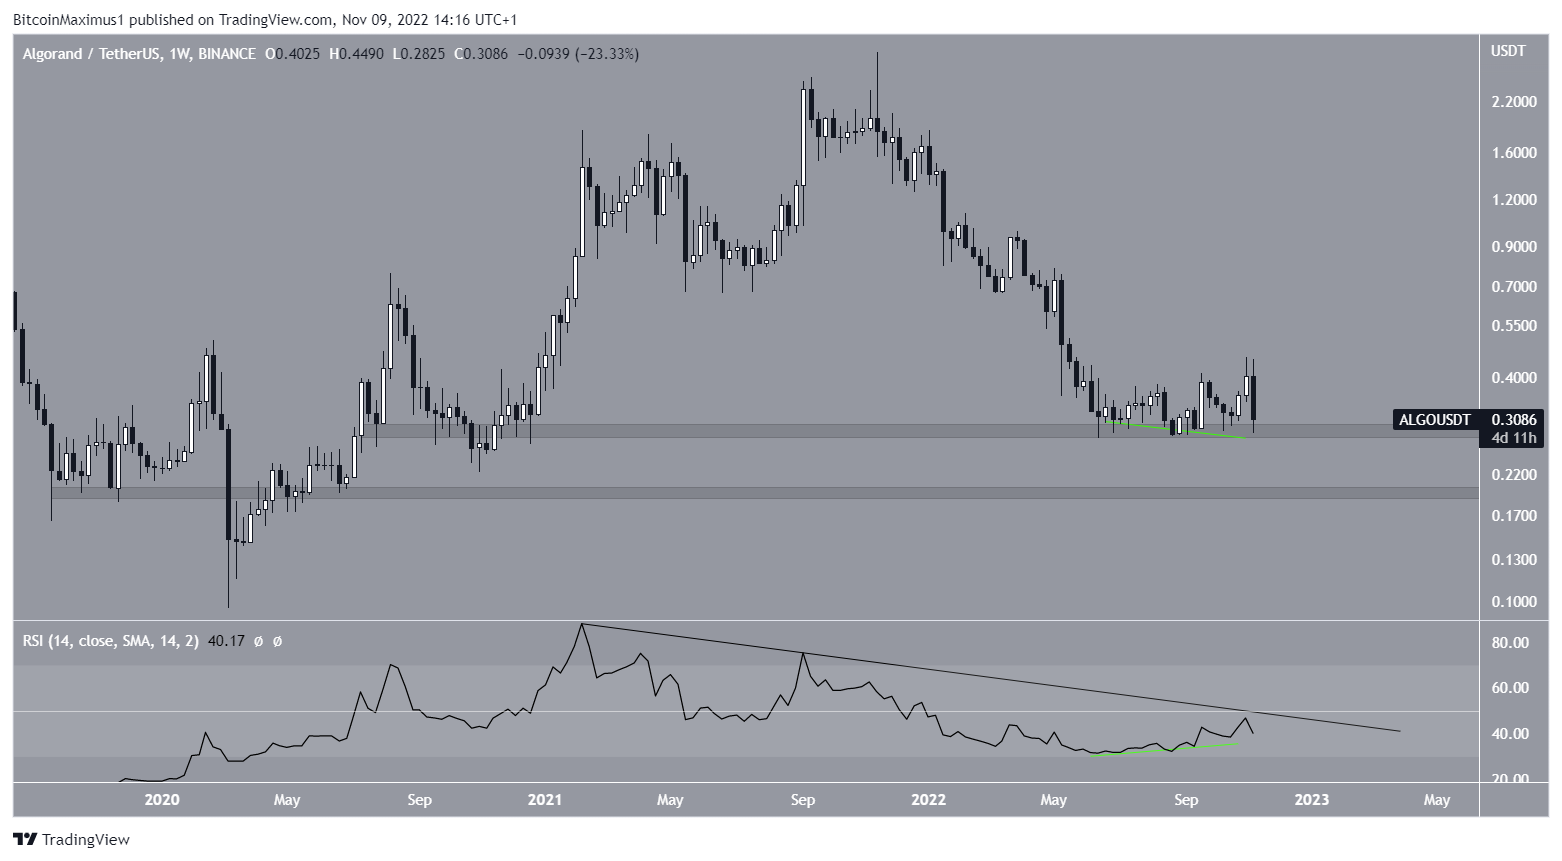
The technical analysis from the weekly time frame reiterates the importance of the $0.29 area. The area has acted as support since July 2020. As a result, a breakdown from it could be the catalyst for the acceleration of the downward movement.
If one occurs, the next support area would be at $0.195.
Similar to the daily time frame, the weekly RSI has also generated bullish divergence. But, it is still trading below its bearish divergence trend line (black line). A breakout from the latter and movement above 50 is required to confirm the bullish long-term trend.
Therefore, whether the ALGO price breaks down or bounces at the $0.29 area will likely determine the future trend.
For BeInCrypto’s latest Bitcoin (BTC) analysis, click here.
Disclaimer: BeInCrypto strives to provide accurate and up-to-date information, but it will not be responsible for any missing facts or inaccurate information. You comply and understand that you should use any of this information at your own risk. Cryptocurrencies are highly volatile financial assets, so research and make your own financial decisions.