
Algorand (ALGO) has finally managed to break out above the $0.427 resistance area, something it had been struggling to do since the beginning of September.
Despite the breakout, it’s still possible that the movement is corrective and could cause Algorand to decrease in the near future.
Algorand Breaks Out Above Resistance
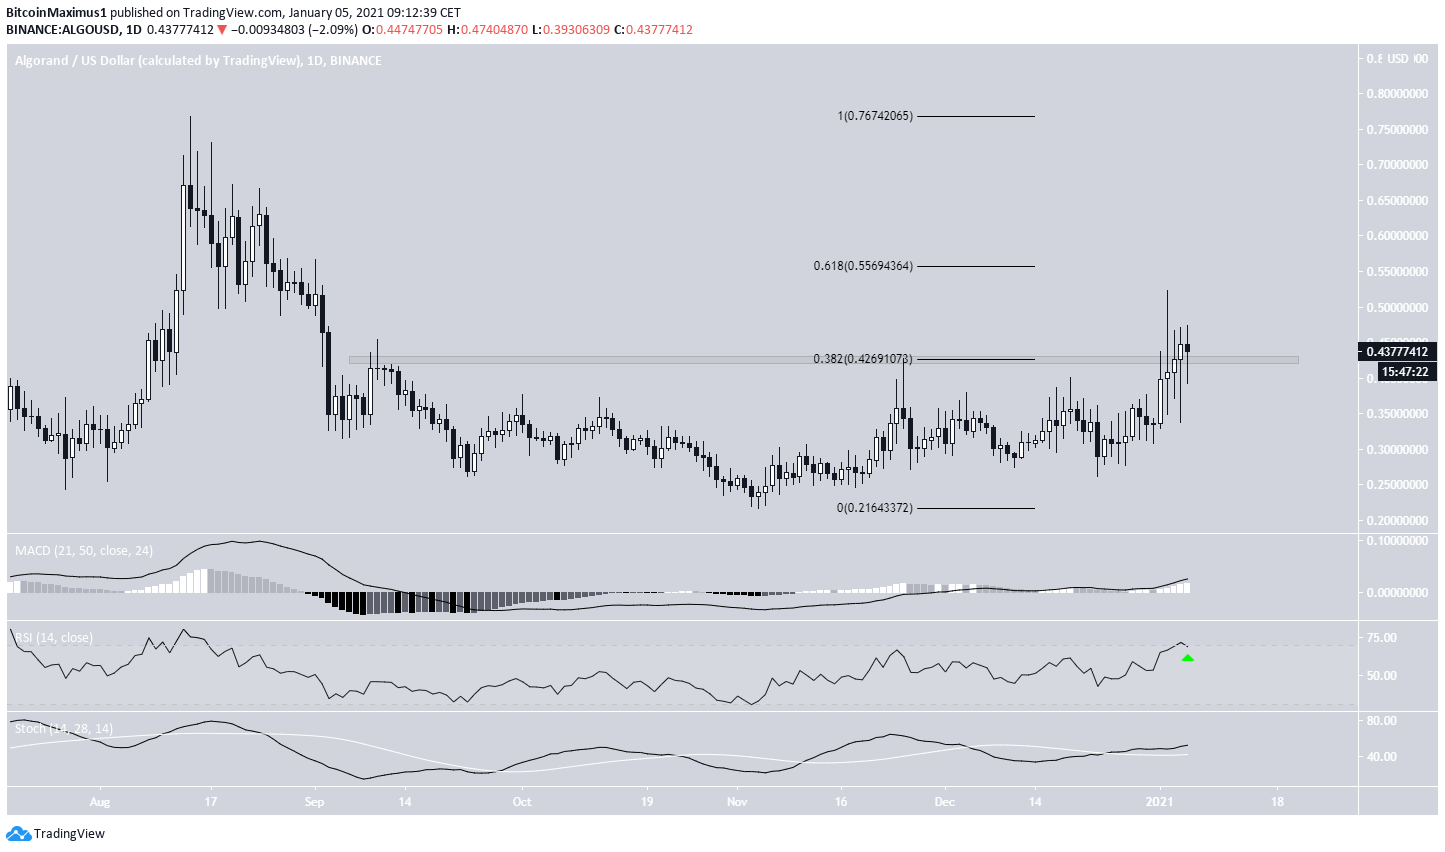
Since the beginning of September, ALGO has been trading below the $0.427 resistance area. This level is the 0.382 Fib retracement of the most recent downward move.
After numerous unsuccessful breakout attempts, ALGO finally managed to move above this level on Jan. 2 and proceeded to validate it as support the next day.
If ALGO continues increasing, the next resistance level would be found at $0.55, (0.618 Fib retracement level) and $0.77, the top of the same movement.
Technical indicators are bullish, supporting the possibility that ALGO will resume its upward movement.
Short-Term Movement
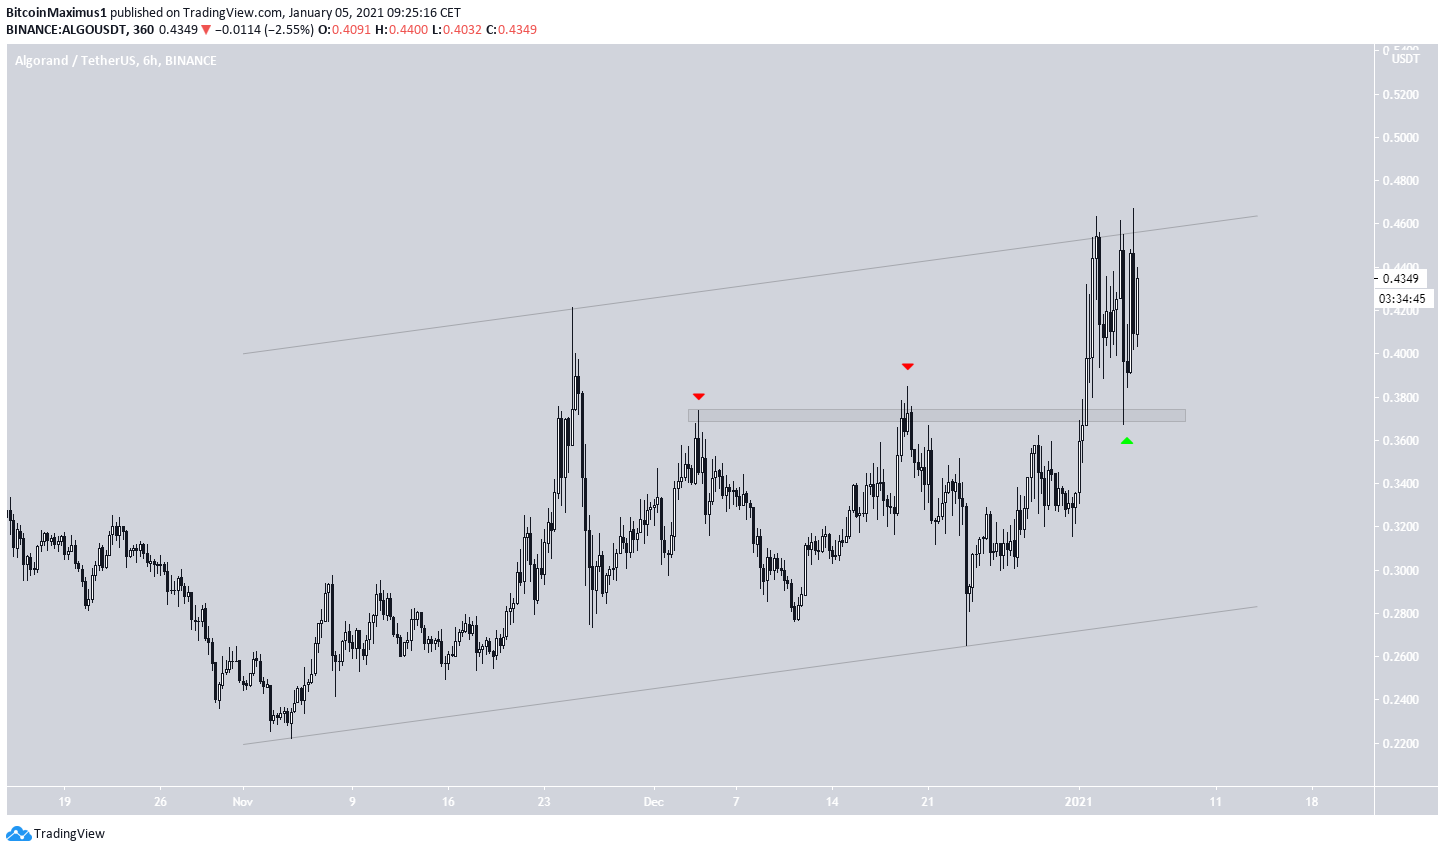
The six-hour chart shows that ALGO has also broken out from the $0.37 area and has validated it as support after.
In addition, ALGO is trading inside a parallel ascending channel and is currently just below its resistance line.
Since channels are usually corrective movements, a breakout from this pattern would be required in order for the trend to be considered bullish.
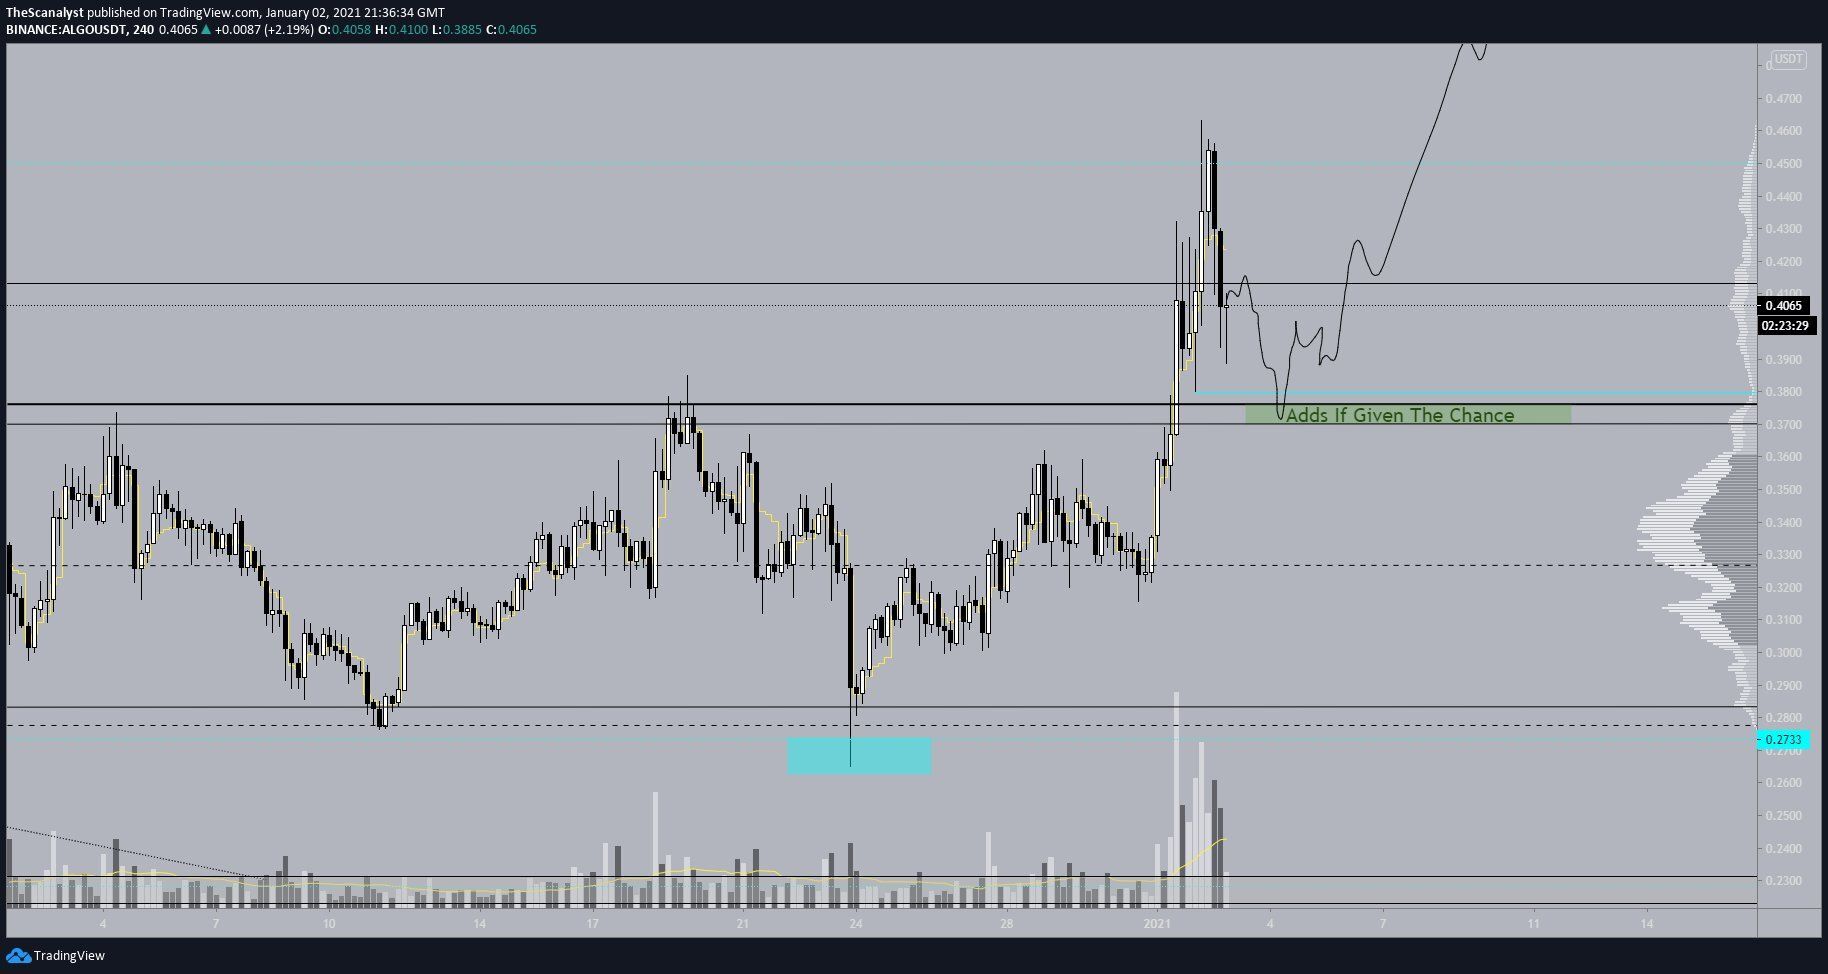
Cryptocurrency trader @TScanalyst outlined an ALGO chart, stating that he is predicting that ALGO could potentially go all the way to $0.90.
As outlined above, ALGO has touched the $0.37 level and began the current upward movement. However, a breakout from the channel would be required in order for the ALGO trend to be considered bullish.
ALGO Wave Count
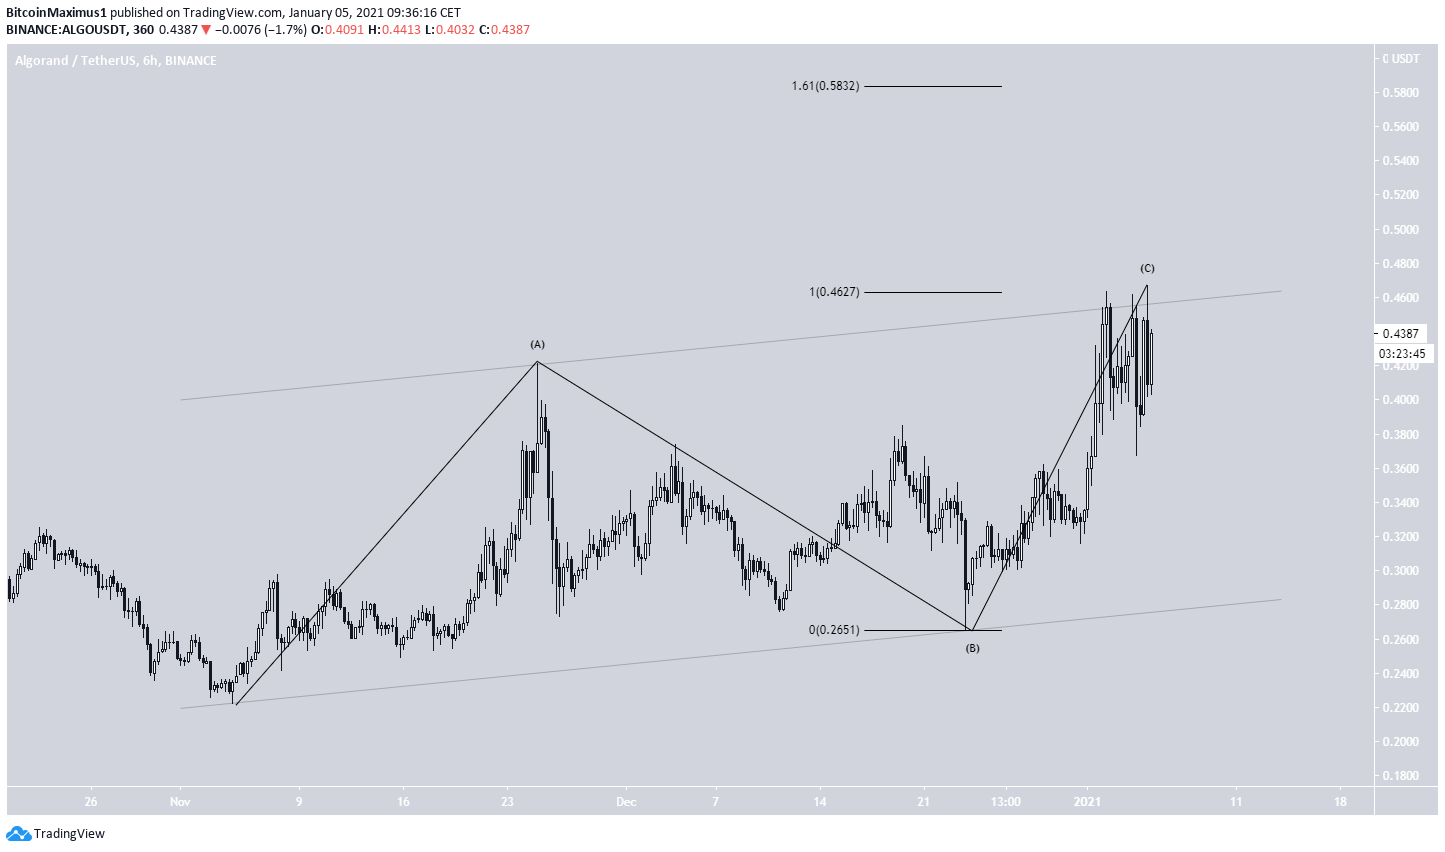
The wave count suggests that ALGO has completed an A-B-C corrective structure and will now begin to decrease. The possibility that this is an A-B-C structure is strengthened by the presence of the channel and the fact that the A:C waves have a 1:1 ratio.
The next most likely ratio is 1:1.61, and that would take the top of the C wave to $0.58. This fits with the 0.618 Fib retracement level before another decrease.
In any case, the movement does not look impulsive unless we see a significant breakout.
Conclusion
The direction of the trend for Algorand is currently unclear.
While technical indicators and the most recent support/resistance flip support the possibility that ALGO will increase towards $0.55, the presence of the parallel channel and the wave count do not.
Therefore, until ALGO manages to break out from the channel, we cannot consider the trend bullish.
For BeInCrypto’s latest Bitcoin (BTC) analysis, click here!
Disclaimer: Cryptocurrency trading carries a high level of risk and may not be suitable for all investors. The views expressed in this article do not reflect those of BeInCrypto.
