BeInCrypto takes a look at the seven altcoins that decreased the most during last week, more specifically from Nov 12-19.
These altcoins are:
- OMG Network (OMG) : -20.32%
- Algorand (ALGO) : -18.90%
- Zcash (ZEC) : -17.03%
- Fantom (FTM) : -14.04%
- SushiSwap (SUSHI) : -13.95%
- NEAR Protocol (NEAR) :-13.91%
- Kusama (KSM) : -13.87%
OMG
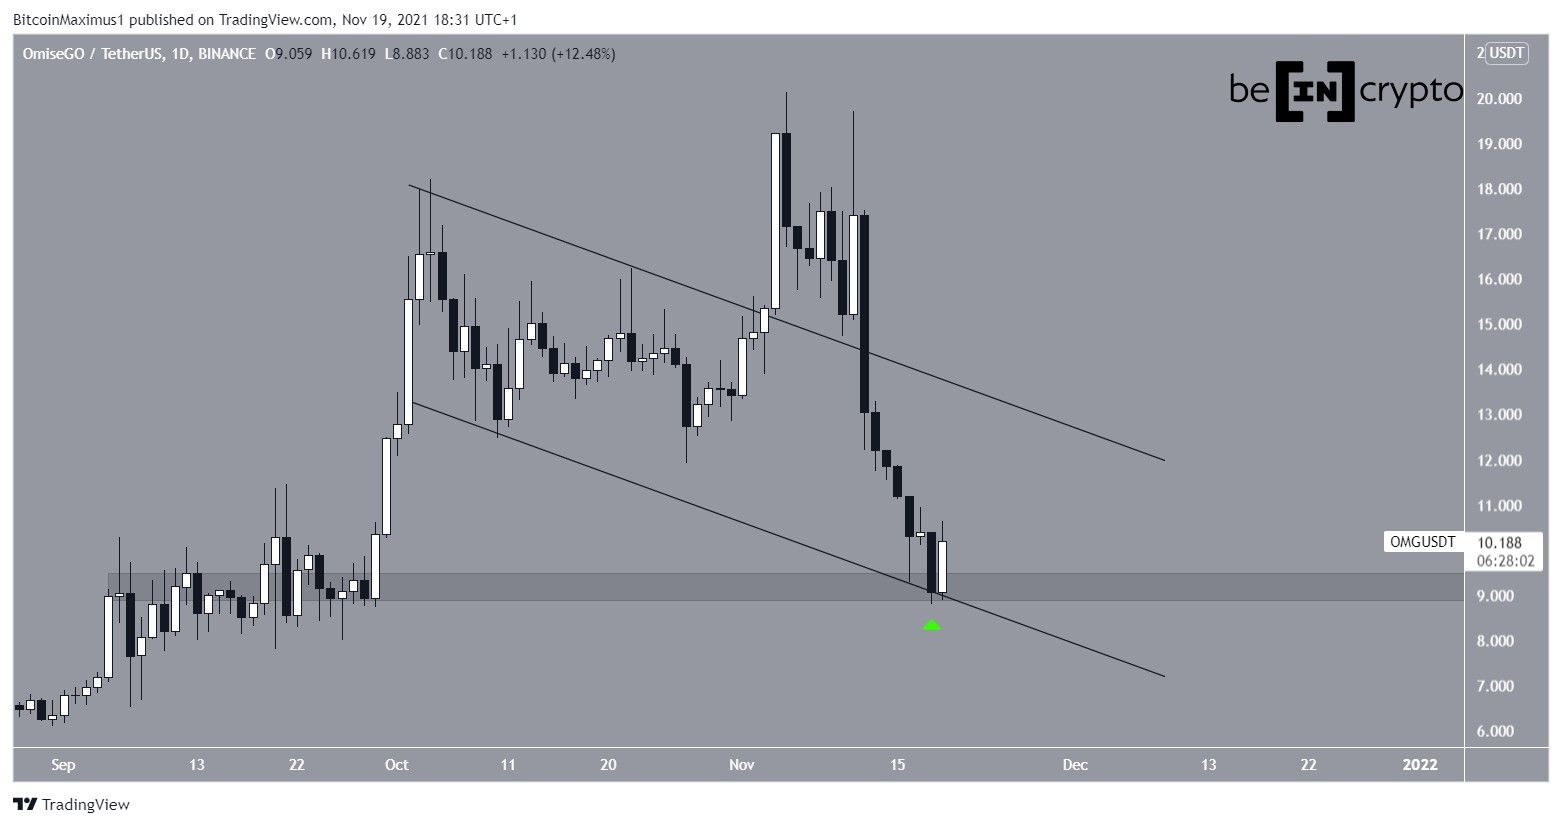
OMG has been falling since Nov 5, when it reached a high of $20.12. On Nov 11, it created a lower high and resumed its descent. This led to a low of $8.78 on Nov 18.
Currently, OMG is trading inside the $9.20 horizontal support area. The area also coincides with the support line of a descending parallel channel, which had previously been in place since Oct 4.
While there are currently no bullish reversal signs in place, OMG is at a level that is likely to initiate a bounce.
ALGO
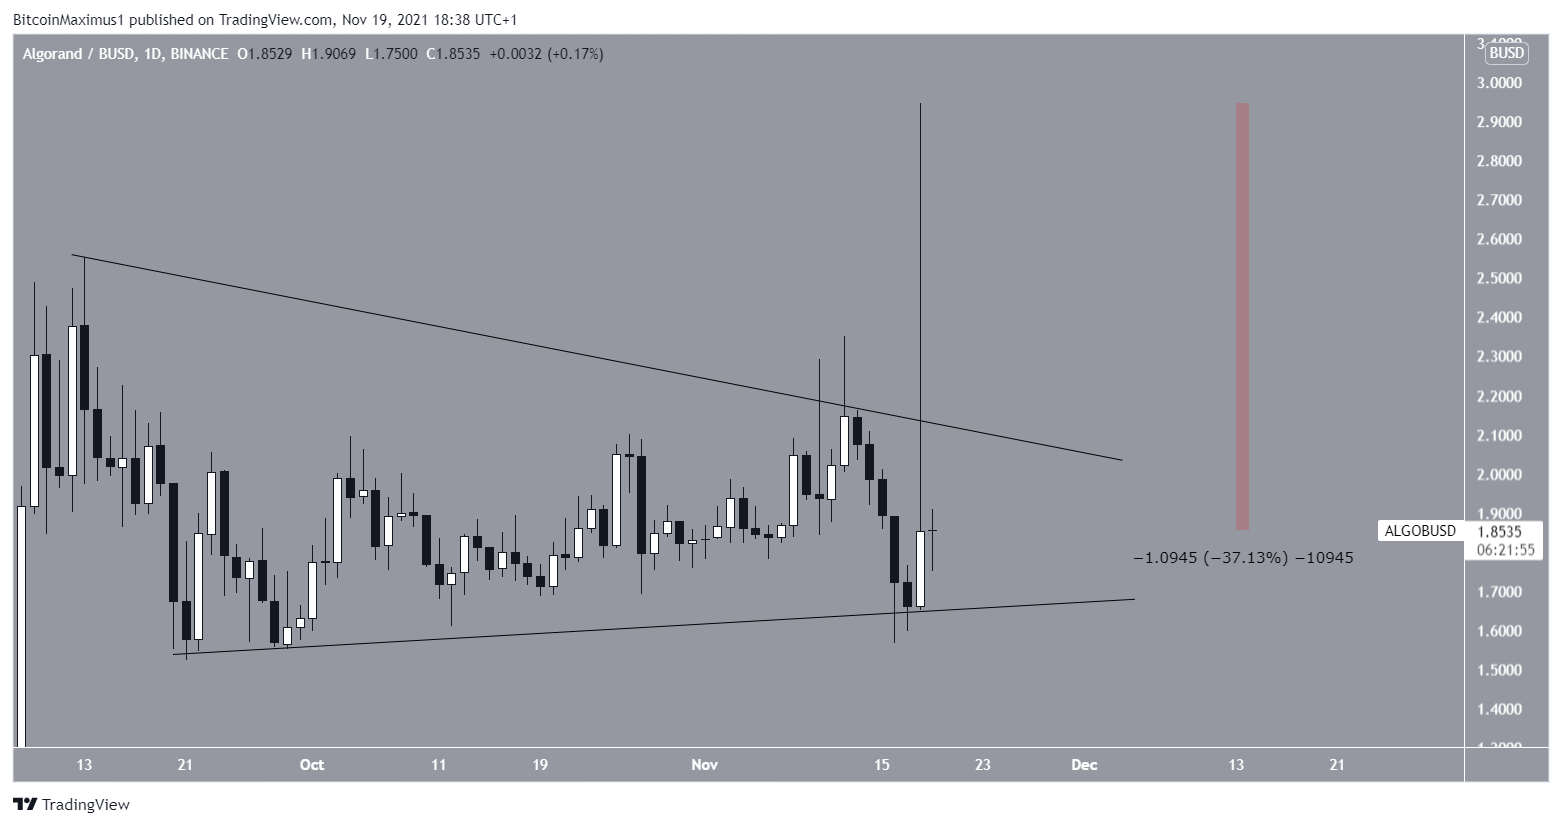
ALGO has been decreasing inside a symmetrical triangle since Sept 12. On Nov 18, it purportedly broke out from the triangle, reaching a new all-time high price of $2.94 in the process. However, this created a long upper wick with a magnitude of 37%, taking ALGO back inside the triangle.
It is possible that the increase came as a result of the Upbit exchange listing.
A decisive movement outside of the triangle is required in order to determine the direction of the trend.
ZEC
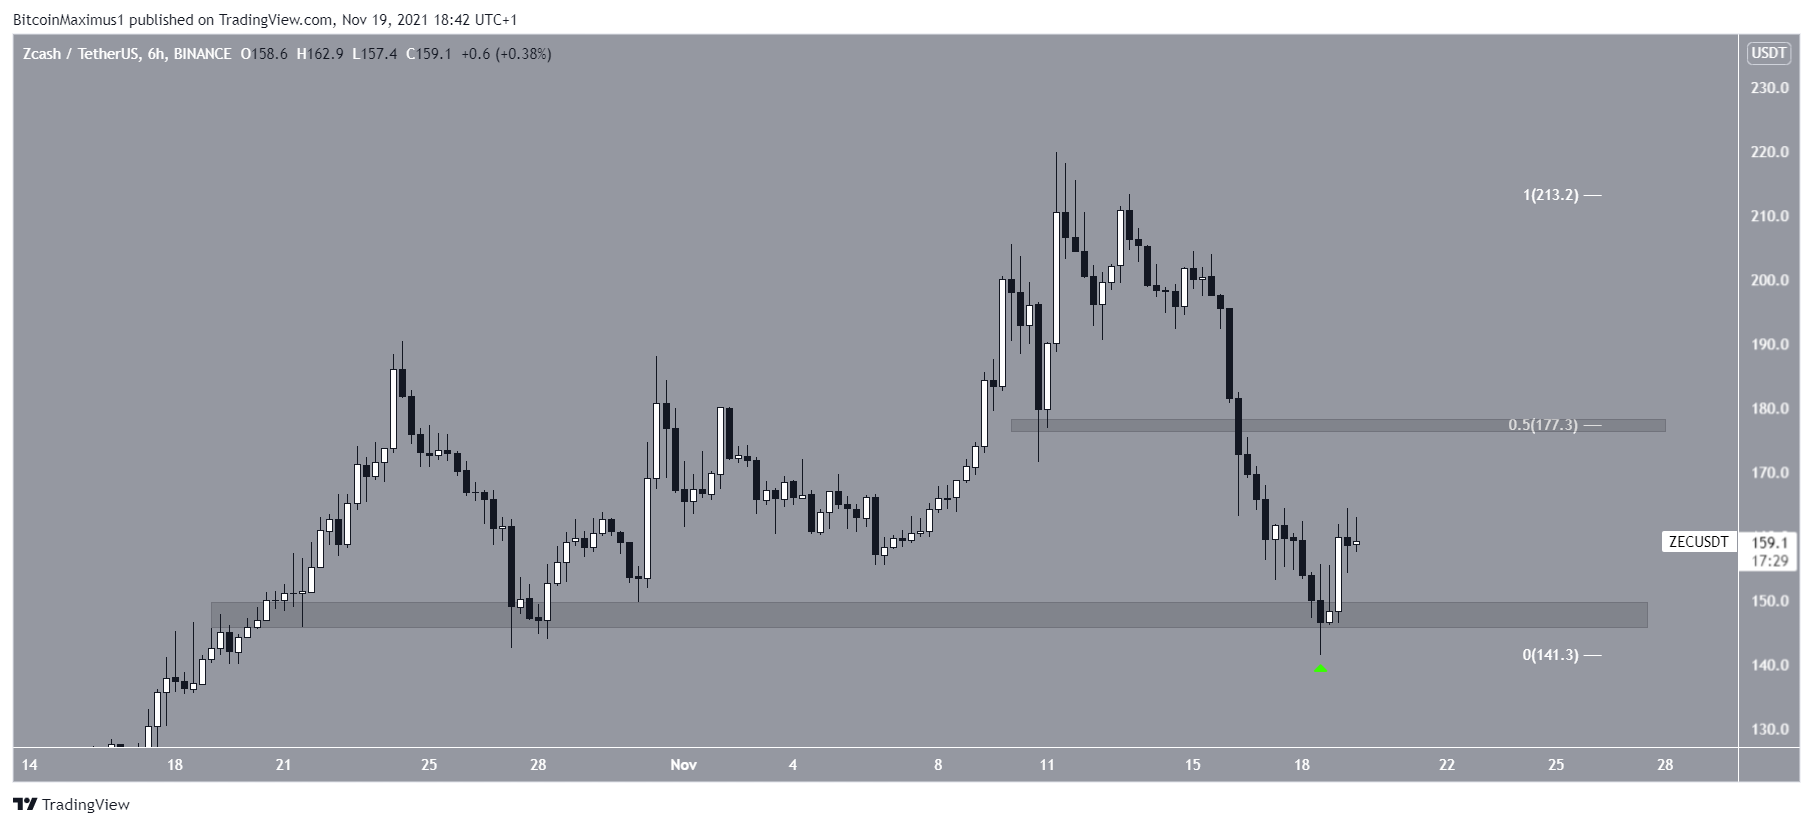
ZEC has been decreasing since Nov 11, when it reached a high of $220. This led to a low of $141 on Nov 18 (green icon). The token began a bounce afterwards.
If the bounce continues, the closest resistance level would be at $177. This is the 0.5 Fib retracement resistance level when measuring the entire drop.
FTM
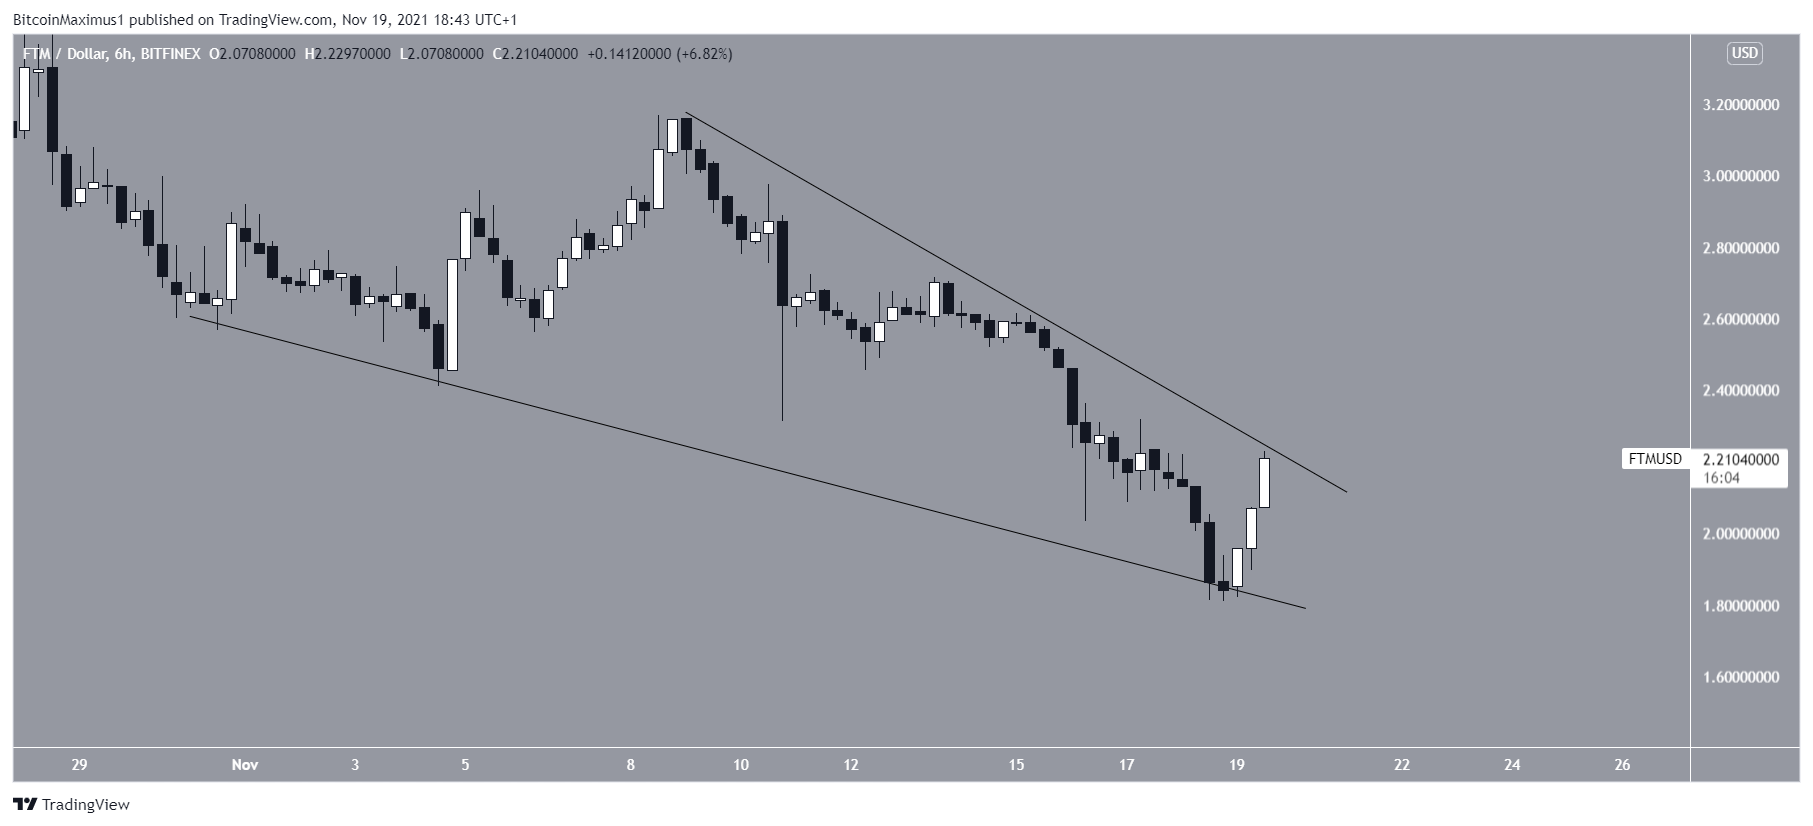
FTM has been decreasing inside a descending wedge since Nov 9. The wedge is considered a bullish pattern, meaning that a breakout from it would be expected.
If a breakout transpires, the closest resistance area would be at $2.45. This is both a horizontal resistance area and the 0.382 Fib retracement resistance level.
A movement above it could trigger an acceleration of the upward movement.
SUSHI
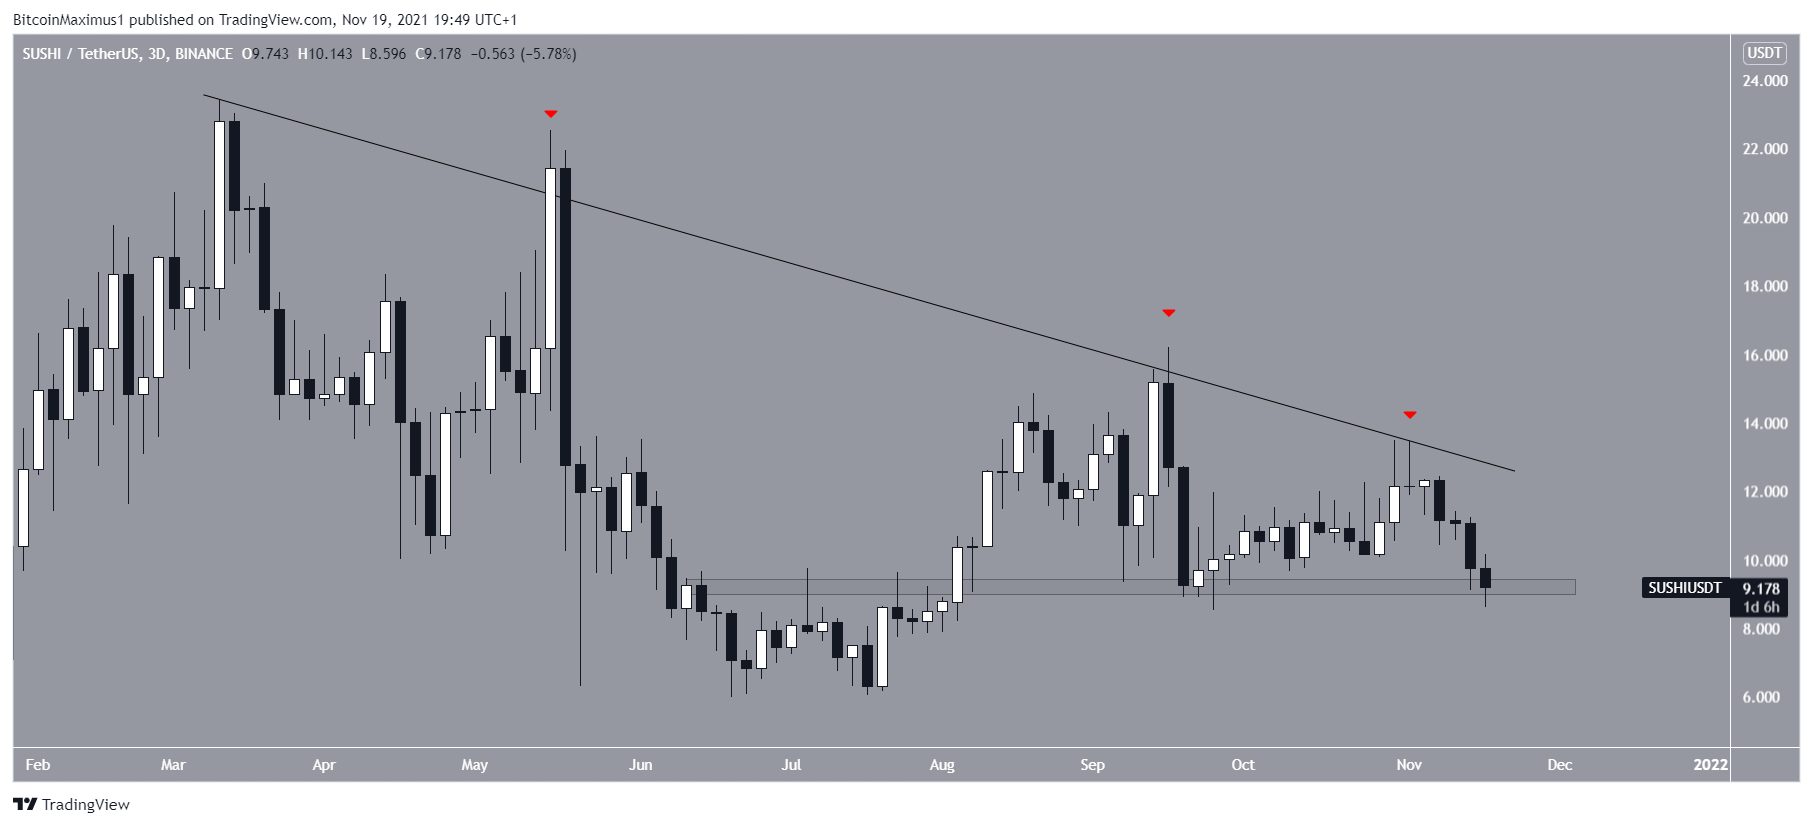
SUSHI has been decreasing alongside a descending resistance line since March 12. SO far, it has been rejected by the line four times, most recently on Nov 4.
After the decrease, SUSHI returned to the $9 horizontal support area.
Similarly to OMG, despite the lack of bullish reversal signs, this area is likely to initiate a bounce.
NEAR
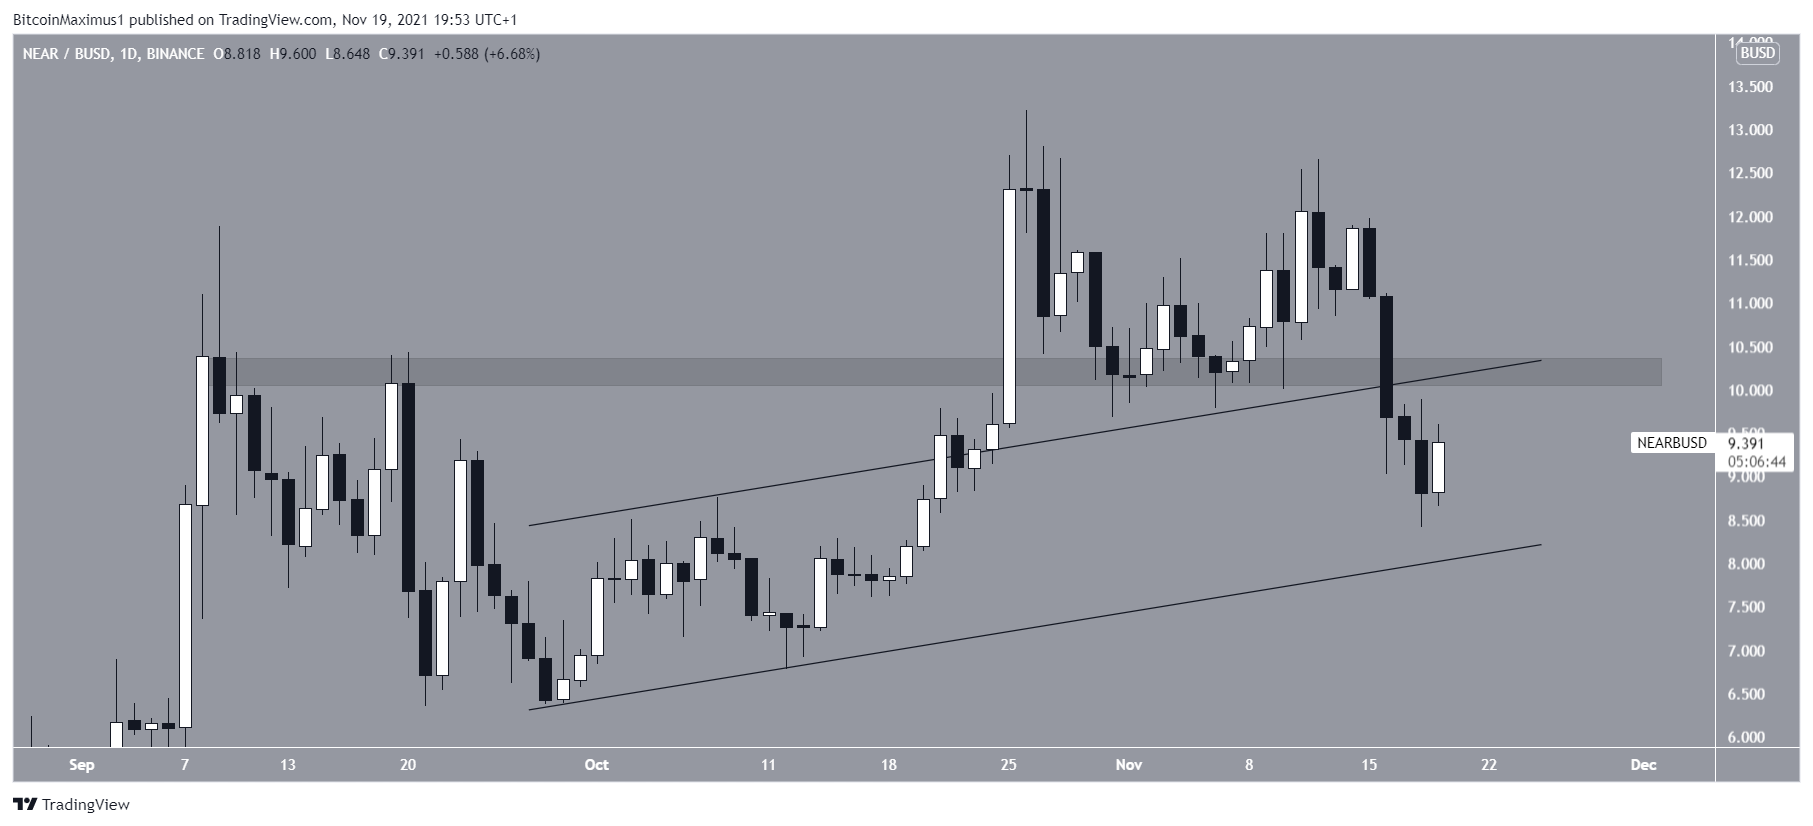
NEAR has been decreasing since Oct 26, when it reached an all-time high price of $13.22. However, the $10.20 area, which was expected to act as support, failed to do so. NEAR broke down below this area on Nov 16.
It is currently attempting to find support above $8. This is the support line of an ascending channel from which it previously broke out.
KSM
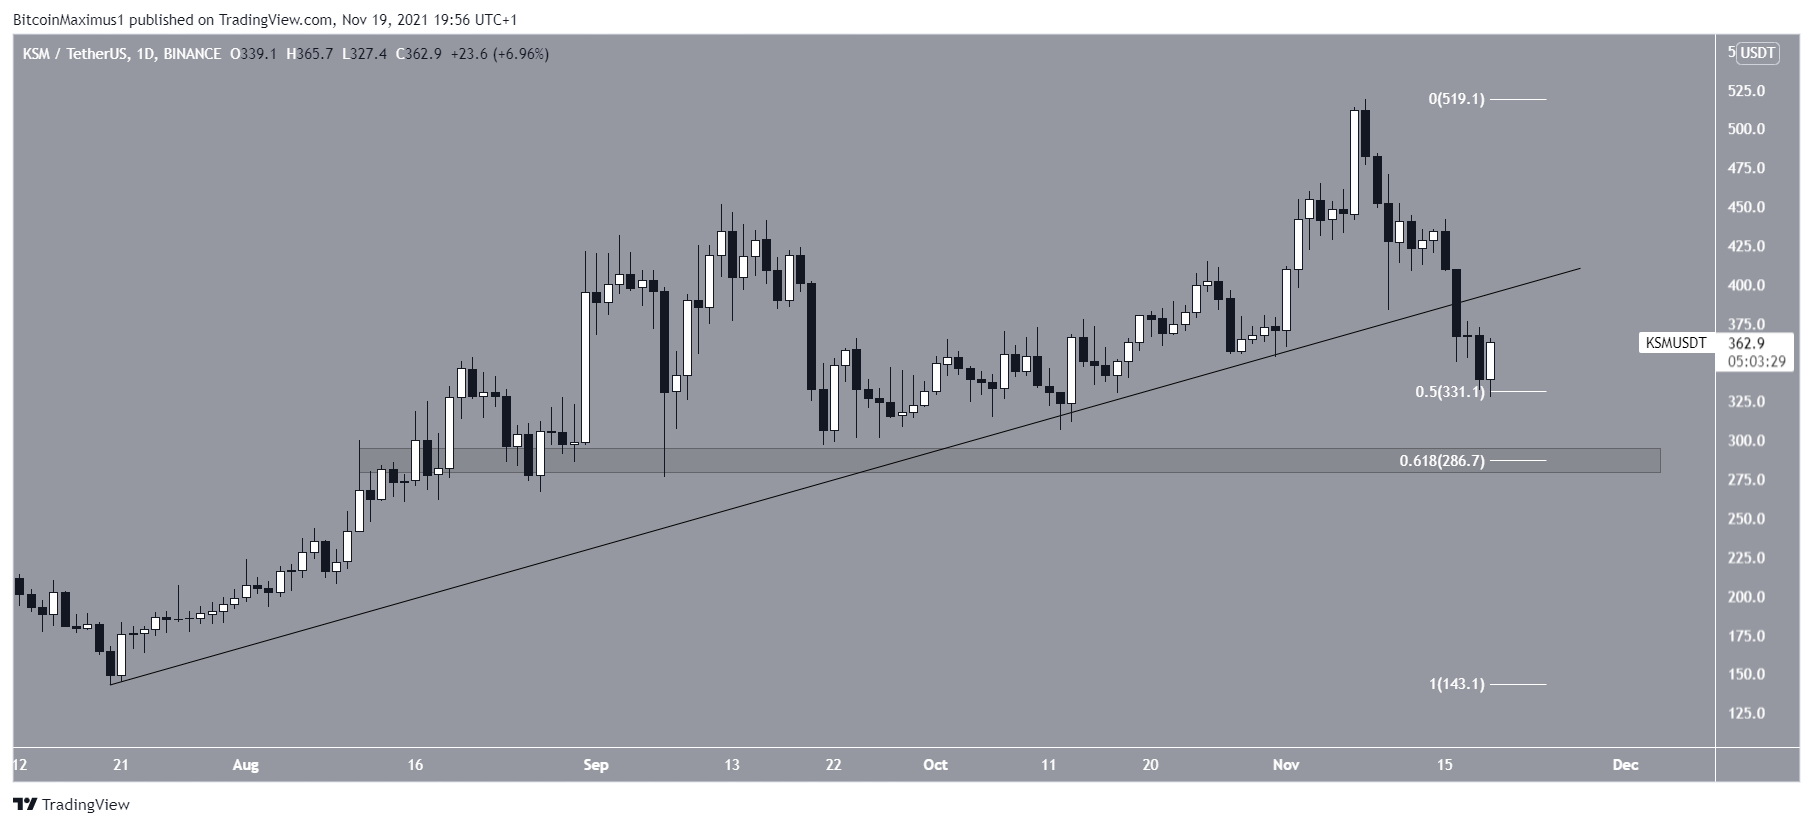
KSM had been increasing alongside an ascending support line since July 20. This led to a new high of $519.1 on Nov 8.
However, KSM has been decreasing since, and broke down from the resistance line on Nov 16.
It is currently attempting to find support above the 0.5 Fib retracement support level at $330. The next support area is at $287, the 0.618 Fib retracement support level.
For BeInCrypto’s latest Bitcoin (BTC) analysis, click here.
For BeInCrypto’s latest Bitcoin (BTC) analysis, click here.