The Algorand (ALGO) price has been decreasing since Feb. 14 but has bounced at a crucial long-term support level.
Despite the failure to confirm the bullish trend, ALGO will likely move upwards towards the closest resistance area.
ALGO’s Long-Term Levels
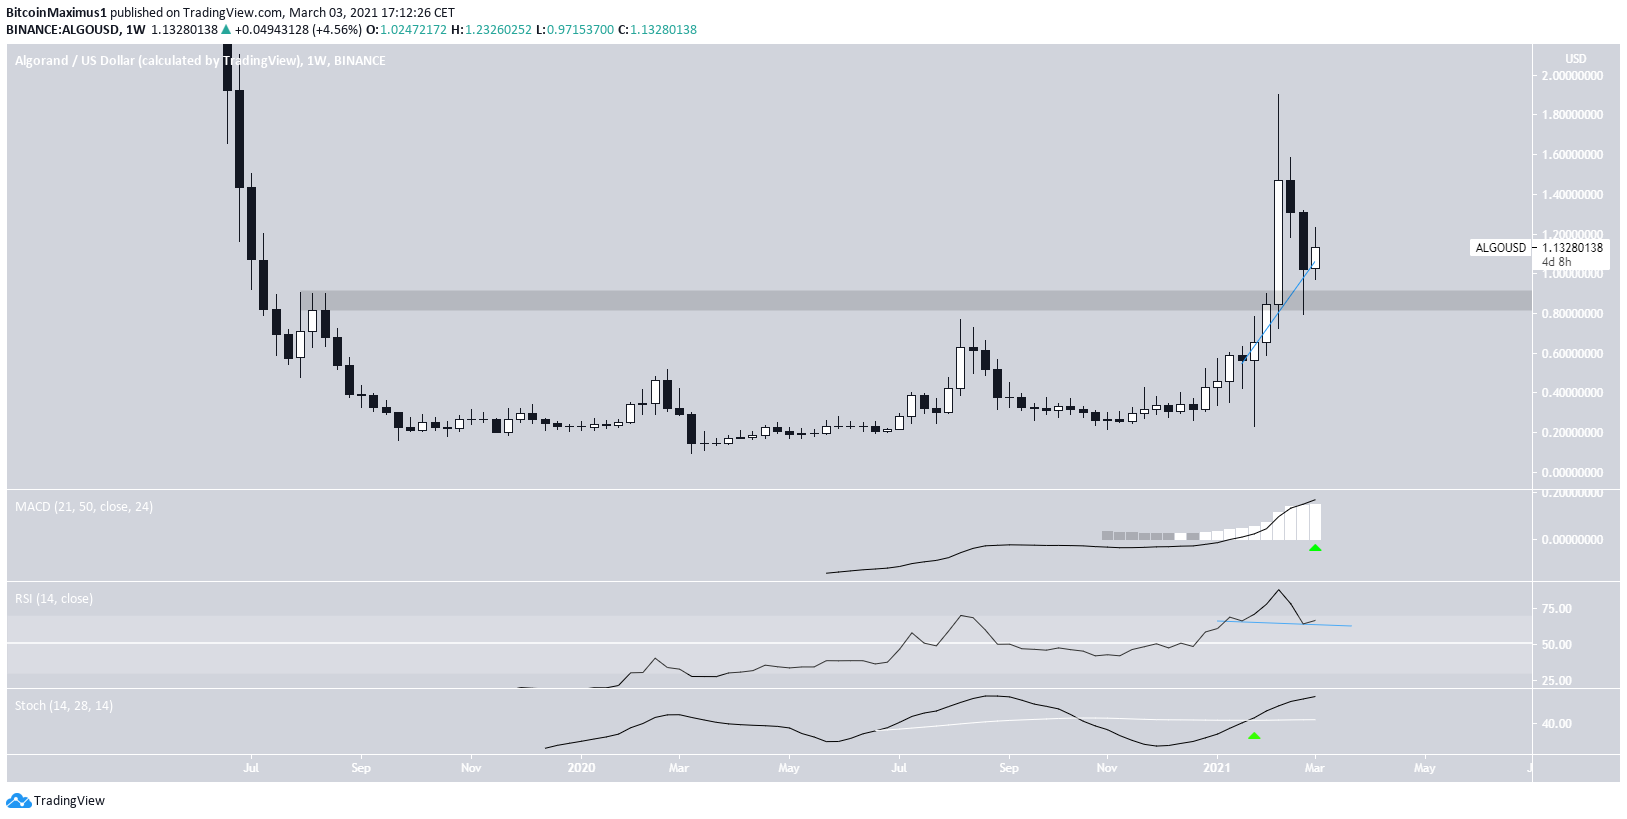
ALGO has been decreasing since Feb. 12, when it reached a high of $1.84. The drop took it to a low of $0.83 on Feb. 23, but it created a long lower wick and managed to reach a close above the $0.87 area.
This long lower wick was necessary since the area had previously acted as resistance, and the current decrease now looks like a re-test of that same level.
Technical indicators are bullish since the MACD & Stochastic oscillator are increasing, the latter having made a bullish cross, and the RSI has generated hidden bullish divergence.
Therefore, the token is expected to eventually attempt to move above the $1.84 high of Feb. 12.
ALGO’s Ongoing Bounce
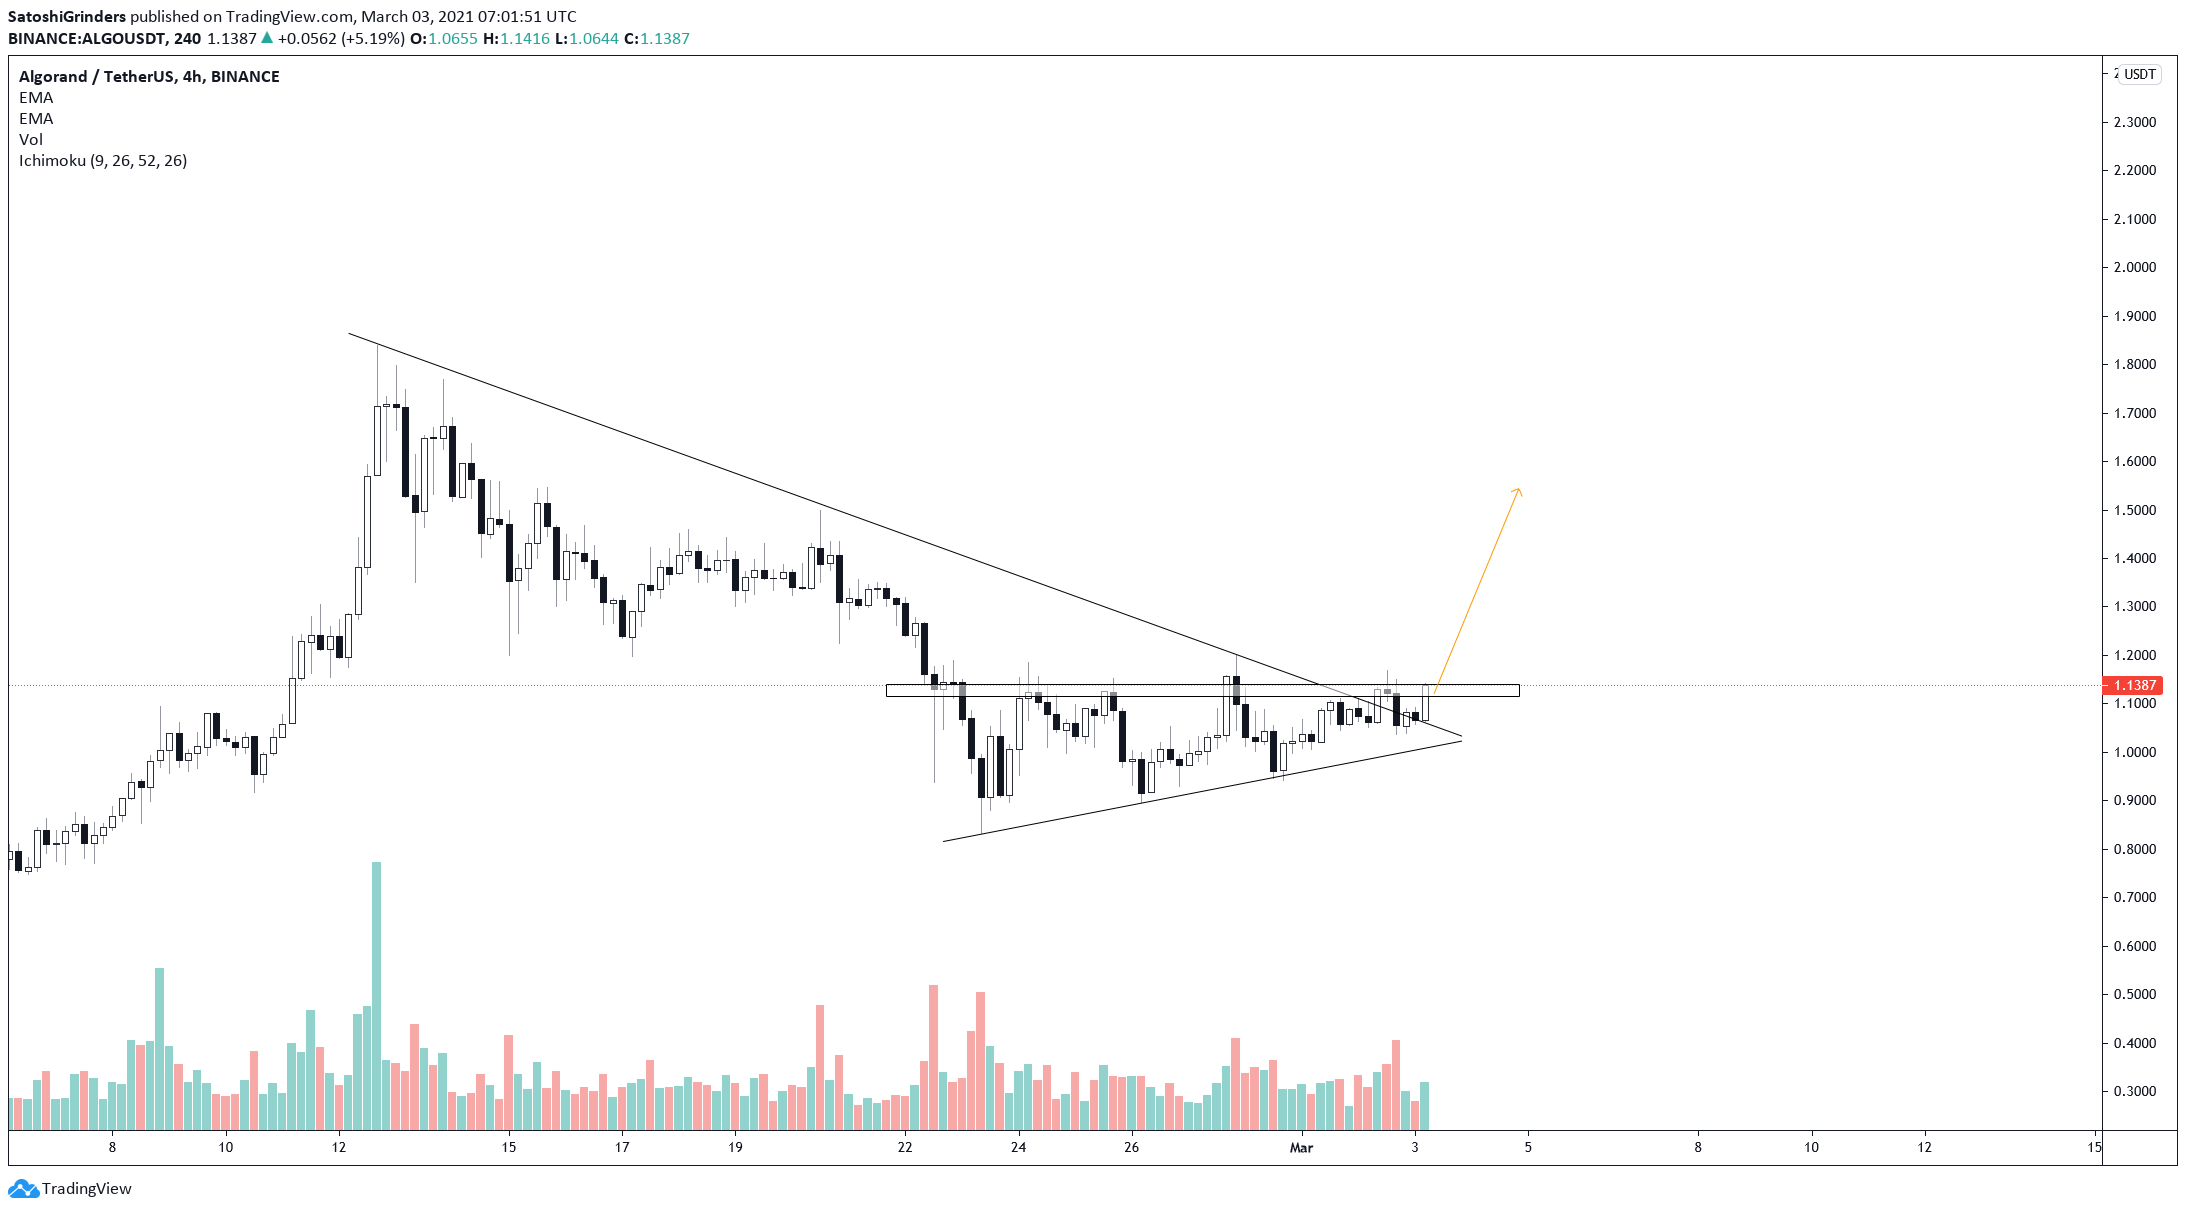
Cryptocurrency trader @Thebull_crypto outlined the token’s chart that shows a potential breakout from a descending resistance line.
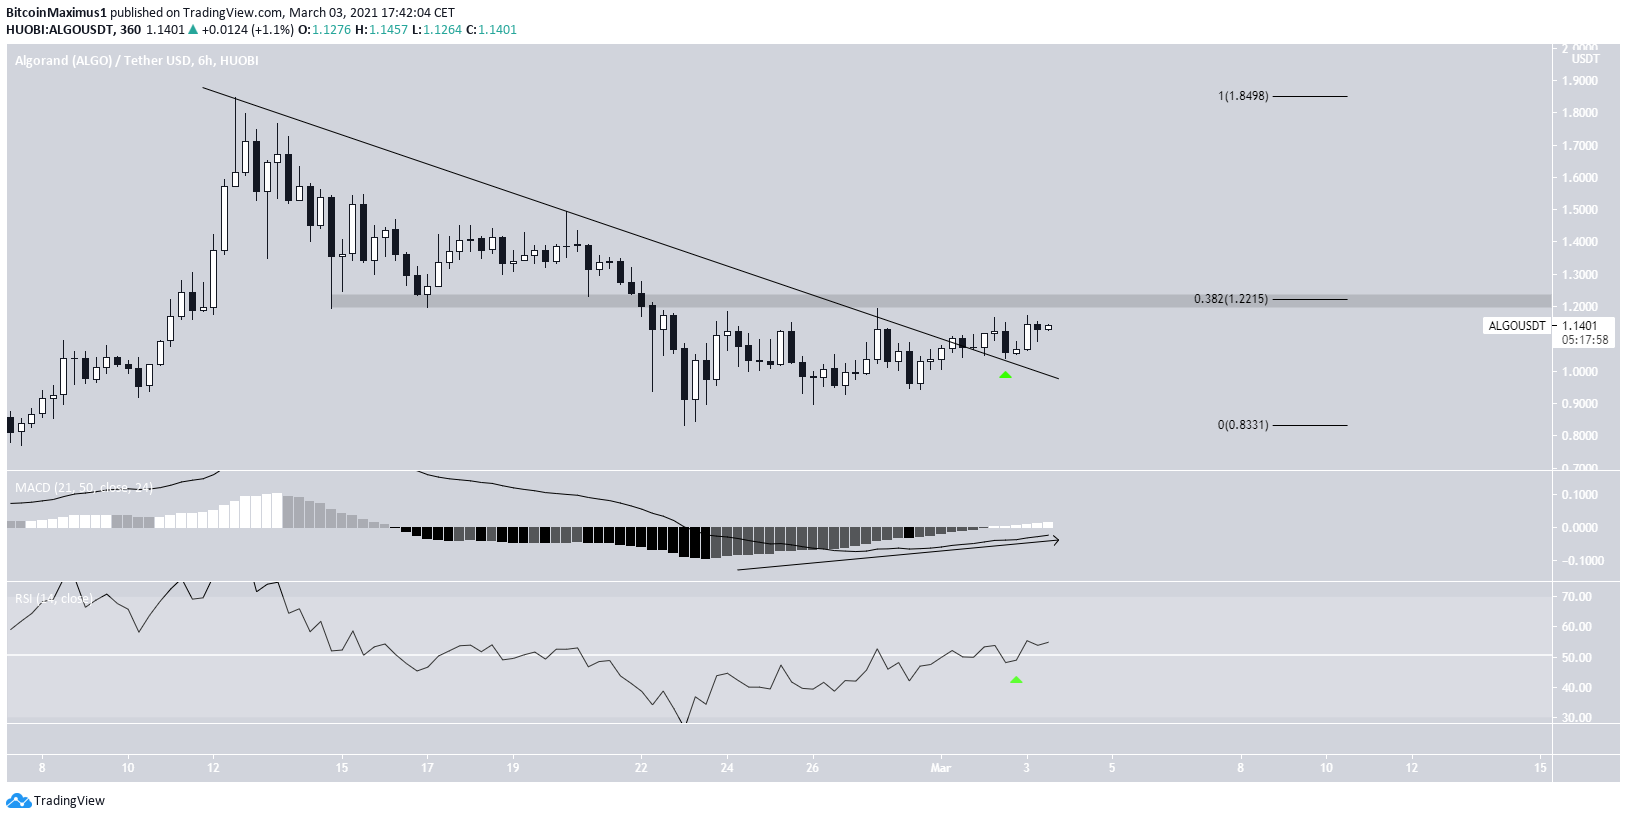
Since the tweet, it has broken out from the descending resistance line but has yet to claim the previous breakdown level at $1.22, which is also the 0.382 Fib retracement of the most recent decrease.
Both the MACD & RSI indicate that the token is likely to reclaim this level.
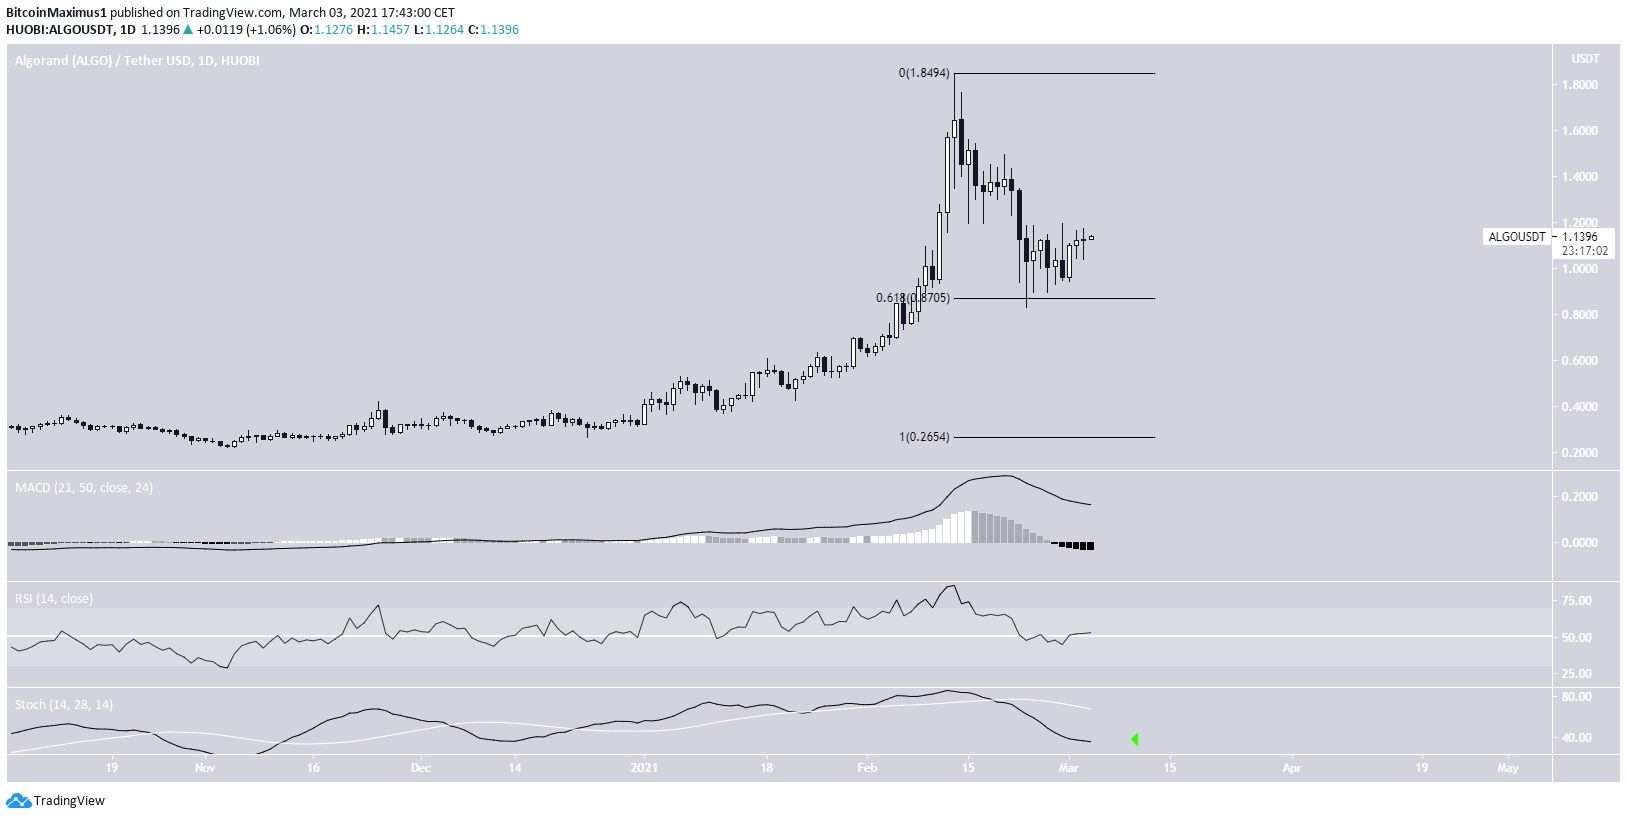
However, the daily chart fails to confirm the bullish trend reversal.
While the token has bounced at the 0.618 Fib retracement level, creating a long lower wick in the process.
However, technical indicators are relatively neutral, even though the MACD & Stochastic oscillator (green arrow) shows signs of a reversal.
Nevertheless, until the Stochastic oscillator makes a bullish cross and the MACD histogram turns positive, we cannot confirm the bullish trend reversal.
Wave Count
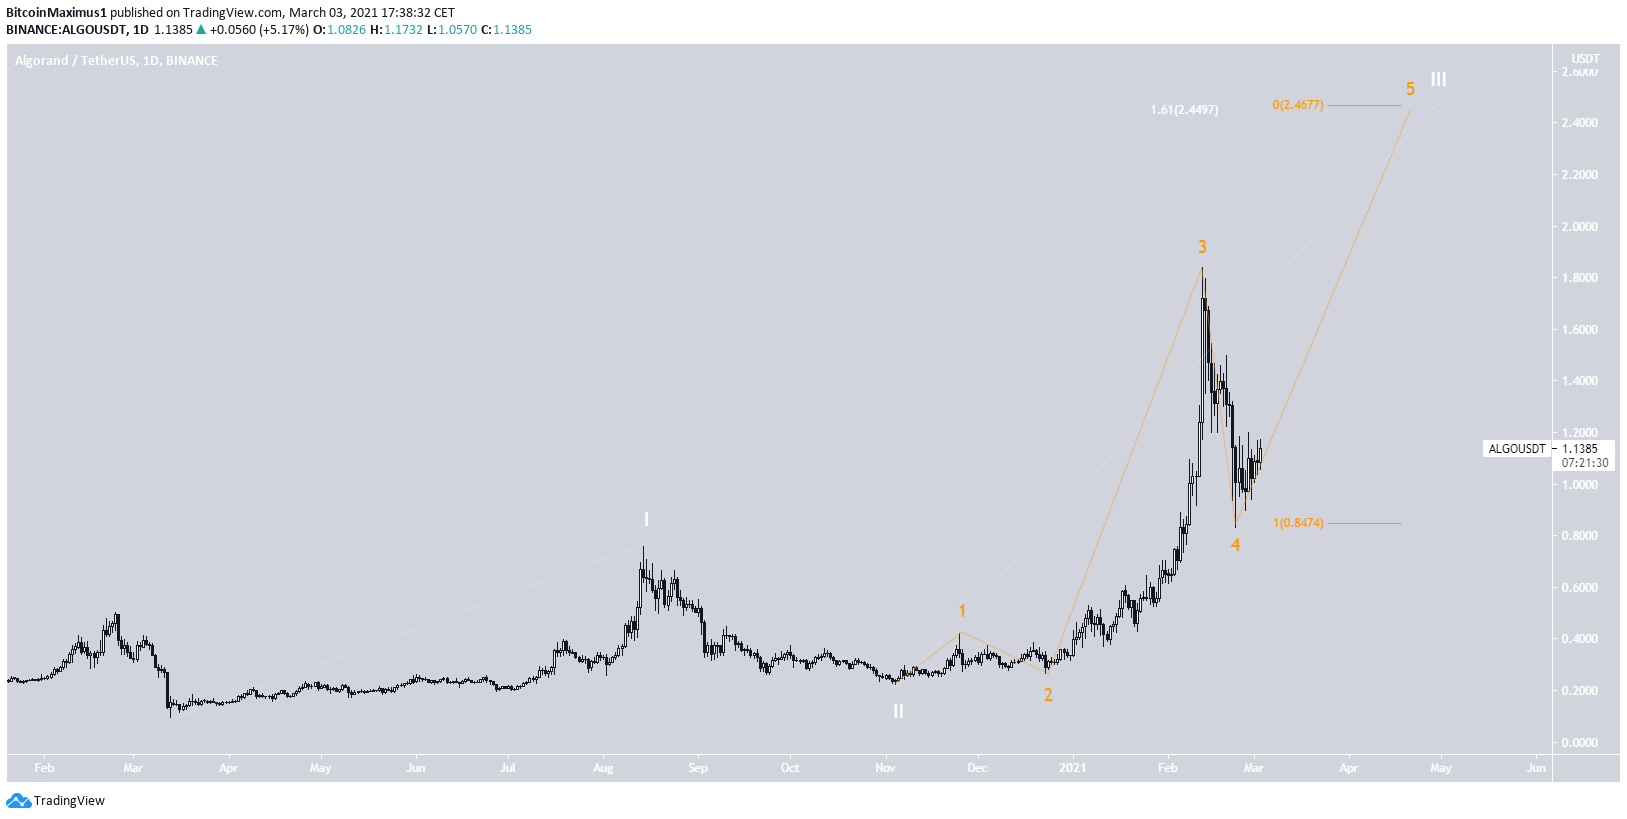
The wave count suggests that ALGO is in sub-wave five (orange) of a long-term wave three (white).
If the count is correct, the most likely target for the top of the movement would be between $2.44-$2.46, found by using an external Fib retracement on sub-wave four and projecting the length of waves 1-3.
However, as stated in the previous section, the bullish trend reversal is not yet confirmed.
ALGO-BTC Pair
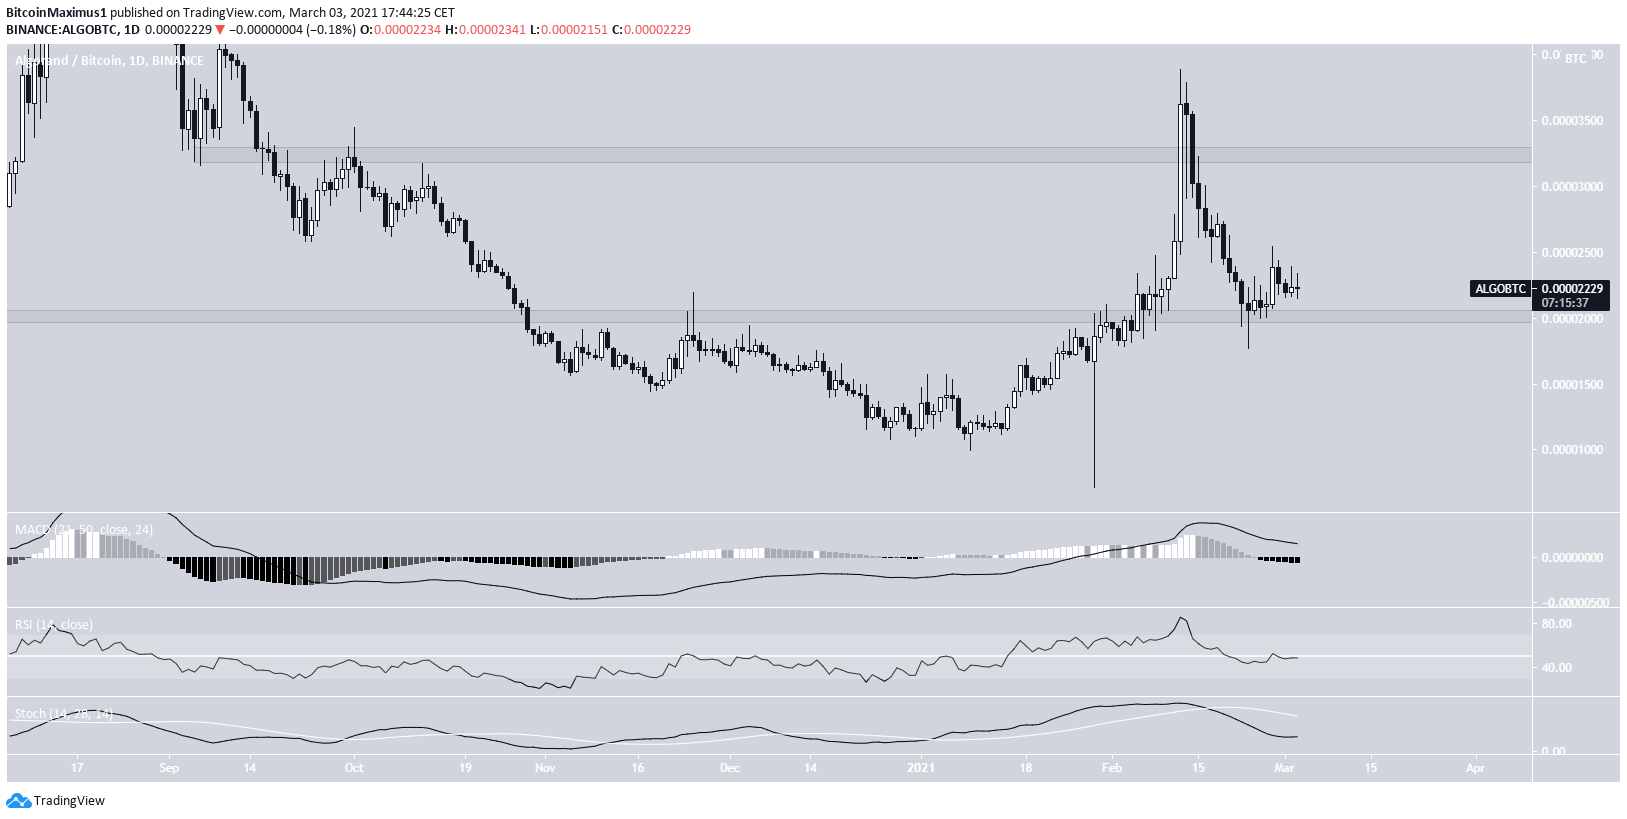
Technical indicators for ALGO/BTC are similar to those from the USD pair, which show a potential trend reversal but fail to confirm it.
However, ALGO/BTC has clearly bounced at the 2000 satoshi support level, and the trend is considered bullish as long as it does not close below it.
If the price continues moving upwards, it will find the next closest resistance area at 3250 satoshis.
Conclusion
To conclude, while both ALGO/USD and ALGO/BTC are showing vital bullish reversal signs, neither has confirmed its bullish trend.
For BeInCrypto’s latest Bitcoin (BTC) analysis, click here.
Disclaimer
In line with the Trust Project guidelines, this price analysis article is for informational purposes only and should not be considered financial or investment advice. BeInCrypto is committed to accurate, unbiased reporting, but market conditions are subject to change without notice. Always conduct your own research and consult with a professional before making any financial decisions. Please note that our Terms and Conditions, Privacy Policy, and Disclaimers have been updated.


