


Algorand (ALGO) is a relatively new cryptocurrency, having been launched on June 19, 2019. The date marked the inaugural Algo auction, which sold out in less than four hours. The platform exceeds 1000 transactions per second and has a latency of fewer than five seconds.
The Algorand foundation is a Boston-based startup which has a residence in Singapore. It was founded by Silvio Micali, a Turing Award recipient and MIT professor.
The ALGO coin is ranked #59 based on market cap. There is a 387,732,994 circulating supply out of a total of 2,919,004,837.
Below, we will look at the market performance of ALGO, do a quantitative analysis, and make a prediction about the price at the end of the year 2019 and 2020.
Note: Instead of using USD, the chart will use USDT (Tether) instead. This is done since TradingView does not support any ALGO/USD pairs.

Outlook
On June 22, 2019, the ALGO price opened at a high of $3.40. A rapid decrease followed throughout the next three days. While the rate of decrease has slowed down considerably, the price has been in a downtrend since. The opening price remains its all-time high.
At the time of writing, on Sept 27, ALGO was trading at $0.018, marking a decrease of 95% in a span of 99 days.

Since ALGO has been in a downtrend for such a significant period of time, we first need to identify possible areas from which it can initiate a reversal.
In order to do that, we will use a Fibonacci retracement tool on the upward move beginning on Aug 1.
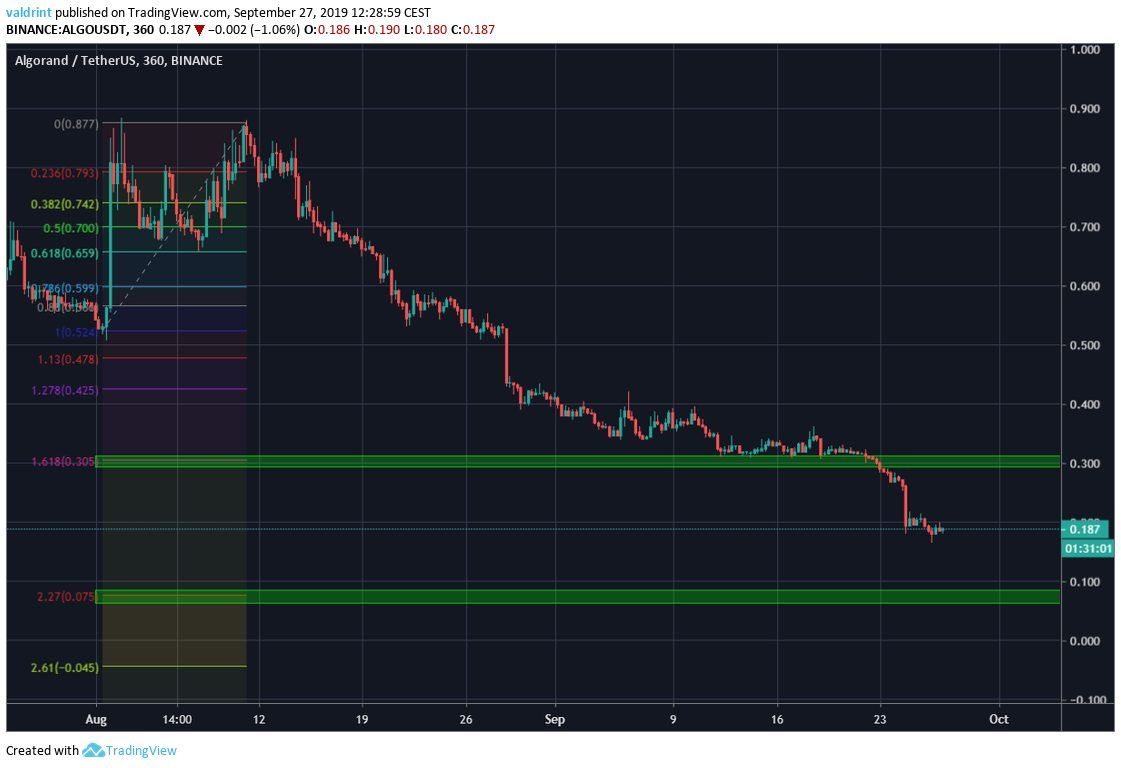
The first support area is found by the 1.618 fib level at $0.03, followed by the 2.27 level at $0.075.
The price reached the first level around Sept 11. It reacted, attempting to initiate an upward move that was ultimately unsuccessful.
At the time of writing, the ALGO price was trading between the 1.618 and 2.27 fib levels.
The next significant support, found at the 2.61 level is into negative territory.
Since we cannot have a negative price, we will make the assumption that ALGO will begin a reversal once it reaches the 2.27 fib level at $0.075.
Triangle Breakdown
One thing that comes into view when looking at the price movement in detail is the numerous triangle breakdowns.
Until now, there have been five such breakdowns, three coming from a descending and two from a symmetrical triangle.
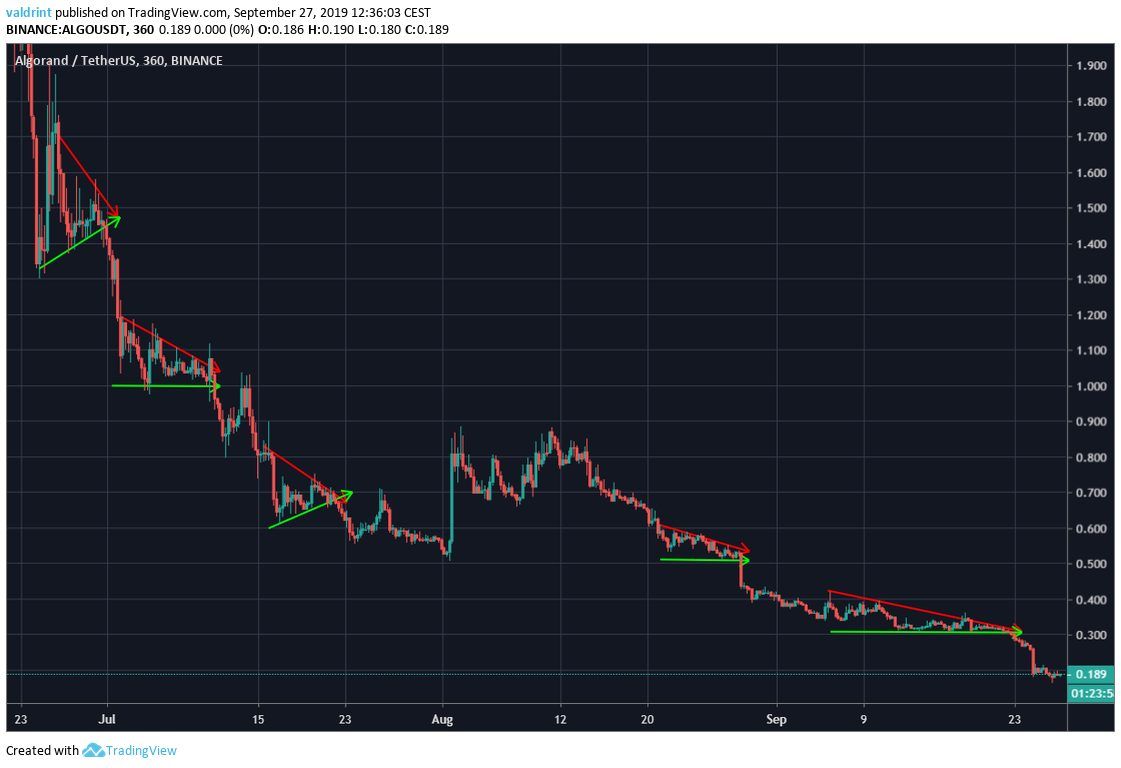
What we will do, is measure the rate of decrease after the breakdown until the next decisive move, whether it be upward or downward.
Doing so will give us an average rate of decrease per day, with which we can predict when the price reaches our support area of $0.075.
The rates of decrease and time periods are presented in the image and table below.
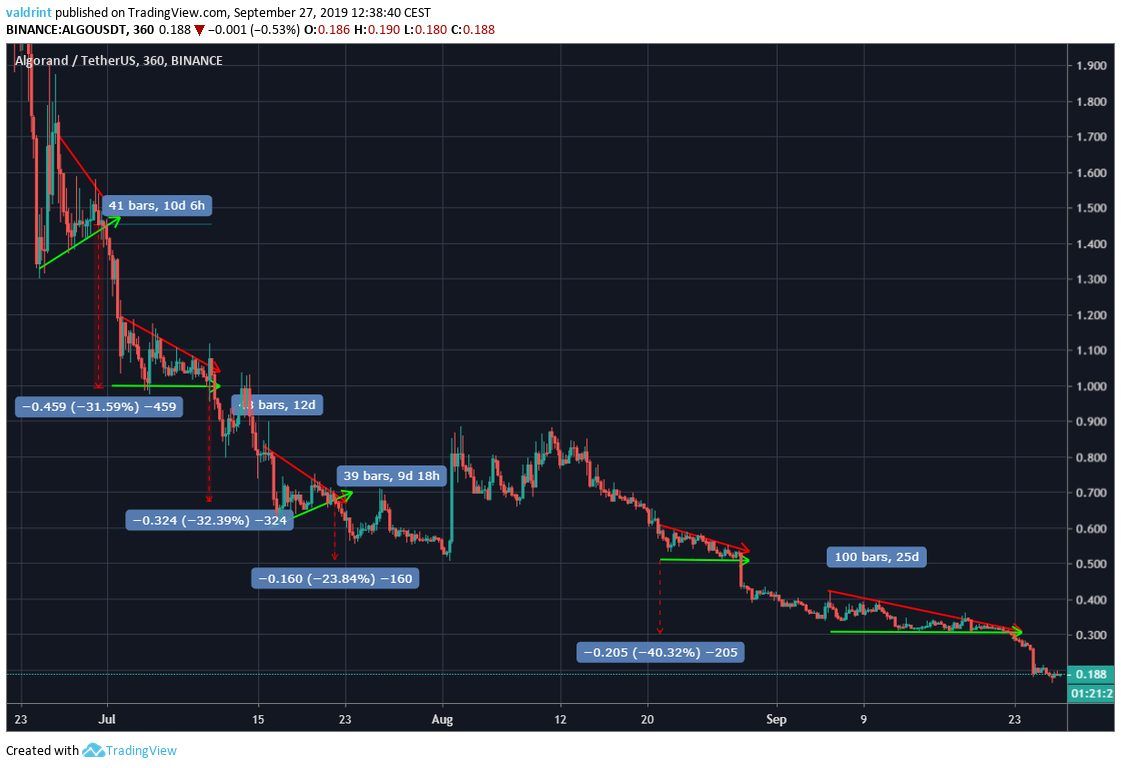
Taking an average from the four average rates of decrease gives us our final rate of 2.45% per 24 hours.
The most recent breakdown occurred on Sept 22.
A decrease of 75% is required for our support area to be reached. Using our rate of 2.45% per day, we can make the prediction that the support area will be reached around Oct 23.
Afterward, a decisive upward move could likely occur.

The RSI
Looking at the daily RSI, we can see that it has decreased below 20 on only three occasions, during the lower-lows of July 11 and 16, and on Sept 24.
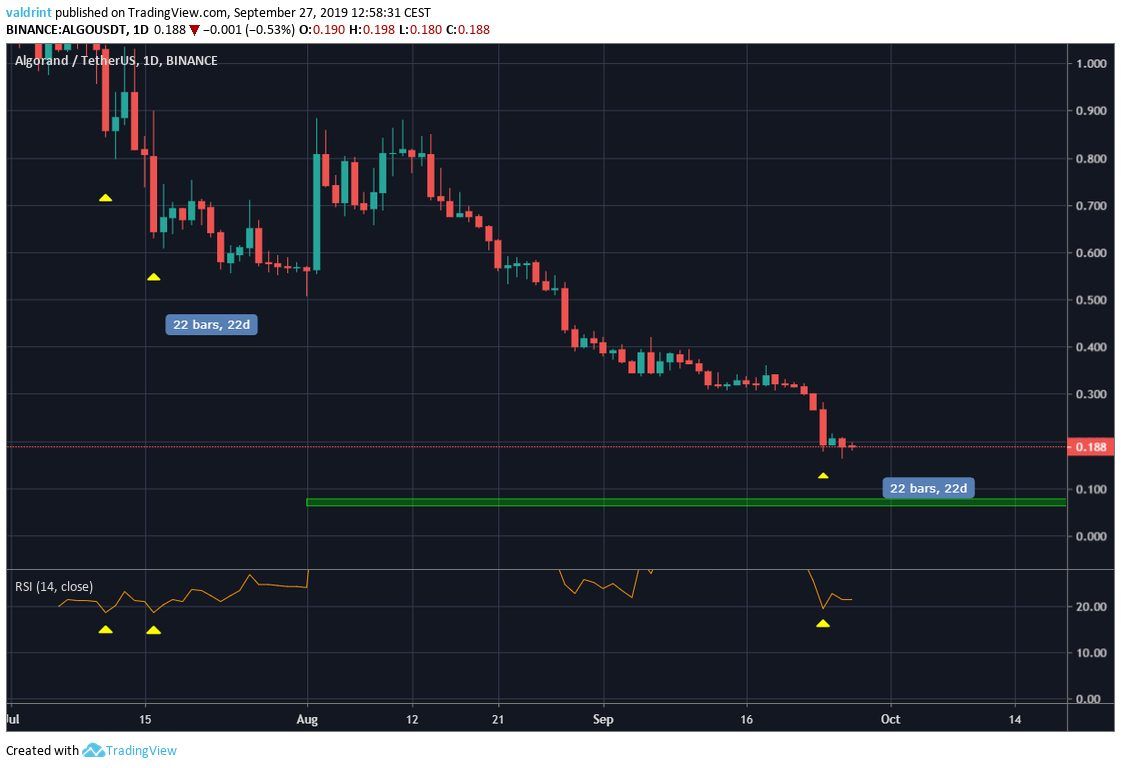
If the price acts in the same manner in the future, it should make a lower-low on Sept 29, and gradually decrease until it reaches the support areas.
Following the June lower-lows, the price made a decisive move after 22 days.
Measuring from the Sept 24 low, this would place a future move on Oct 17, close to our previous target of Oct 23.
While the upward move that began on Aug 1 was rapid, it only lasted twelve days. Afterwards, the price resumed its downward movement.
In order to predict where the price will be at the end of 2019 and beyond, we will look at previous upward trends and figure out their average rates of increase.
There have only been three upward trends until now, neither lasting more than two weeks.
They are presented in the image and table below.
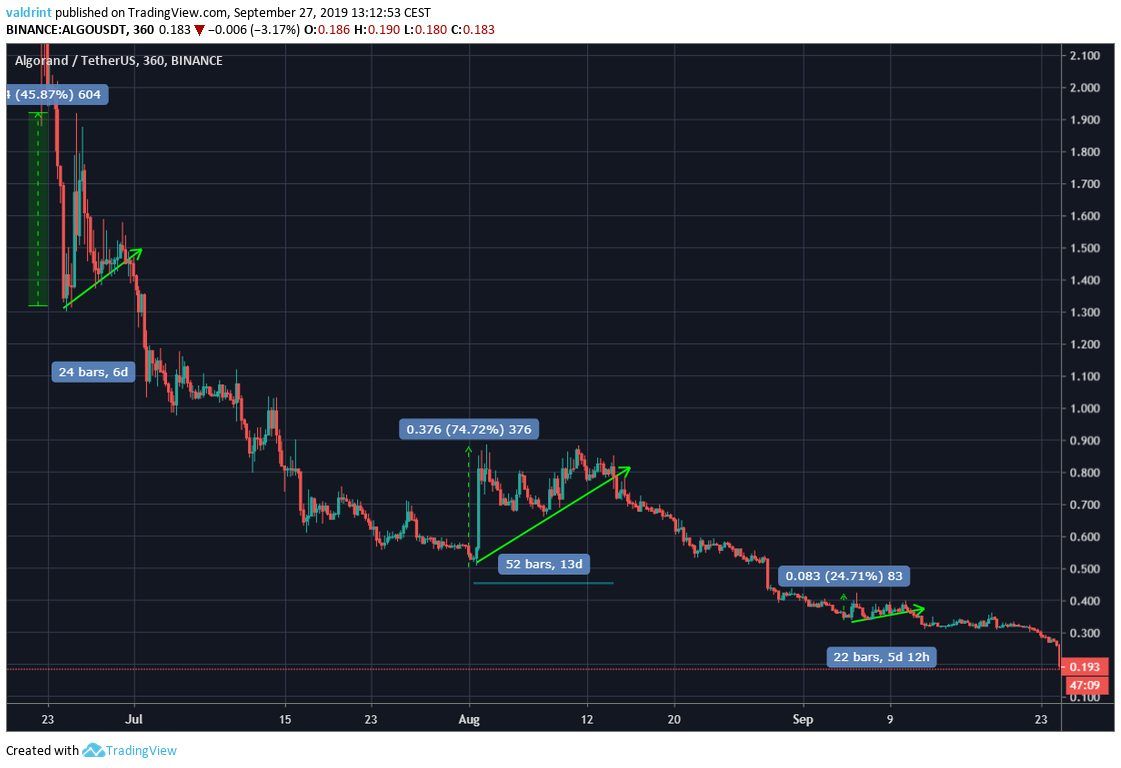
Measuring the average from the three average rates of increase gives us a final rate of increase of 4.04% per 24 hours.
ALGO Price Prediction 2019
Since our predictions gave us a target of Oct 17 and 23 for the initiation of the upward move, we will use the midpoint and consider Oct 20 as the beginning.
Using the 4.04% rate of increase for 71.5 days gives us a price of $0.307 on Dec 21, 2019.

Given the previous and current market movement, this seems like a reasonable price. It is still slightly below the breakdown level of Sept 17.
ALGO Price Prediction 2020
Since we only have roughly three months of data, making a prediction 15 months in advance is bound to be inaccurate.
However, using our rate of increase and various resistance areas we will try to do so.
Using the 4.04 rate of increase for 440 days we get a price of $1.489 on December 31, 2020.
However, there are two very significant resistance areas, found at $0.54 and $0.84. Since the price has not yet been in a long-term uptrend, our rate of increase does not account for short-term downward reversals.
The previous time the price reached the resistance, on Aug 1, it struggled for twelve days.
Assuming no increases in each 12-day resistance area gives us an amended prediction of $1.41 on Dec 31, 2020.
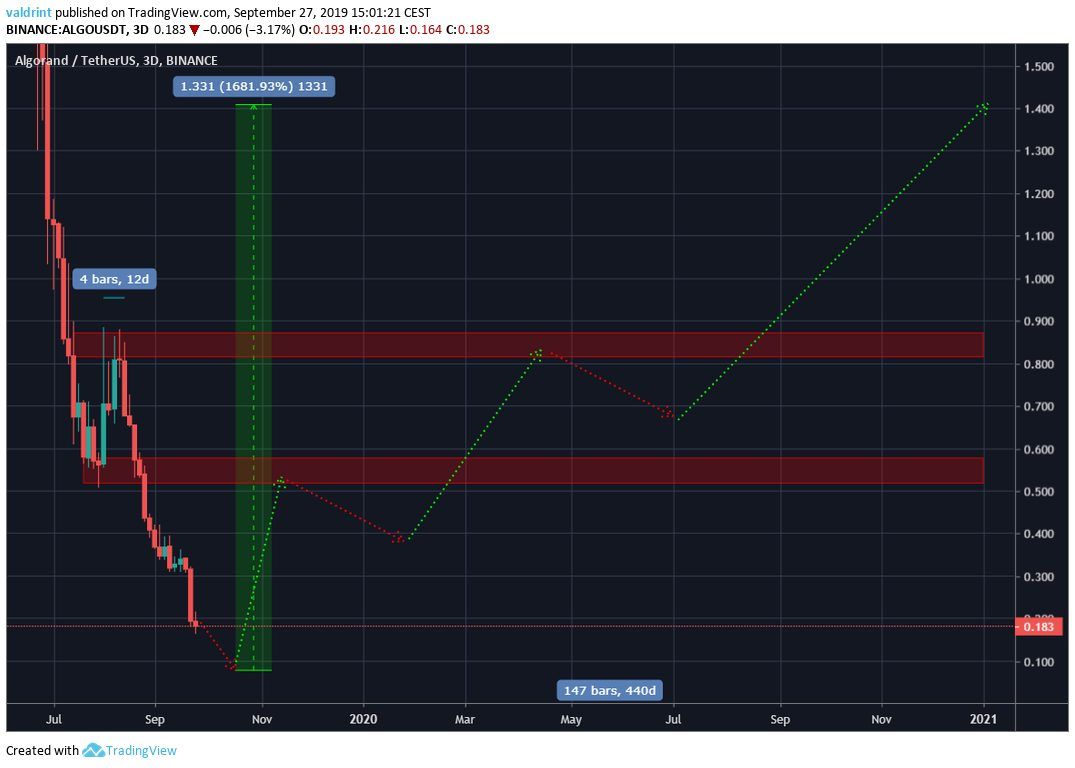
Therefore, the opening price of $3.4 should remain the all-time high for the foreseeable future.
Our price predictions for 2019 and 2020 are given in the table below:
Do you think our predictions are accurate? What are your thoughts on the methods used to reach our conclusions? Let us know in the comments below.
Disclaimer: This article is not trading advice and should not be construed as such. Always consult a trained financial professional before investing in cryptocurrencies, as the market is particularly volatile.


