
On May 10, the Ethereum price broke down from an ascending support line that had been in place for 58 days. However, it has been showing short-term signs of a reversal.
The breakdown transpired after a rapid drop that began on May 10 and caused the price to decrease by 14% in a single day. Well-known trader @TheEuroSniper posted an Ethereum chart that shows a trading range and an ascending support line that the price is currently following.
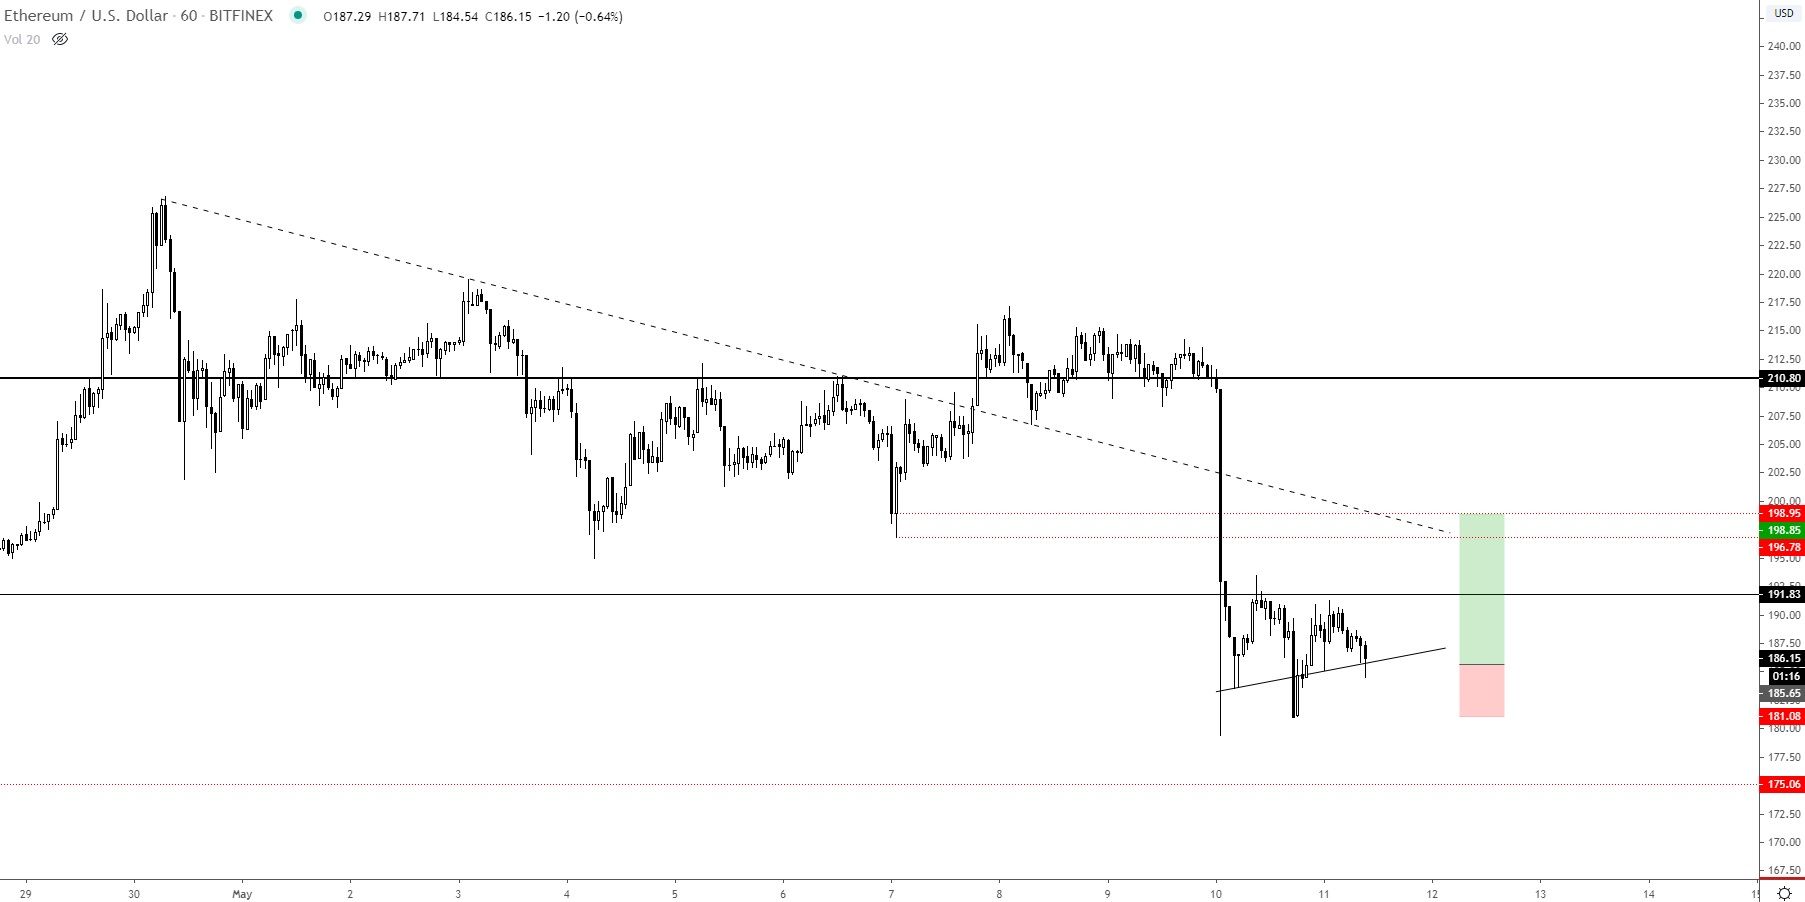
In addition, he posted a “long” trade setup with a target of $198 and a stop loss of $180. In this article, we will take a closer look at the Ethereum price movement in order to determine if the price movement as outlined in the signal will transpire.
Ascending Support Line
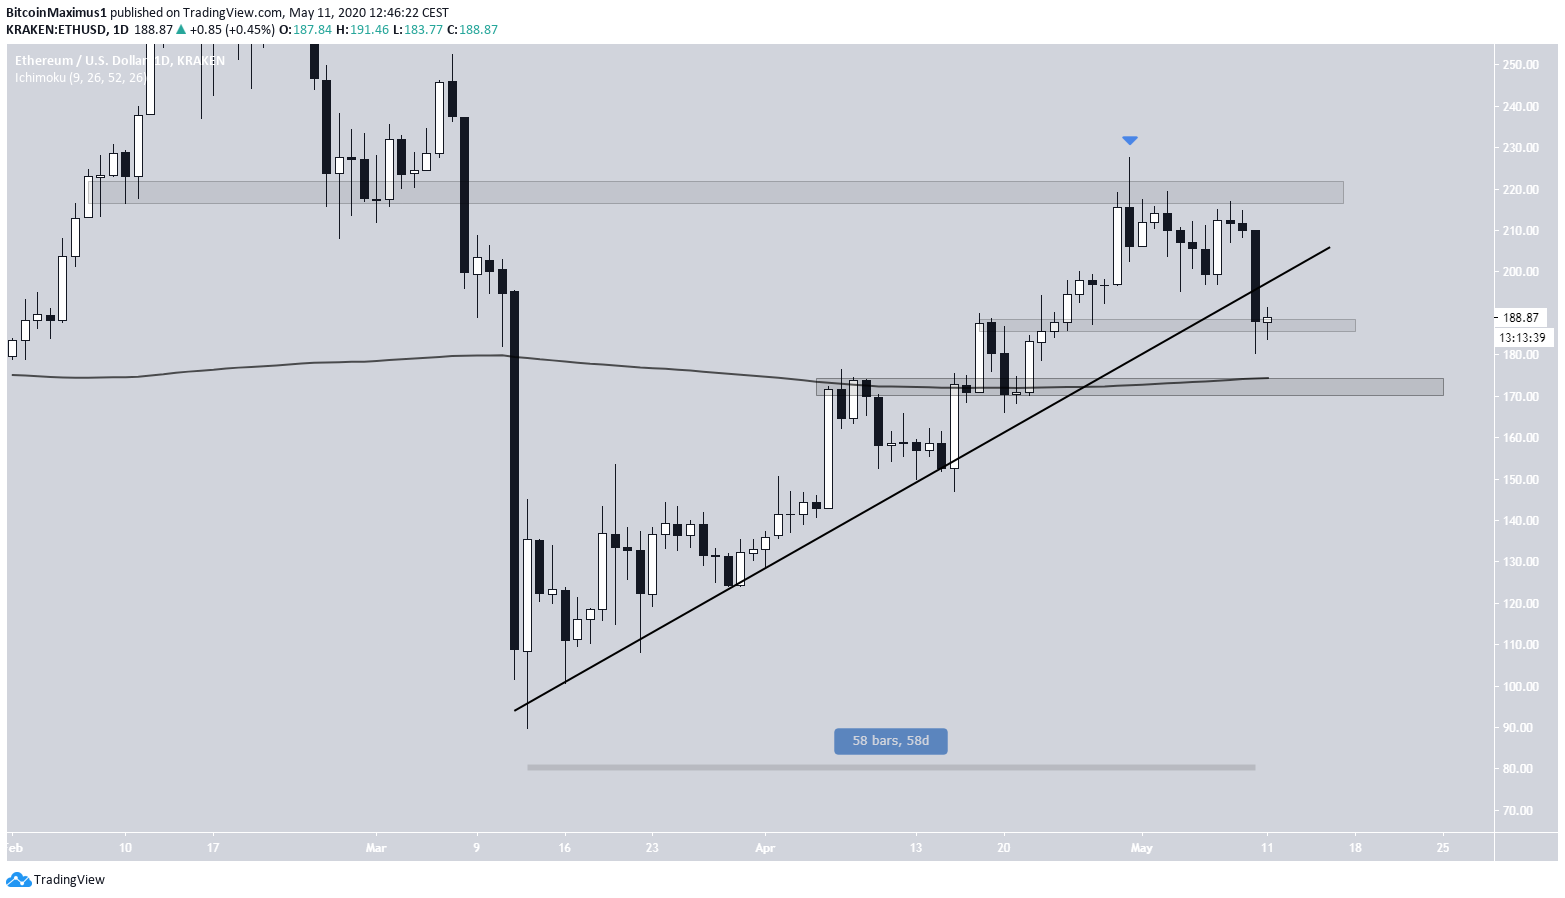
The Ethereum price had been following an ascending support line since March 13. While it had initially moved considerably above this line, it reached a high of $227 on April 30 and has been decreasing since. On May 10, 58 days after the creation of this ascending support line, the price finally broke down.
At the time of writing, it was trading inside a minor support level found at $187. The more important support area is found at $170, also supported by the presence of the 200-day moving average (MA).
Inverse Head And Shoulders
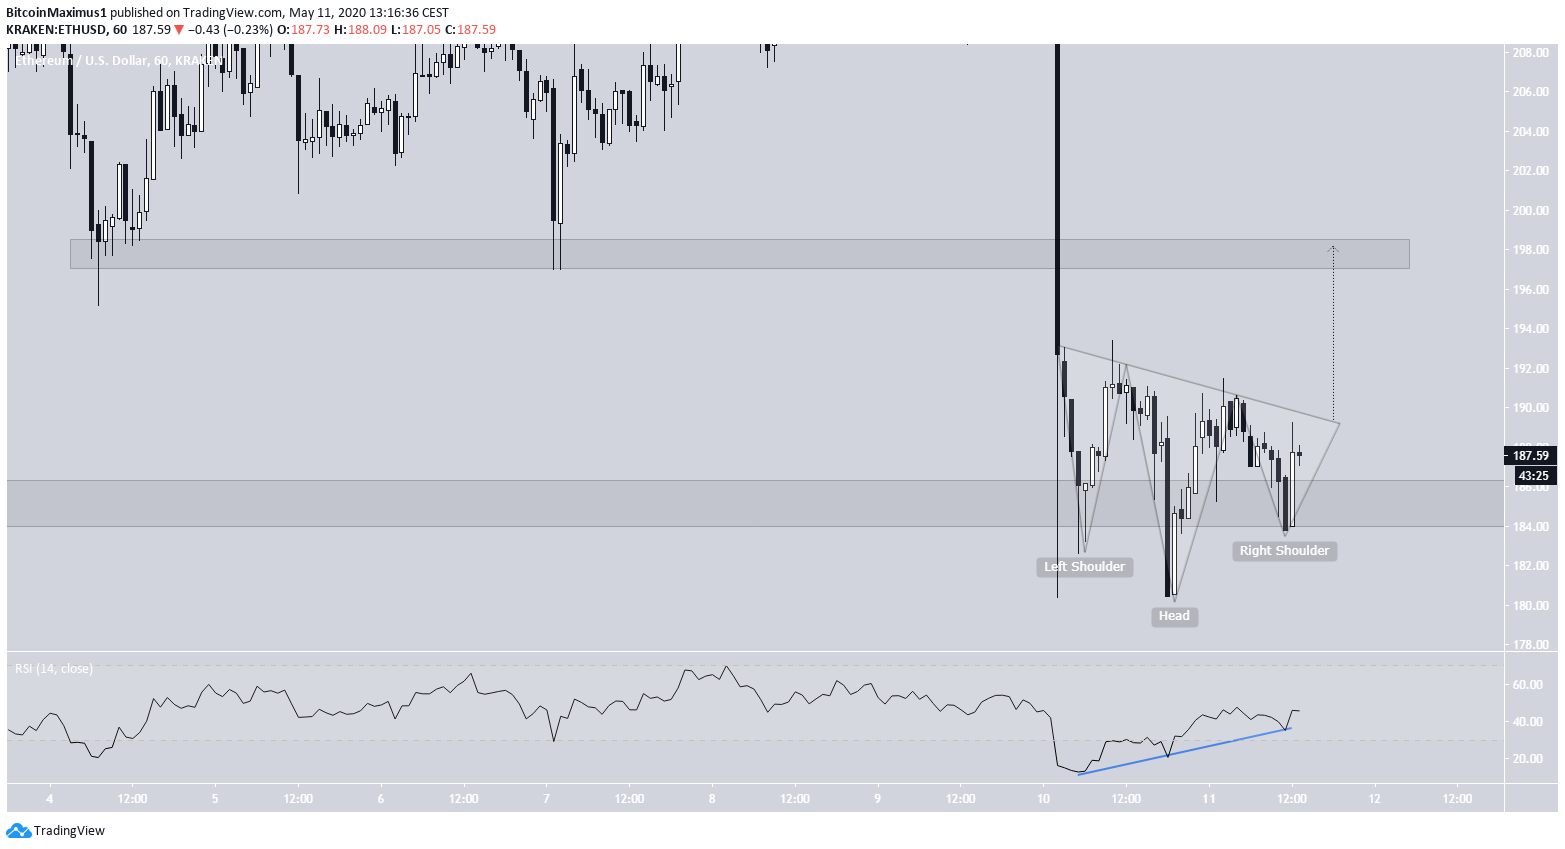
Inside this minor support level, the price has created a short-term inverse head and shoulders, which is considered a bullish reversal pattern. In addition, it is combined with bullish divergence in the RSI, supporting the possibility of a breakout.
A breakout that transpires the entire height of the pattern would take the price all the way to $198, the closest resistance area. This fits perfectly with the target given in the original tweet.
Ethereum/Bitcoin
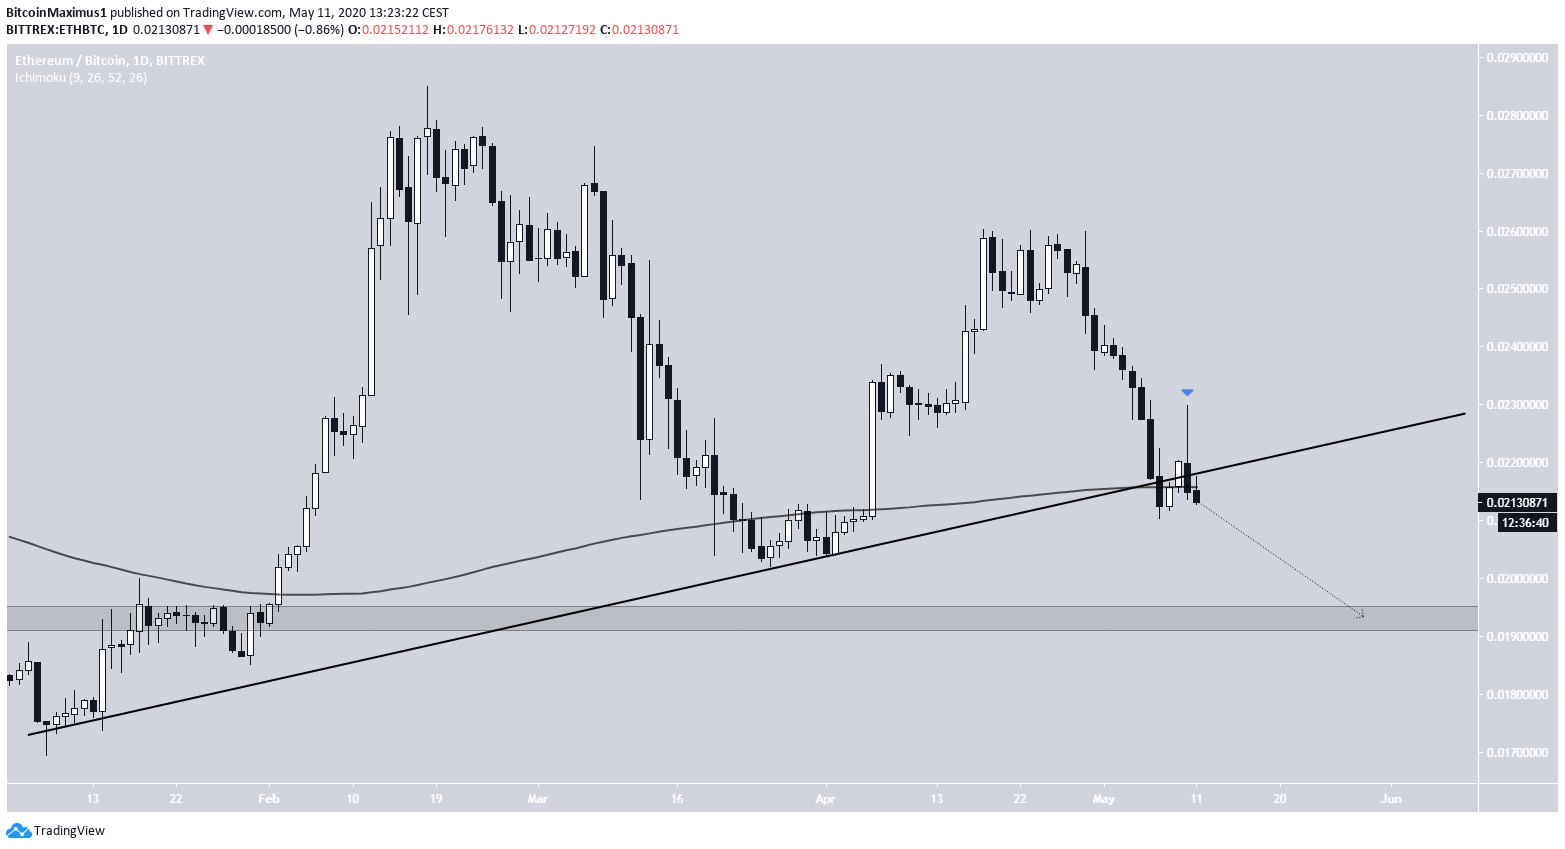
The ETH/BTC chart looks bearish. The price has similarly broken down below an ascending support line and has also lost the support of the 200-day MA.
Therefore, the price is expected to continue moving downwards towards the closest support area found at ₿0.0195.
Conclusion
To conclude, the Ethereum price has broken down below an important ascending support line, possibly indicating that the upward trend that began on March 13 has ended. However, the price has created a bullish reversal pattern in the short-term, which could take it all the way to $198 before the price resumes its downward movement.
