On September 4, the IOST (IOST) price purportedly broke down from a long-term ascending support line.
However, reclaiming the same support line shortly after that was a definitive sign of strength, indicating that the price is likely to move upwards.
Deviation Below Long-Term Support
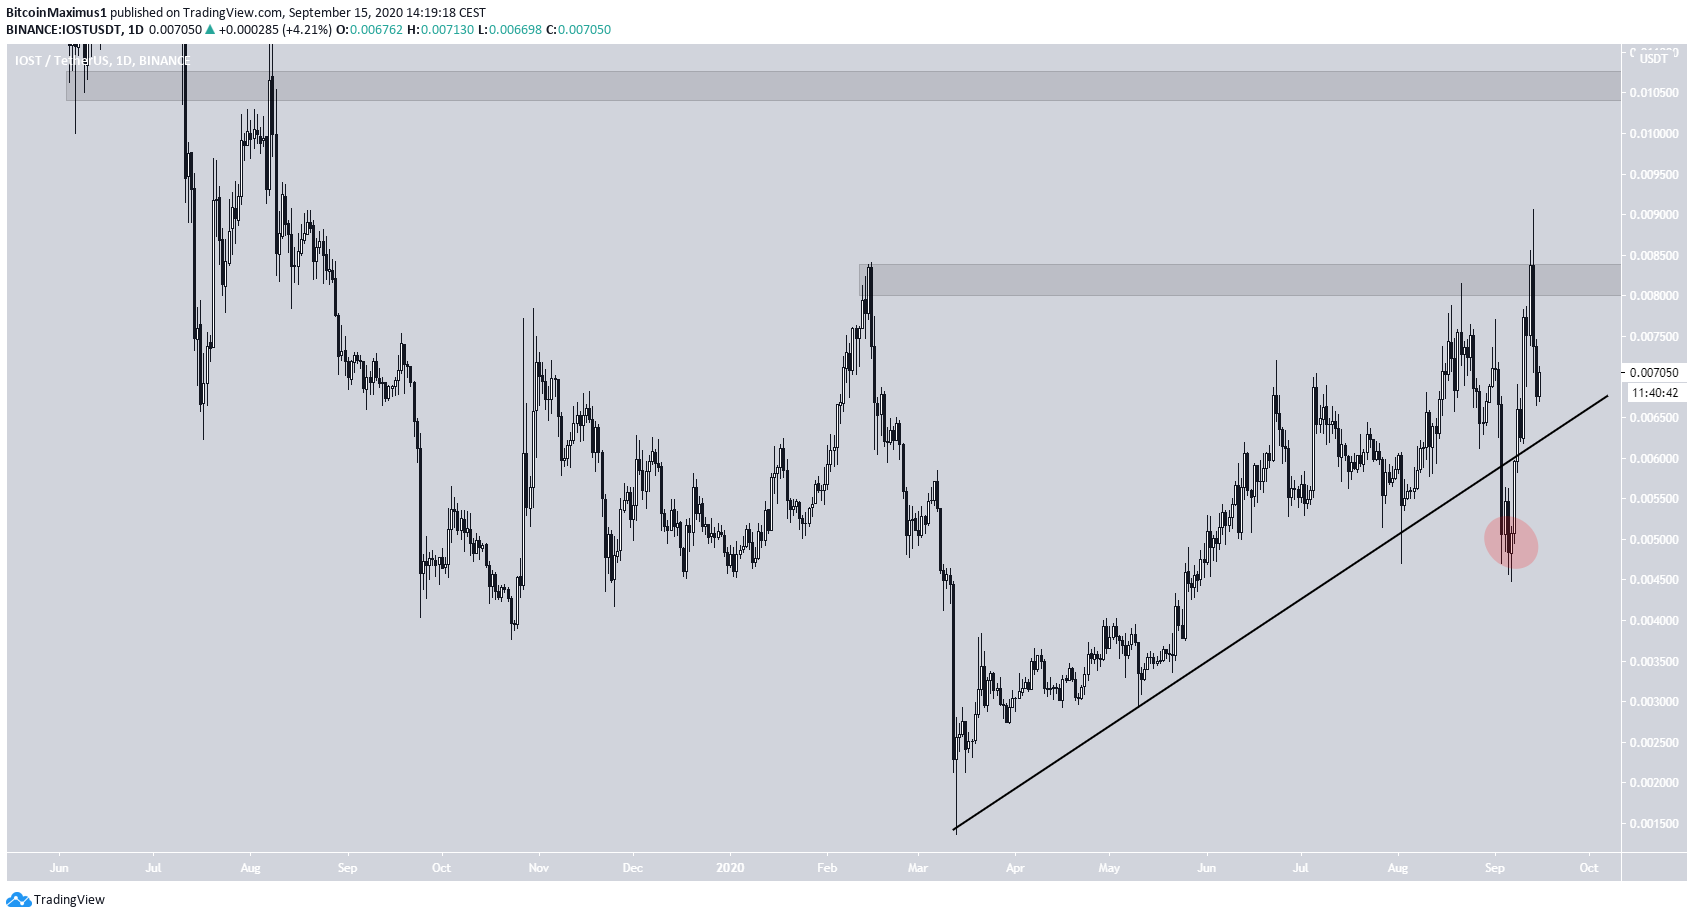
The IOST price has been following an ascending support line since March 13. On September 5, the price broke down from this support line, creating a low near $0.005. However, it reclaimed the line shortly afterward, making the decline just a deviation above support rather than an actual breakdown.
The price reached a high of $0.0090 on September 13 but has been falling since. This move validated the $0.0083 area as resistance and left a very long upper wick in its wake. If the price successfully moves above this resistance area, it could increase all the way to $0.01.
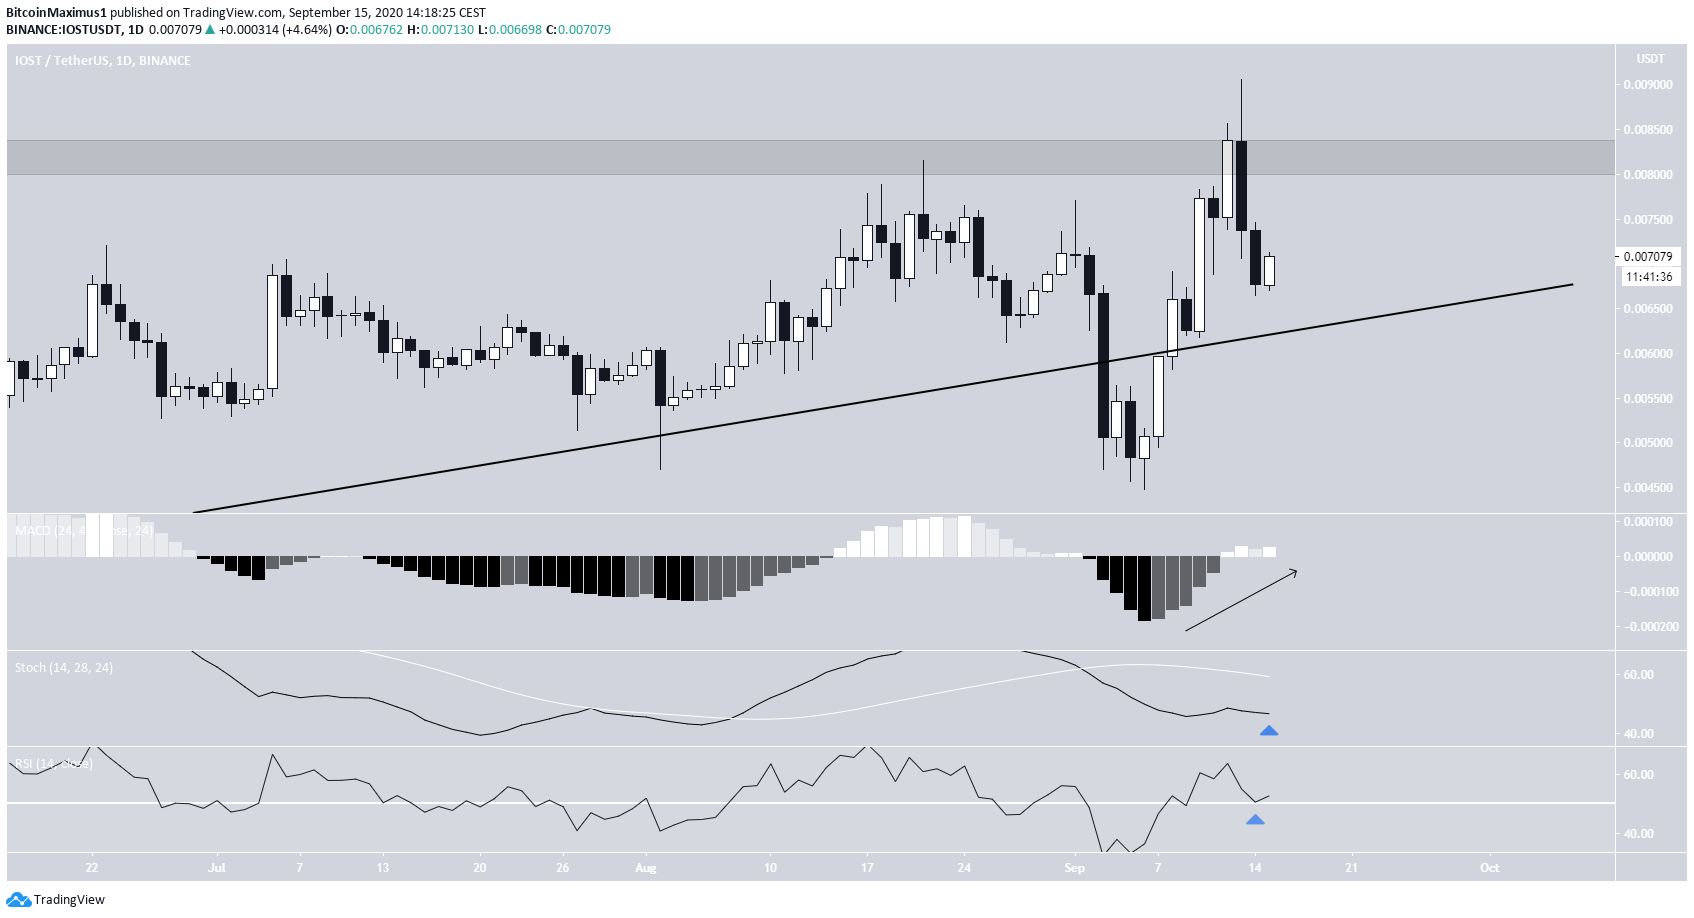
Technical indicators are bullish, though they do not confirm the possible breakout.
The MACD is increasing and has crossed into positive territory, and the RSI has bounced at the 50 line. In addition, the stochastic oscillator has begun to turn upwards. However, there is no bullish divergence nor bullish cross that would support the possibility of a breakout.
Possible Bounce
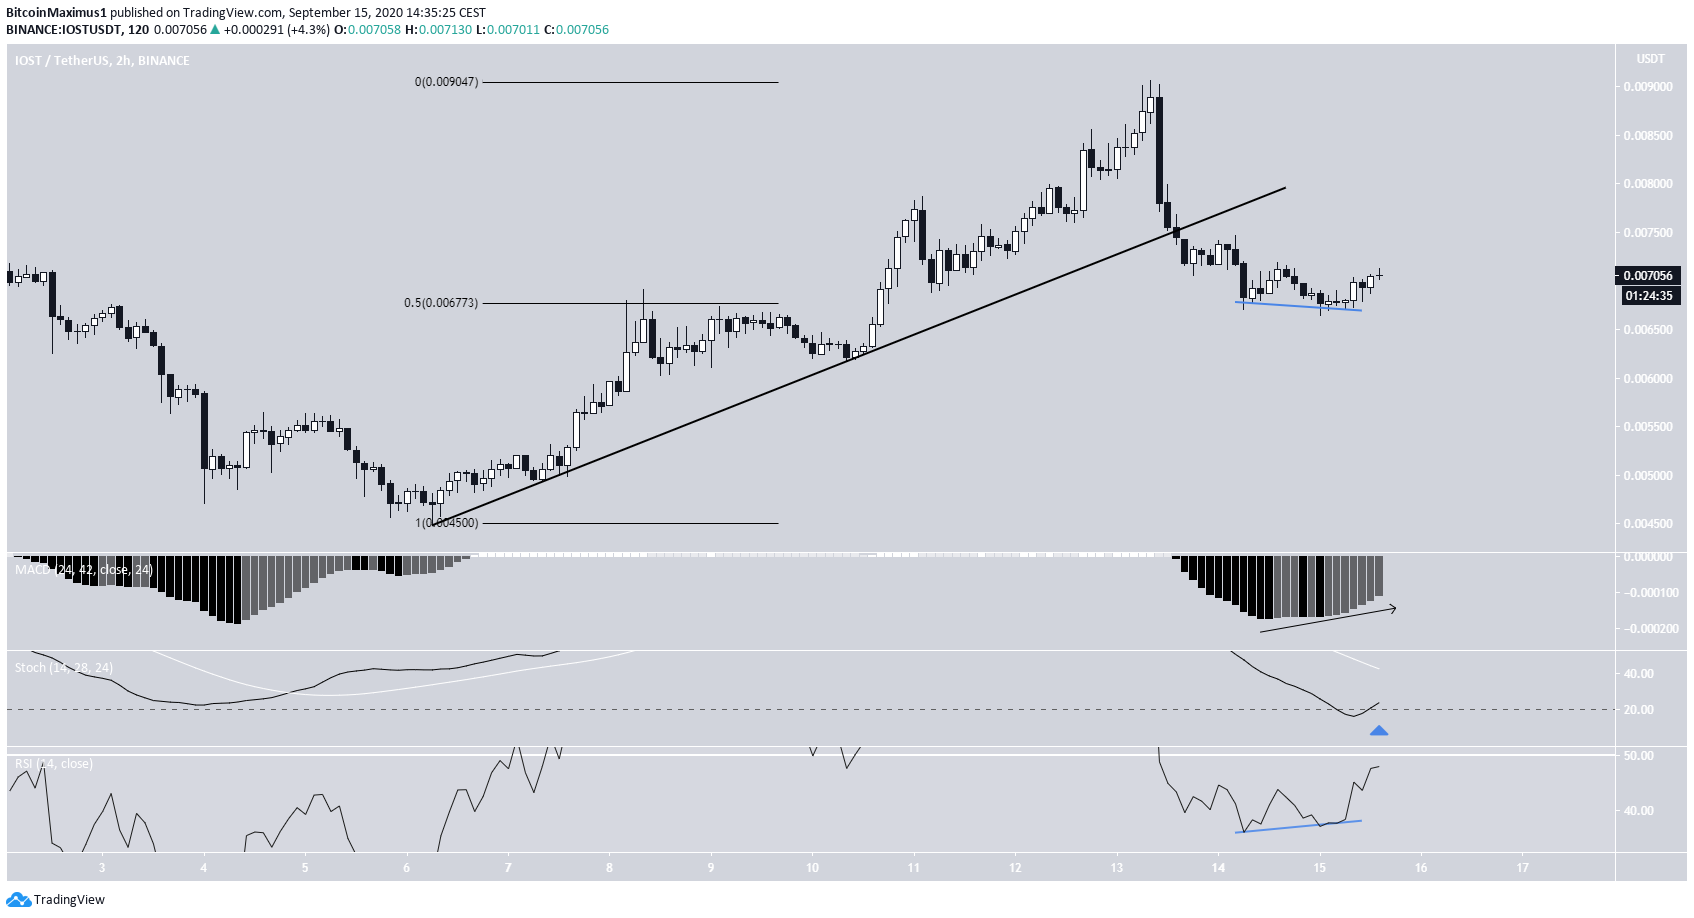
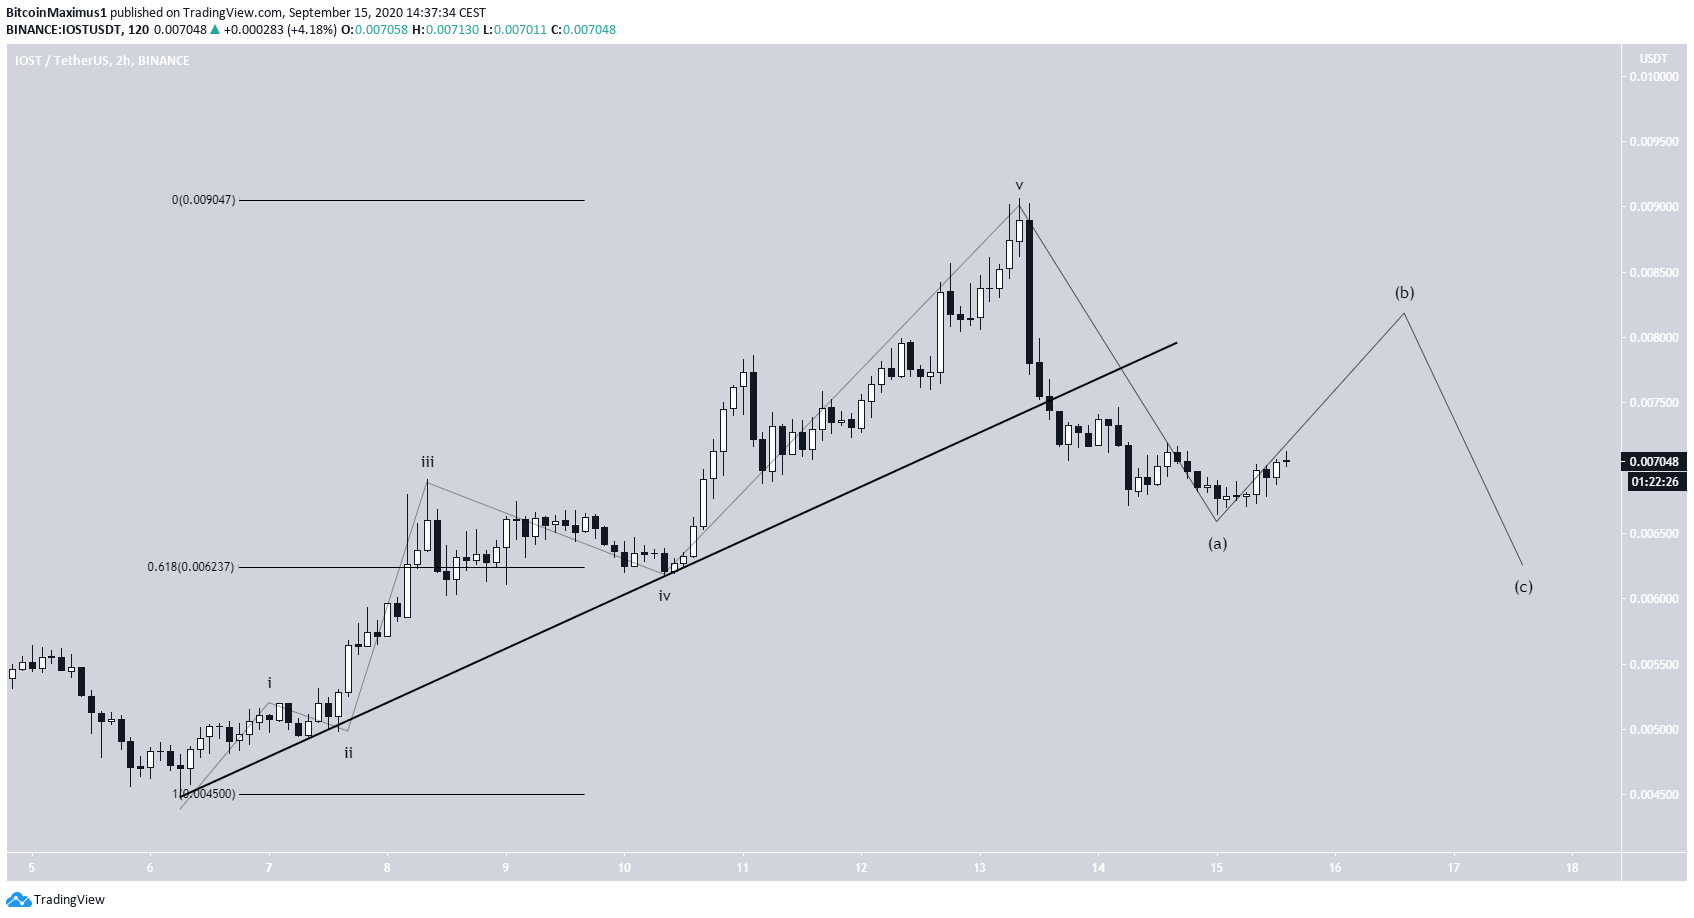
The short-term chart reveals another breakdown from an ascending support line. However, the price has bounced at the 0.5 Fib level and has possibly made a double bottom.
Furthermore, technical indicators are bullish. There is bullish divergence on both the RSI and the MACD, while the stochastic oscillator is very close to making a bullish cross. These signal that the price will likely move upwards.
The price may have completed a bullish impulsive five-wave formation. This is a good sign since it would mean that the trend is likely bullish.
However, it would also increase the possibility of the previously mentioned price increase being the B wave of an A-B-C formation, which would eventually create a slightly lower low before the price would resume its upward movement.
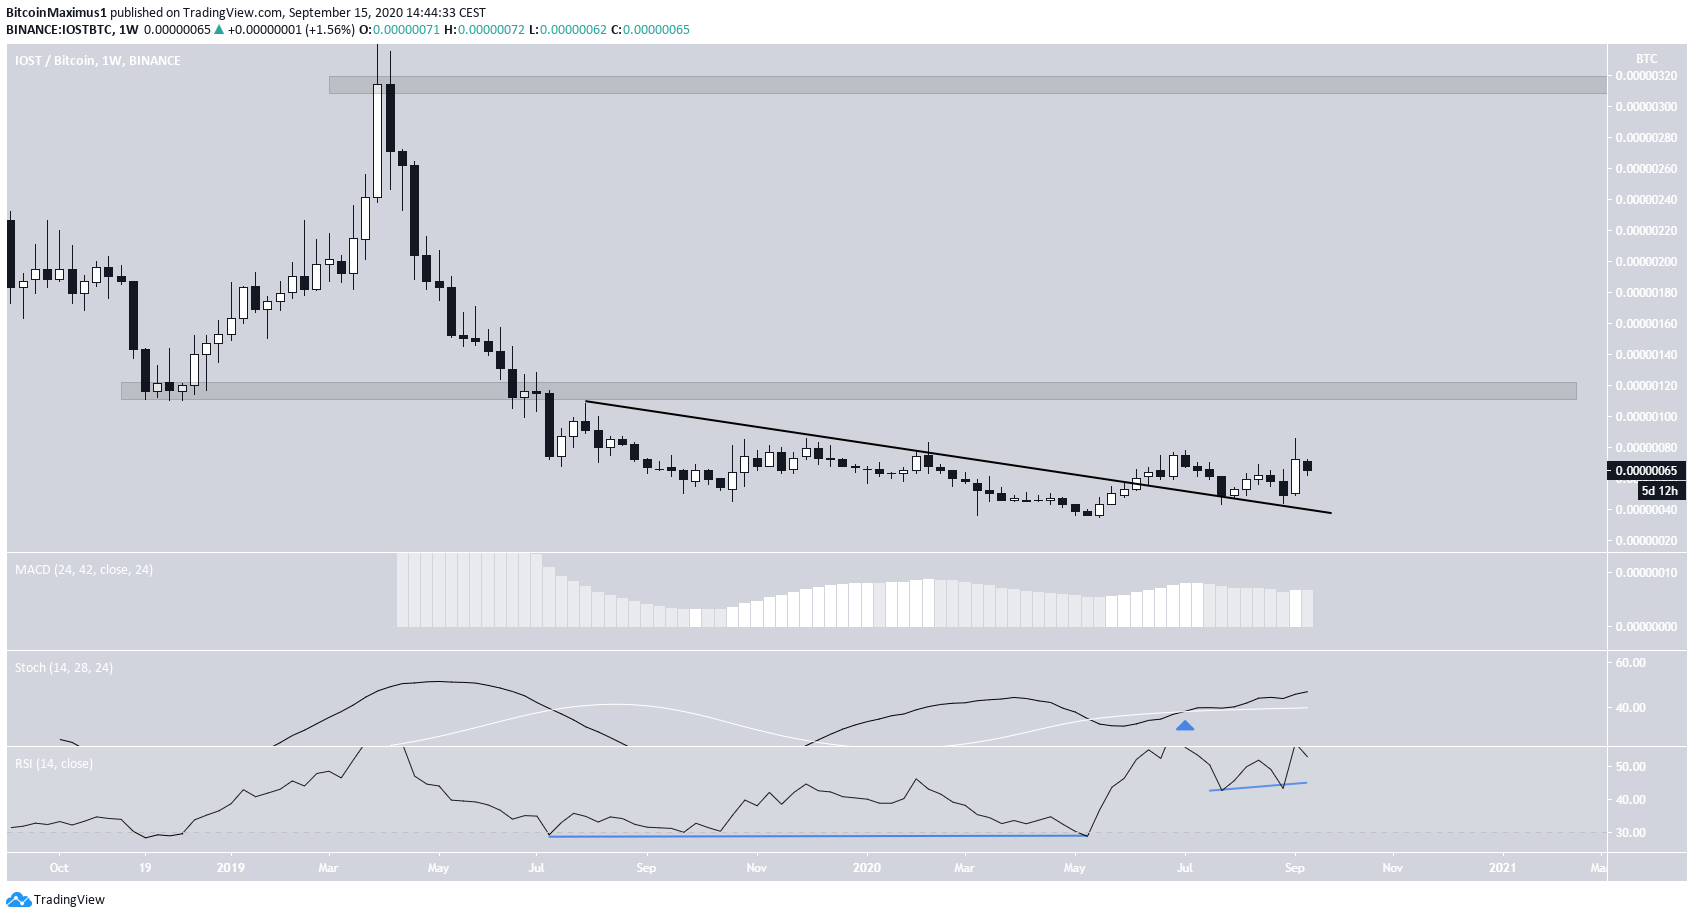
IOST/BTC
Cryptocurrency trader @mesawine1 outlined an IOST/BTC chart, stating that the price action looks akin to a long-term accumulation, which would be very bullish if the price broke out from the current range.
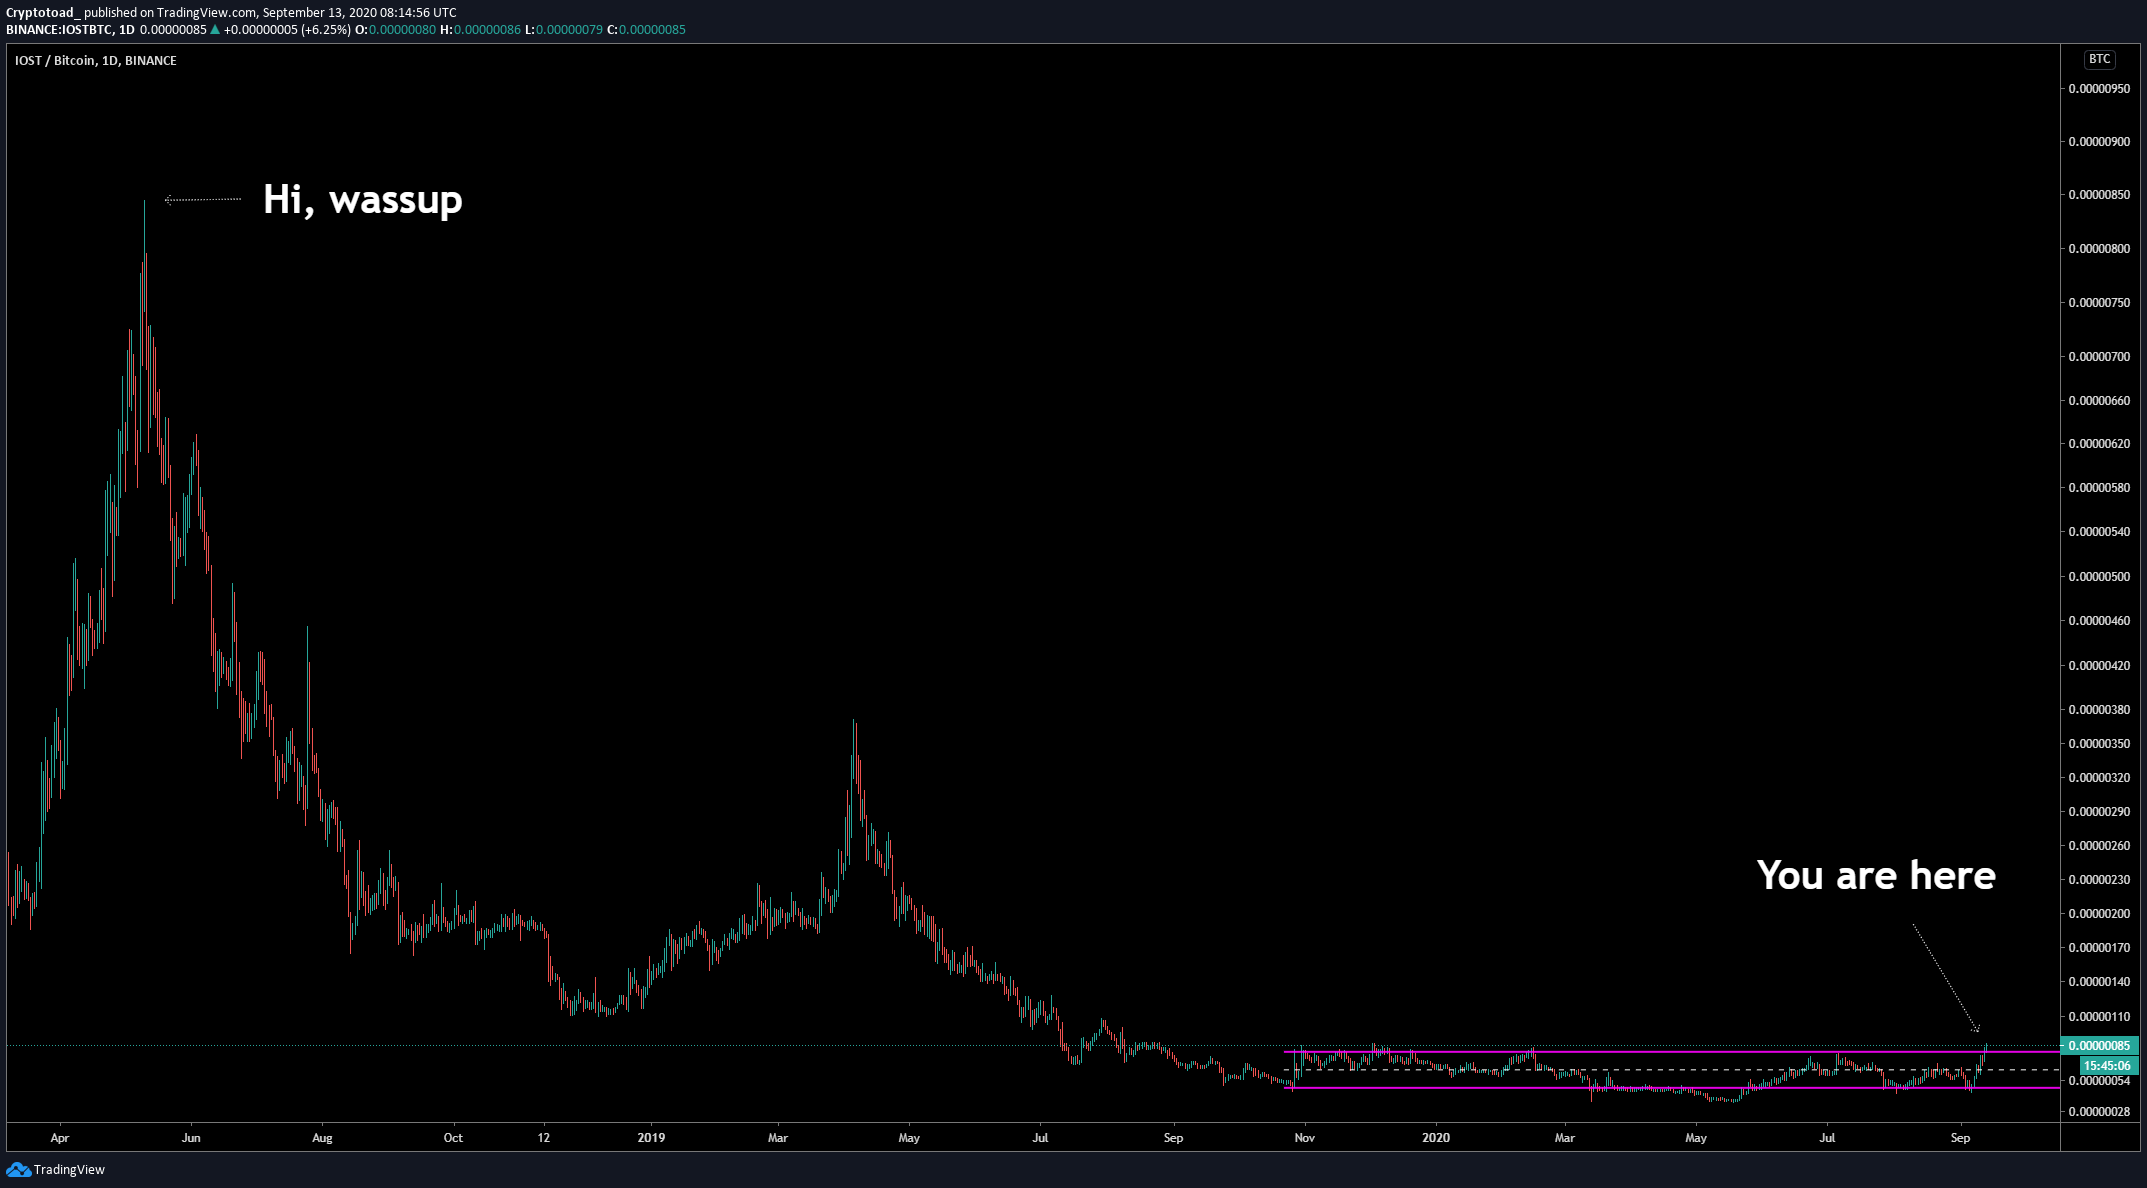
Indeed, IOST/BTC has broken out from a descending resistance line and validated it as support afterward. If the price continues moving upwards, the closest resistance areas would be found at 120 and 315 satoshis.
Technical indicators are bullish, supporting the possibility of a rally.