Aave (AAVE) has been increasing since Dec 20 and has confirmed that its short-term correction is complete.
In the period between Dec 13 – 20 (red circle), AAVE decreased below the $178 horizontal area, which was expected to act as support. However, it bounced on Dec 20 and reclaimed the $178 area in the process. This is a very bullish development since it renders the previous breakout as a deviation only.
Furthermore, it continued increasing and broke out from a descending resistance line on Dec 24. The line had previously been in place since May 18, and the breakout confirmed that the correction is complete. The closest resistance area is at $420.
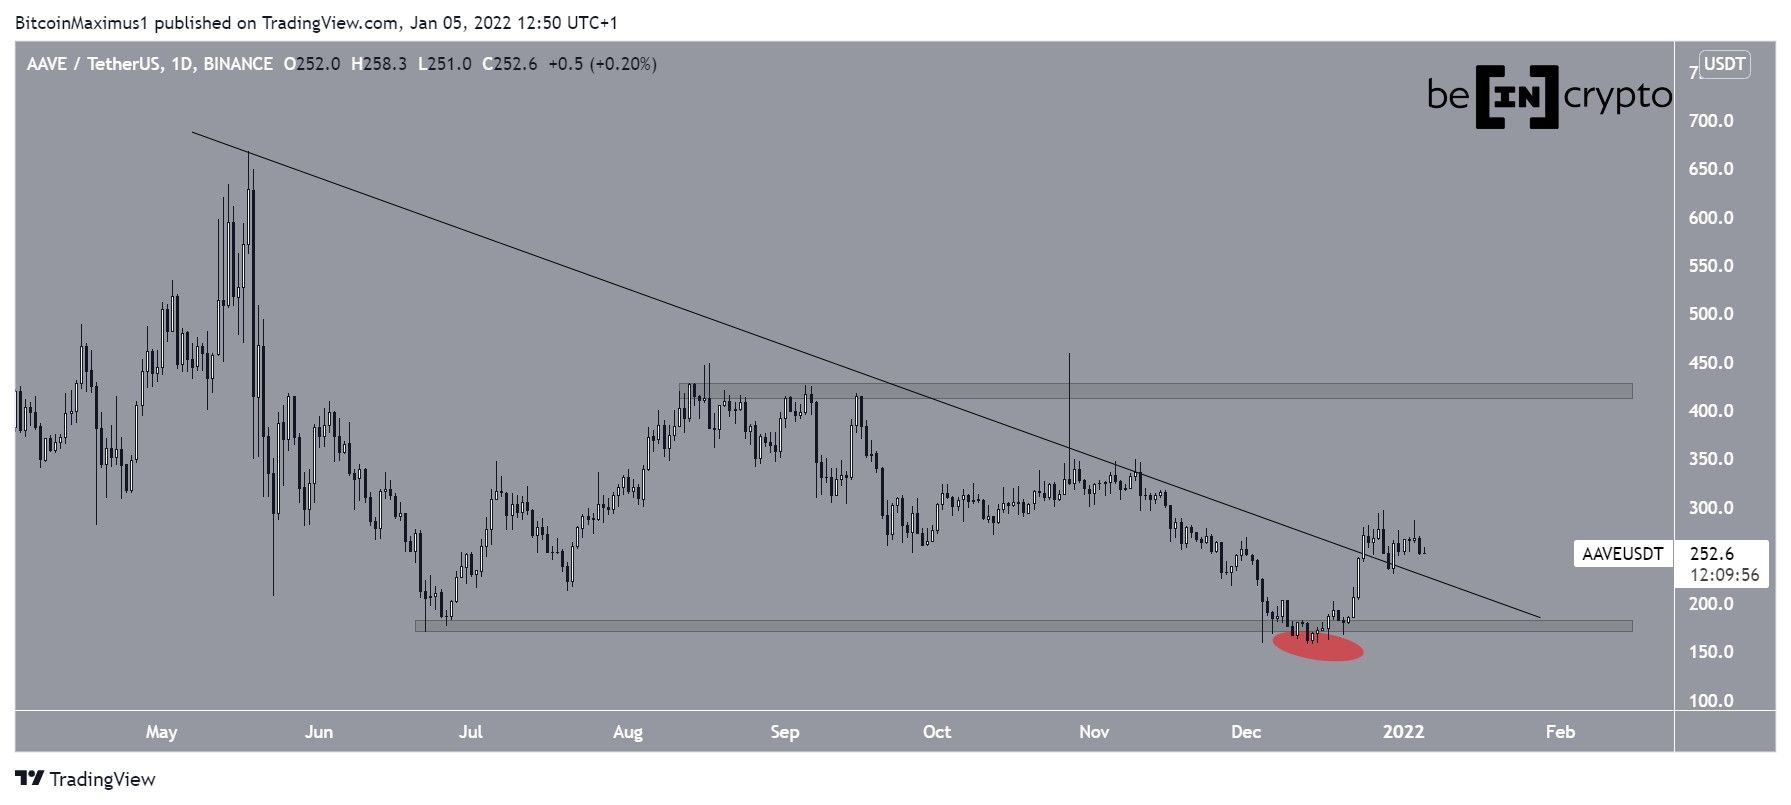
Current breakout
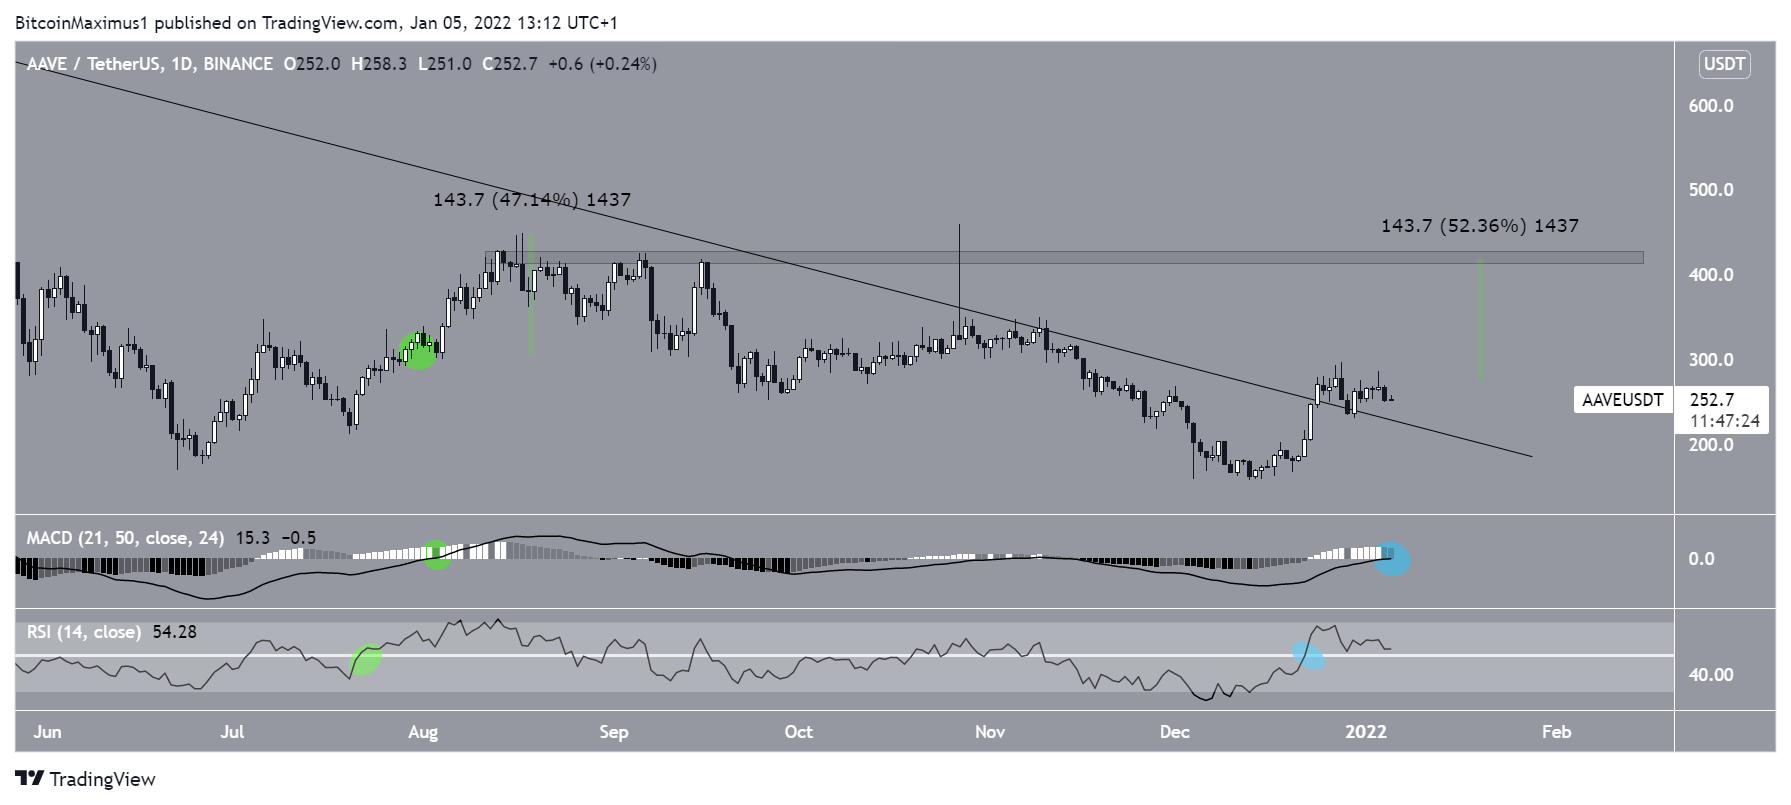
Technical indicators for AAVE in the daily time-frame support the continuation of the upward movement. This is visible in both the RSI and MACD.
The RSI, which is a momentum indicator, has crossed above 50, while the MACD has moved into positive territory (blue). Both of these are considered bullish signs and often precede upward movements.
The previous time these two events occurred (green circles) was in the beginning of Aug, and preceded an upward movement of 47%. An upward movement of 52% would be currently required for AAVE to reach the $422 resistance area.
Market analyst @Incomesharks tweeted an AAVE chart, stating that the token is likely to increase to $250. Since the tweet, the token has already reached this level.
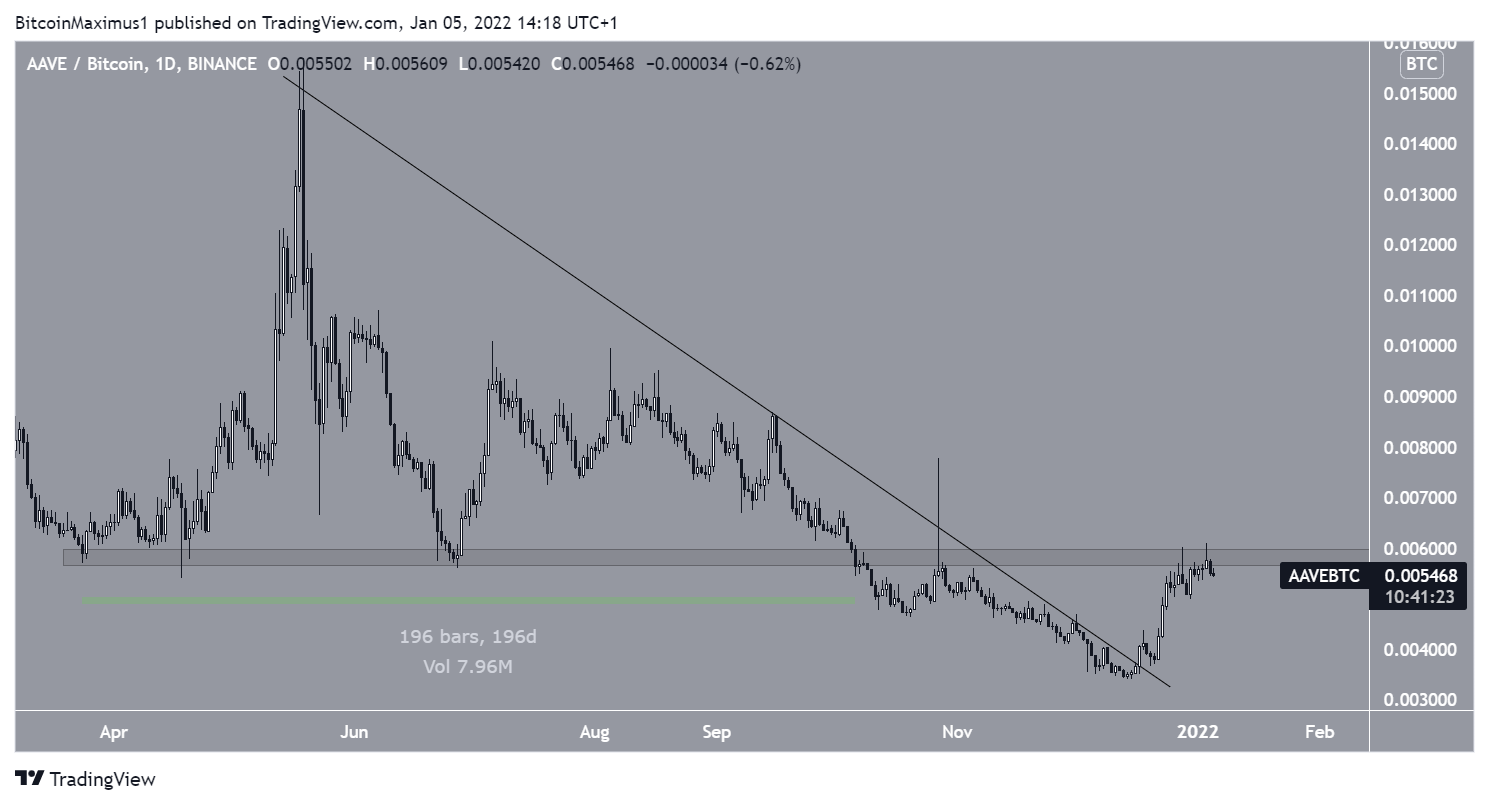
AAVE/BTC
The AAVE/BTC pair also shows a bullish chart, since the token has broken out from a descending resistance line. However, it is currently facing resistance at ₿0.0058.
This is a crucial resistance area since it previously acted as support for 196 days. A breakout above it could greatly accelerate the rate of increase.