


The Tomochain (TOMO) price has been increasing since late February. The trend accelerated at the beginning of June and broke out from an important resistance area in July.
As long as the price is trading above this level, the long-term trend is bullish.
Breakout From Previous Resistance
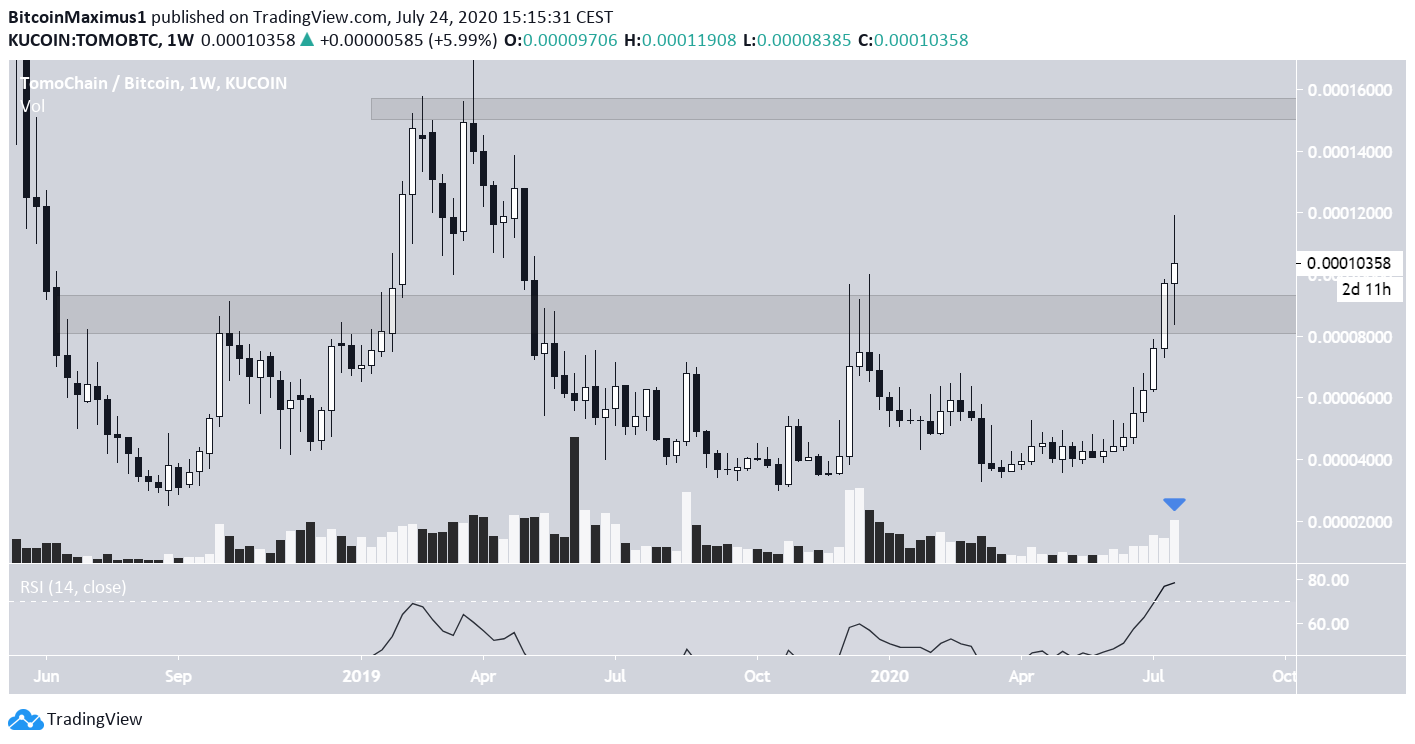
The TOMO price began an upward move in February 2020, which intensified in June. Since then, TOMO has increased considerably, creating eight successive bullish weekly candlesticks in a row.
Furthermore, TOMO has broken out from the 8700 satoshi resistance area, below which it had been trading since April 2019.
Technical indicators are bullish. While the RSI is overbought, it has not yet formed any bearish divergence. Furthermore, volume has been quite high during the current weekly candlestick, even though there are two more days until the weekly close.
As long as the price is trading above the 8700 satoshi area, it should increase towards the next resistance area at 15,500 satoshis.
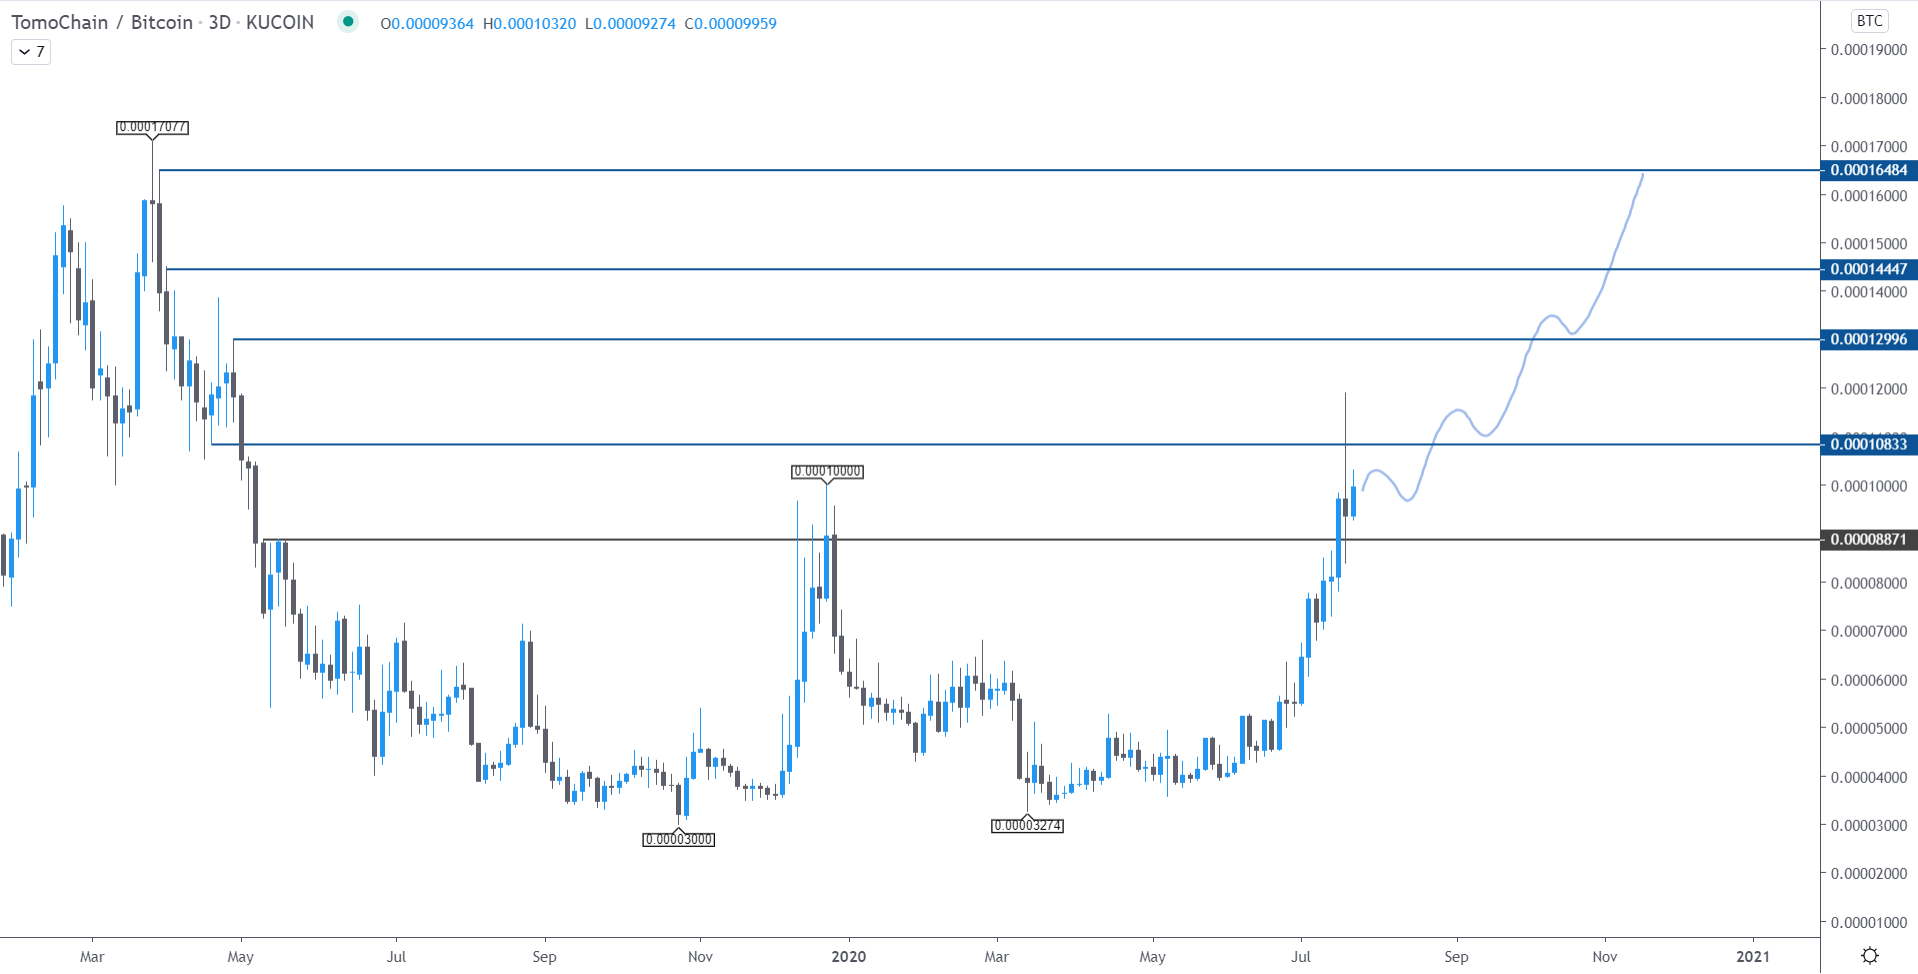
Cryptocurrency trader @tradingtank outlined a TOMO chart and stated that the graph looks quite bullish, giving targets all the way to 16,500 satoshis. The previous resistance area that broke is outlined in the same way.
The target also fits with our closest resistance area, even though it’s slightly higher.
Short-Term Breakout
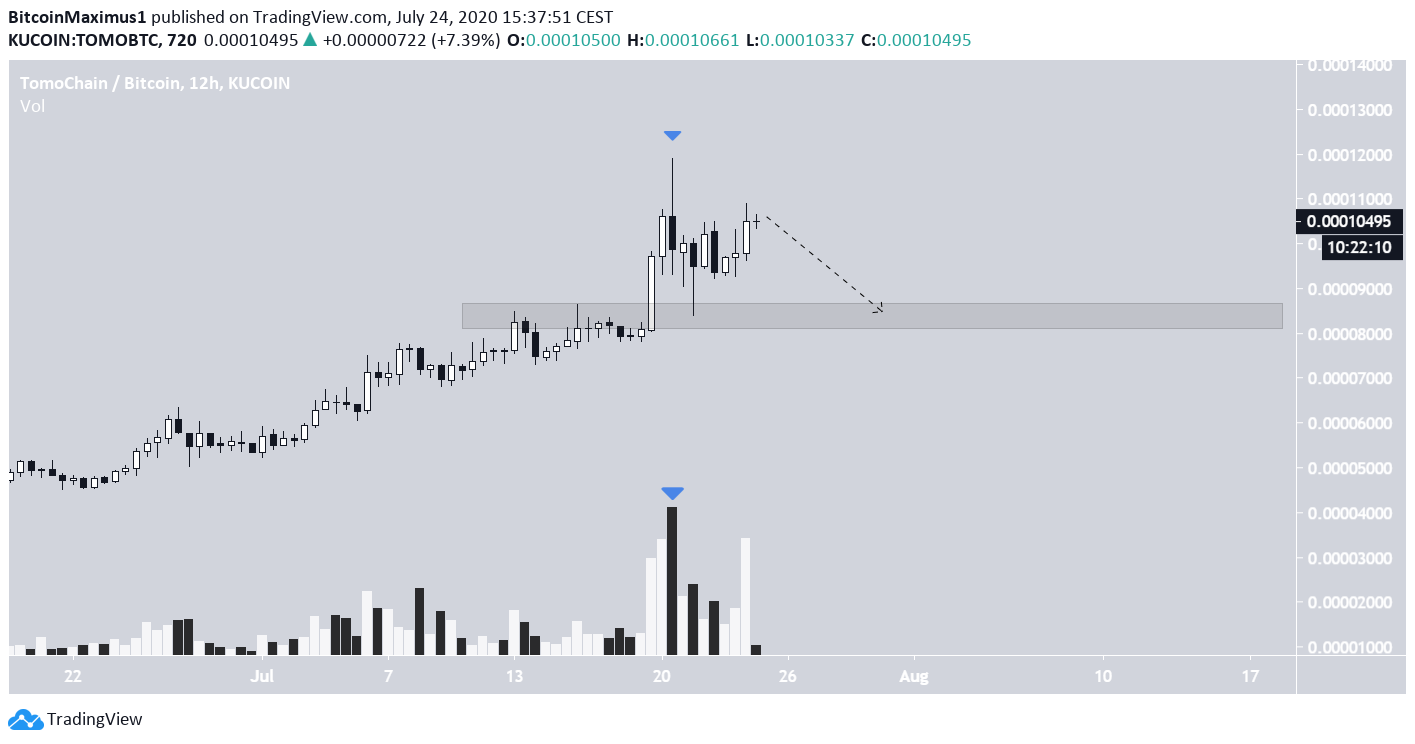
In the shorter-term, the price has formed a shooting star candlestick, which is a bearish reversal sign, often indicating that the upward trend has ended. This was done on considerable volume.
However, the price has rallied since then and is currently testing the highs of the shooting star.
Due to this, the price should retrace back to the breakout level, which it also validated as support in the form of a long lower wick before eventually moving upwards.
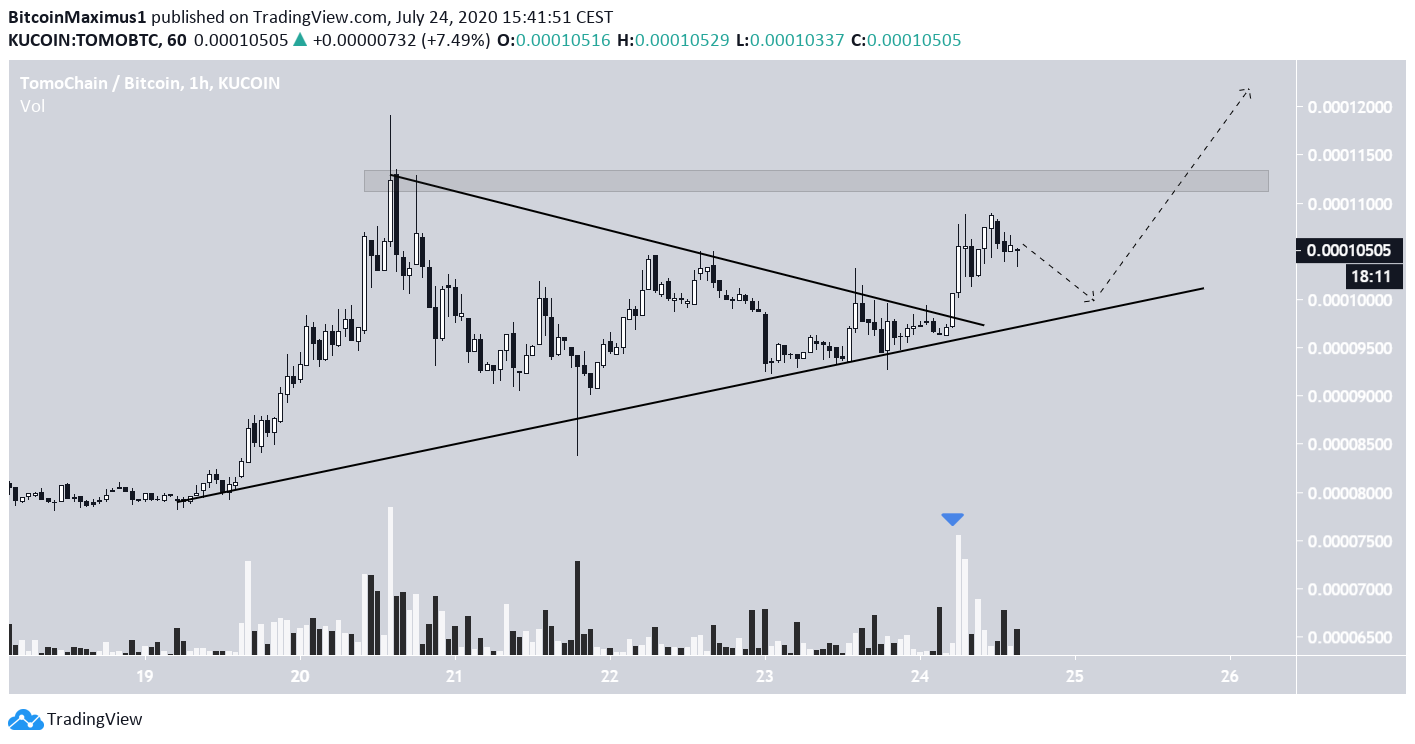
However, the hourly chart reveals a breakout from a symmetrical triangle, though, it might still be following the support line.
A successful breakout of the 11,100 satoshi resistance area and its subsequent re-test as support would indicate that the price will continue moving upwards towards the resistance area outlined in the first section.
To conclude, the TOMO price has broken out from a long-term resistance area and should continue increasing towards the resistance areas outlined above.


