


The Cardano (ADA) price is trading at the convergence point between an important resistance and support. As a result, a decisive move is likely to occur soon.
Even though the long-term readings support an ongoing price decrease, whether the price breaks out or down from these short-term levels will be key in determining the future trend’s direction.
Cardano Price Falters After Failed Breakout
The technical analysis on the weekly time frame provides a bearish ADA token price forecast. The main reason for this is the deviation above the resistance area at an average price of $0.41 and subsequent close below (red circle).
This is considered a bearish sign since it means that the previous breakout was not legitimate.
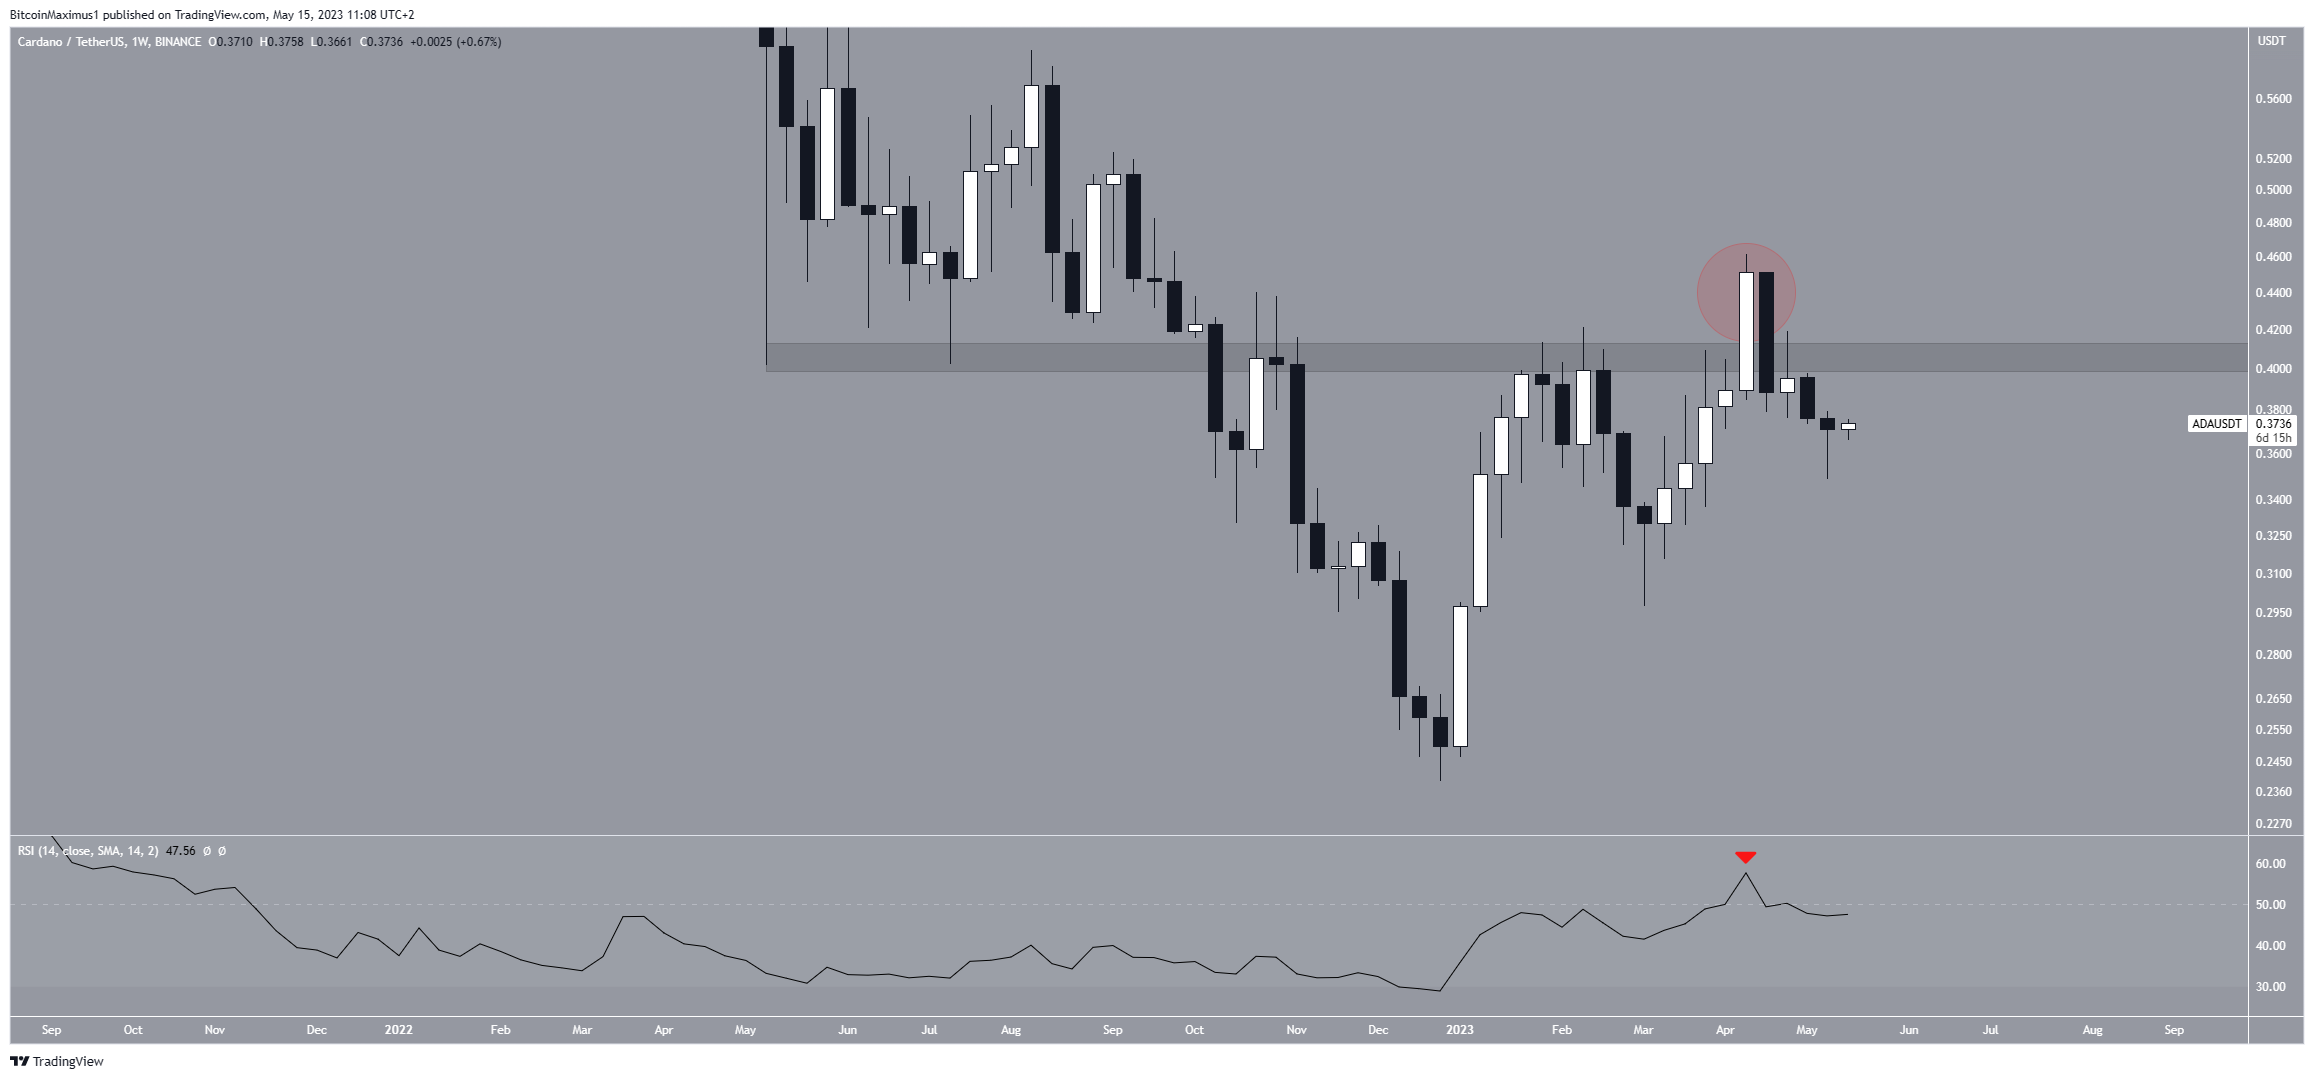
Additionally, this was combined with a failed RSI breakout above 50 (red icon). By using the RSI as a momentum indicator, traders can determine whether a market is overbought or oversold and decide whether to accumulate or sell an asset.
If the RSI reading is above 50 and the trend is upward, bulls have an advantage, but if the reading is below 50, the opposite is true. So, the current drop below 50 is a sign of a bearish trend.
ADA Price Prediction: Breakout or Breakdown?
The technical analysis from the six-hour time frame shows that the ADA price has been declining beneath a downward resistance line since April 15. This indicates a bearish trend until the price manages to break out.
Presently, ADA trades just above a convergence of support levels around $0.36. This support is formed by a horizontal support area and the 0.618 Fibonacci retracement support level.
The concept underlying Fibonacci retracement levels suggest that following a significant price movement in one direction, the price tends to partially retrace or return to a previous price level before continuing in its original direction.
The 0.618 Fibonacci level is particularly significant and frequently acts as a bottom point during corrective movements.
Currently, the price trades very close to the confluence between the resistance line and the $0.36 horizontal support area. Therefore, a decisive movement is expected to occur soon.
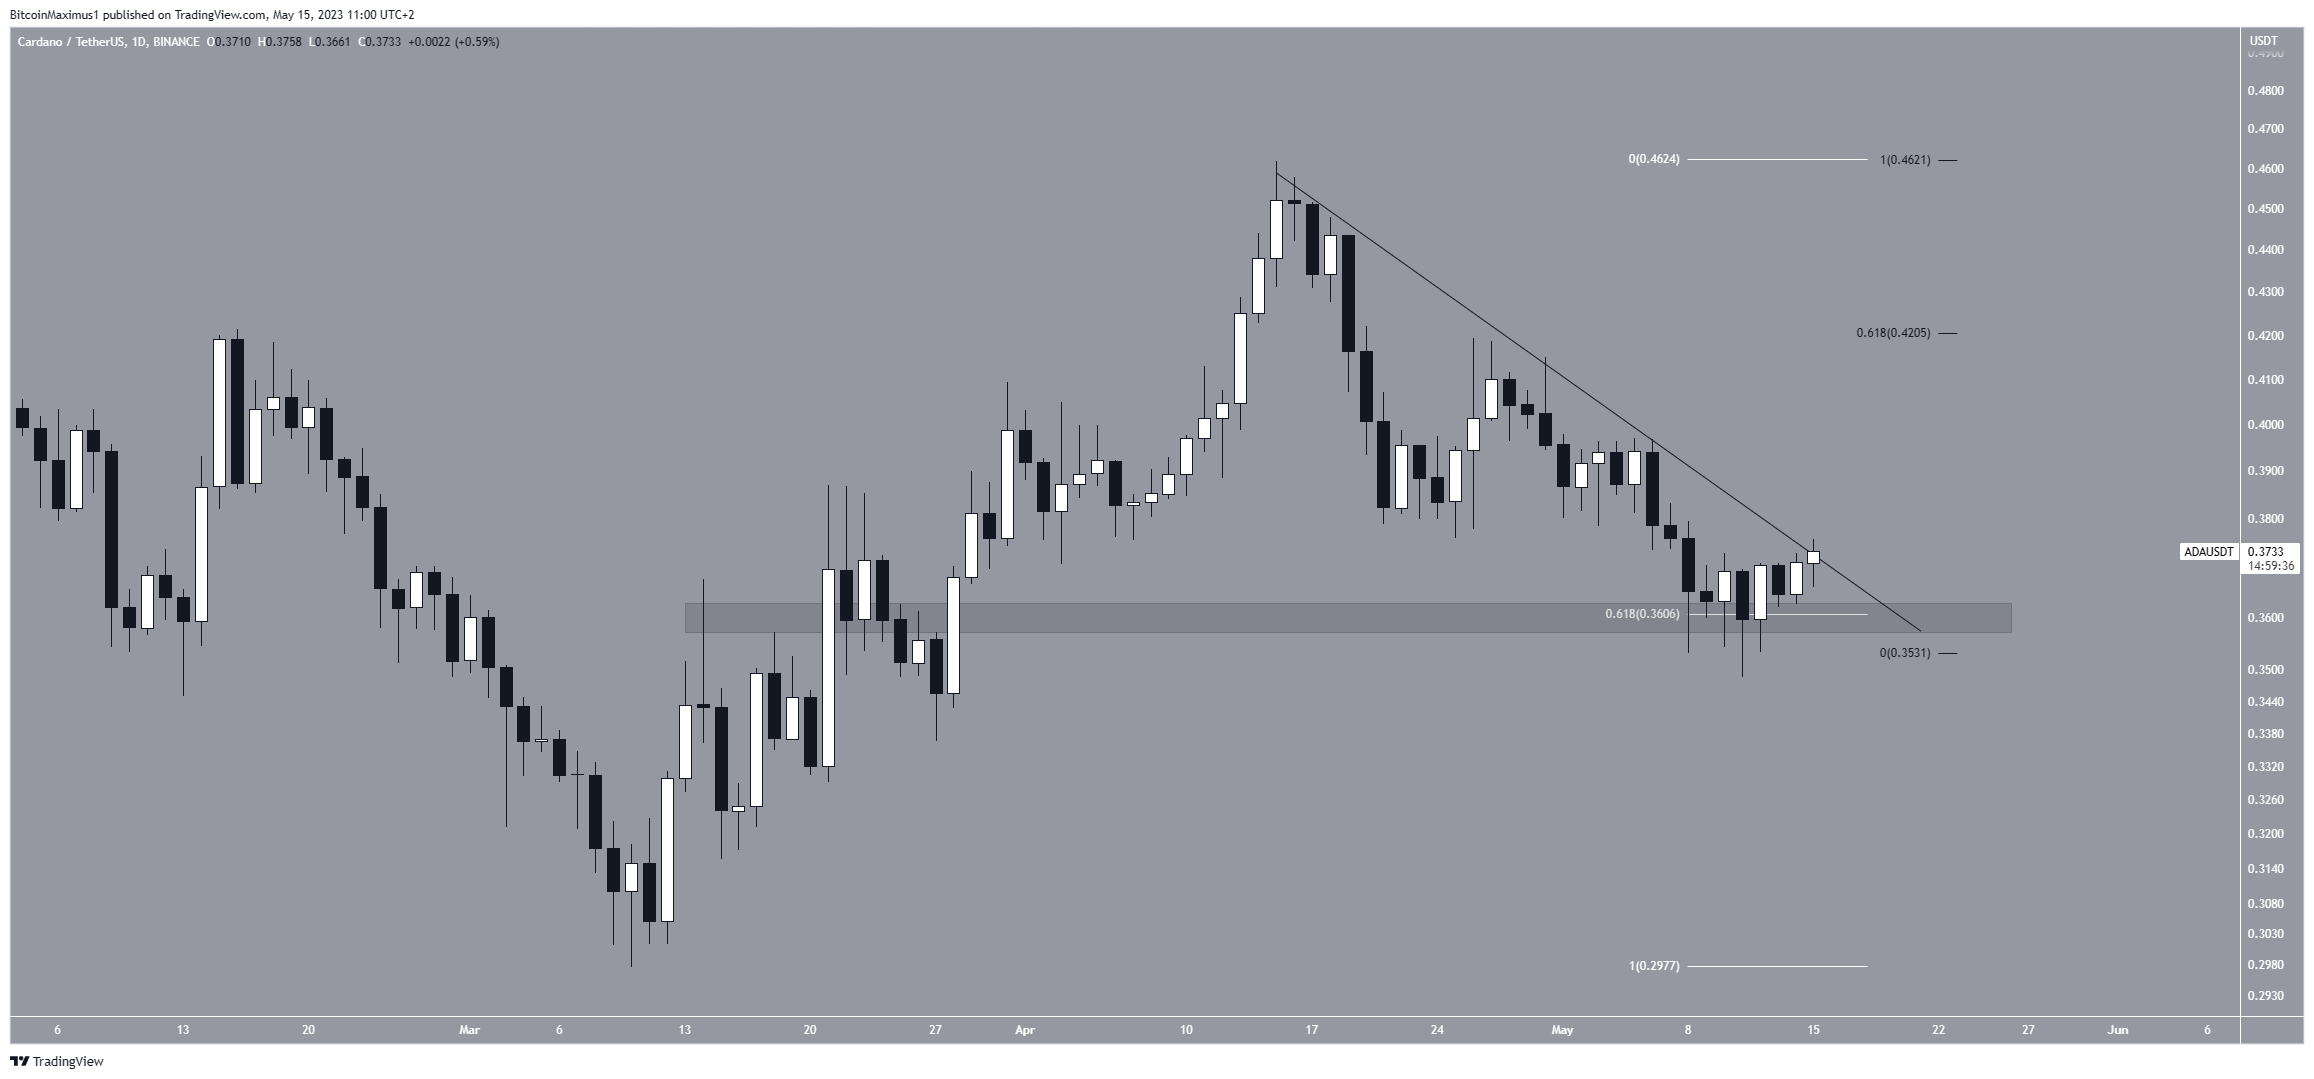
In case of a price breakout, ADA could move to the 0.618 Fib retracement level at $0.42.
However, a drop to $0.30 is expected if the price breaks down. Due to the lack of decisive signs in either direction, both a breakout and breakdown remain possible.
For BeInCrypto’s latest crypto market analysis, click here.


