


The Cardano (ADA) price is at risk of breaking down from a long-term ascending support line, something that could trigger a sharp fall.
The price action and indicator readings from different timeframes support the ongoing descent, increasing the likelihood that a breakdown will eventually occur.
Cardano Price Drops After Deviation
The weekly time frame technical analysis for ADA provides a bearish outlook. The main reason for this is the deviation above the long-term $0.40 resistance area and the subsequent decrease below it.
This is a bearish sign since it means that the breakout was illegitimate. Rather, sellers took over and pushed the price down.
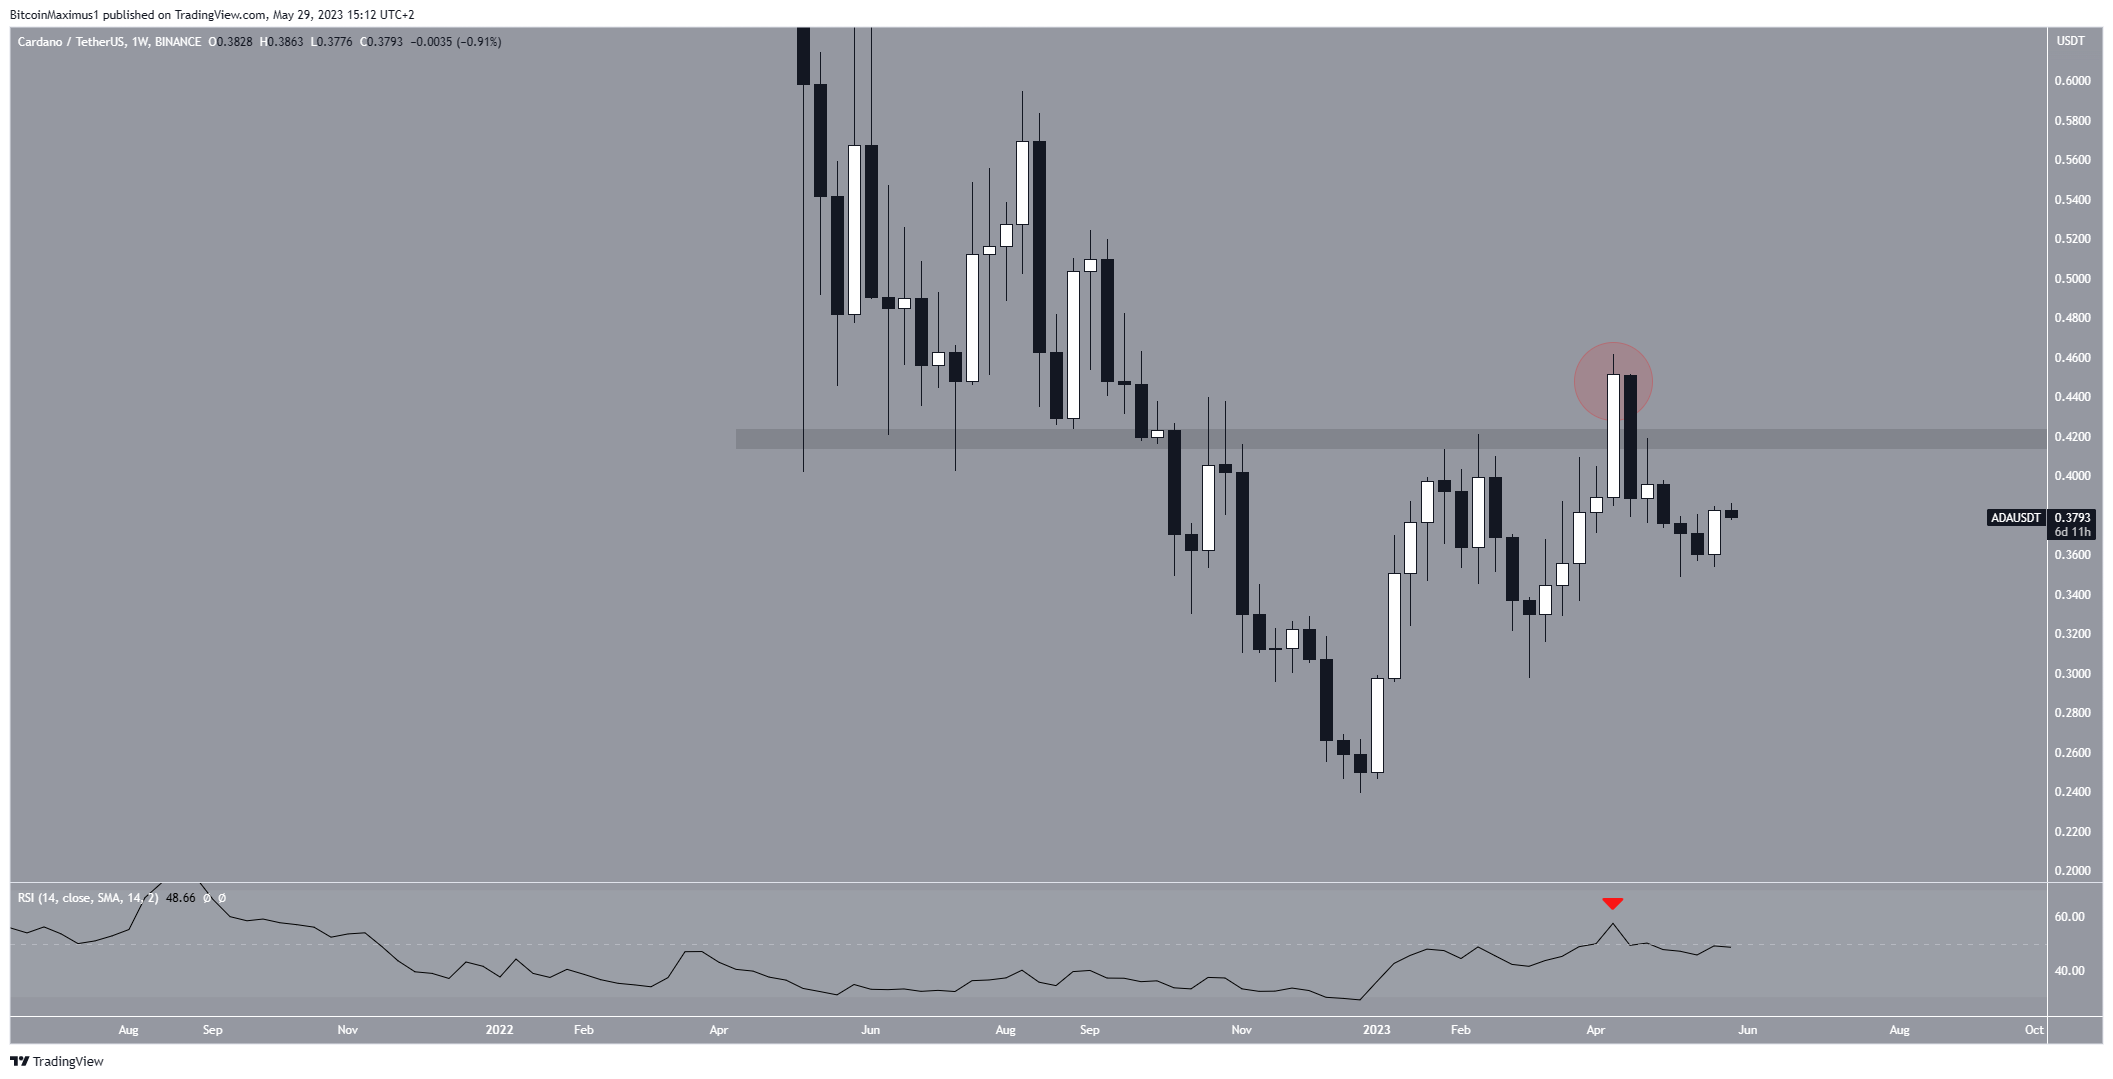
Additionally, the weekly Relative Strength Index (RSI) gives a bearish reading. Traders utilize the RSI as a momentum indicator to assess whether a market is overbought or oversold, and to determine whether to accumulate or sell an asset.
If the RSI reading is above 50 and the trend is upward, bulls still have an advantage, but if the reading is below 50, the opposite is true. The indicator is below 50 and decreasing, a sign of a bearish trend.
ADA Price Prediction: Will a Breakdown Occur?
The technical analysis from the shorter-term daily time frame aligns with the readings from the weekly one, thus providing a bearish ADA price prediction.
Currently, ADA bounced at ab ascending support line that has been in place for 152 days. However, the line has been touched four times so far. Since lines get weaker each time they are touched, an eventual breakdown seems likely.
Breakdowns from such long-term structures usually lead to significant downward movements. A daily close below the line will be required to confirm the breakdown.
This could be done in the next 24 hours. In that case, a decrease to the $0.30 horizontal support area will be likely.
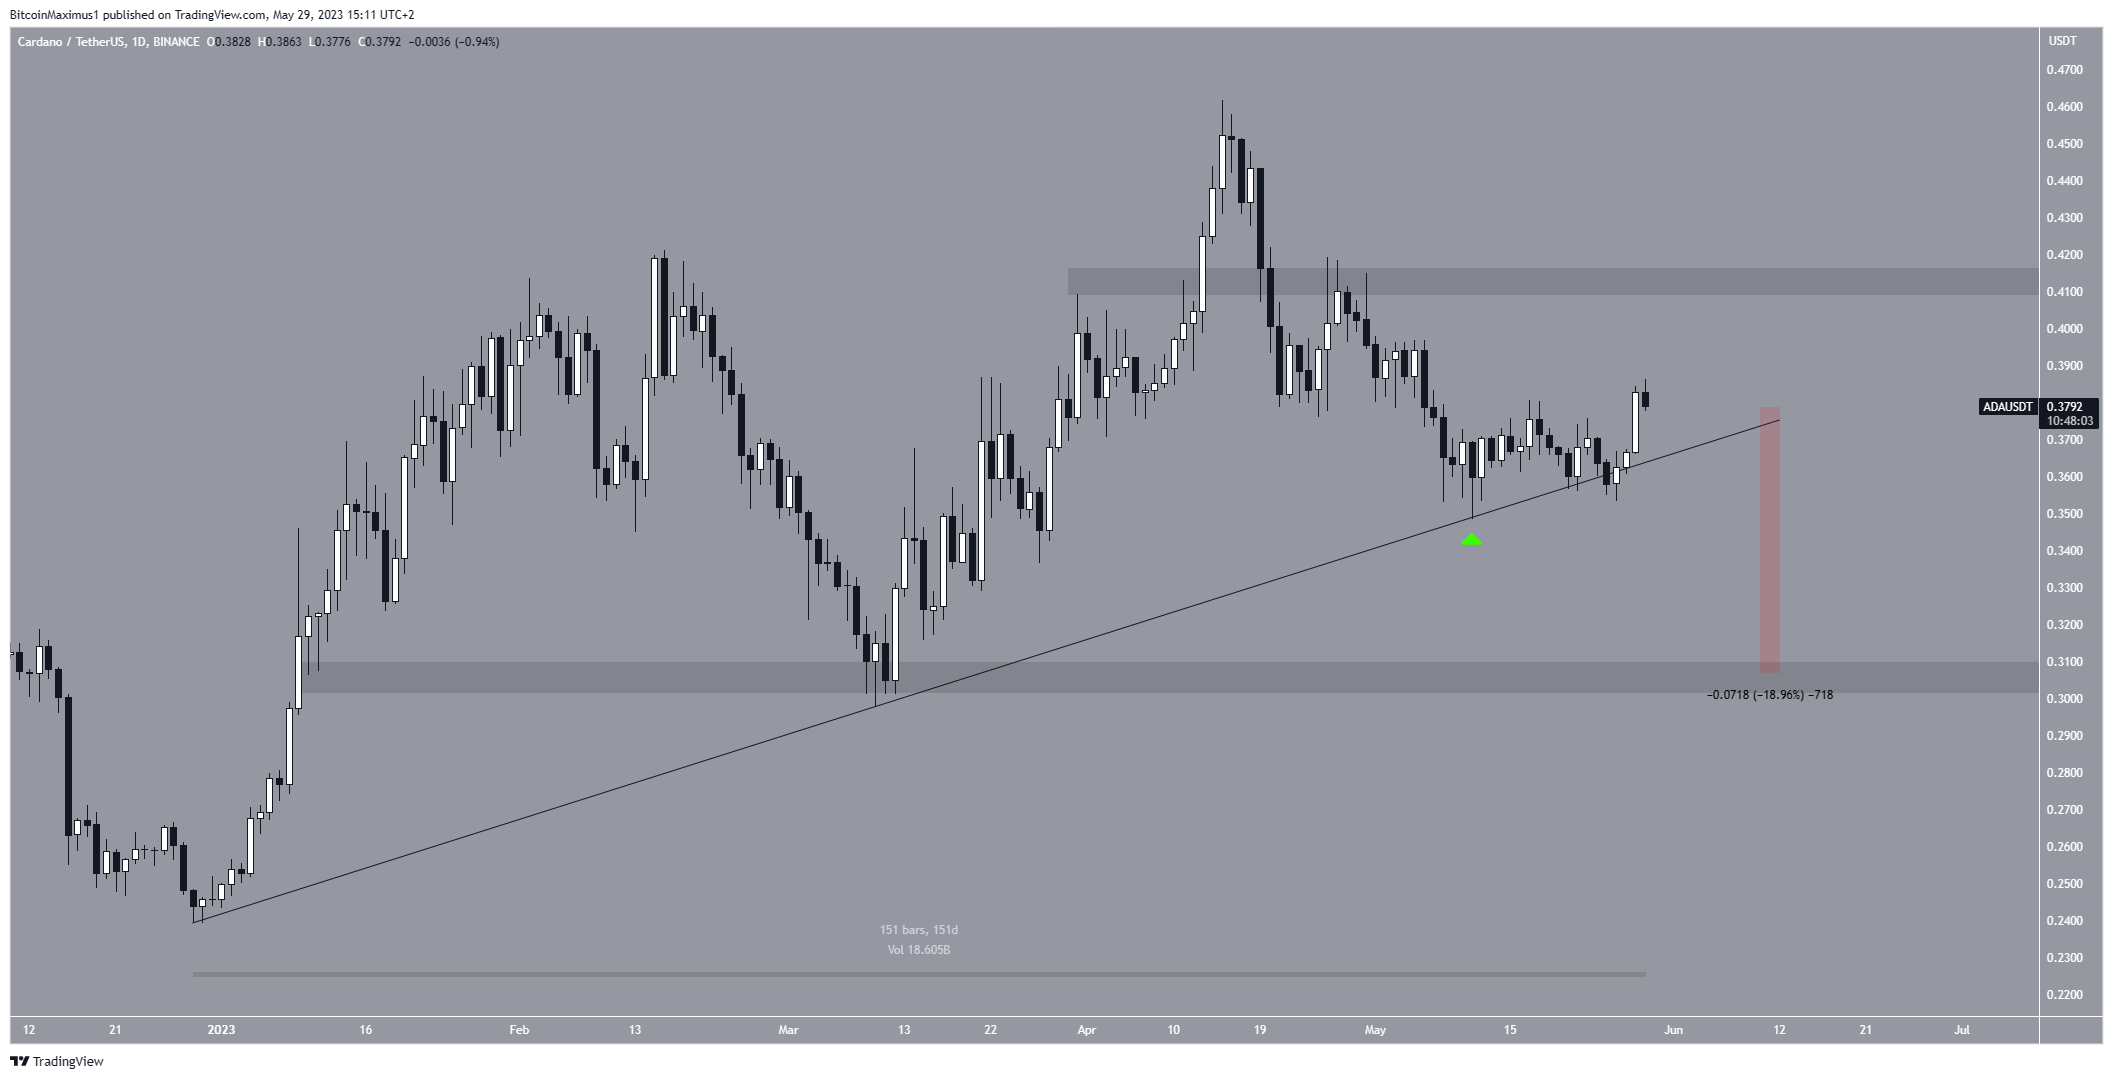
Despite this bearish ADA price prediction, the ongoing bounce could continue towards the $0.41 resistance area. If the price closes above it, it will invalidate the bearish prediction and likely initiate a sharp increase to $0.50.
However, a rejection from the area will mean that the trend is still bearish.
For BeInCrypto’s latest crypto market analysis, click here.


