The Cardano (ADA) price has been increasing since the beginning of April. However, the upward move has begun to show signs of weakness, forewarning that a top might be within reach.
Long-Term Outlook
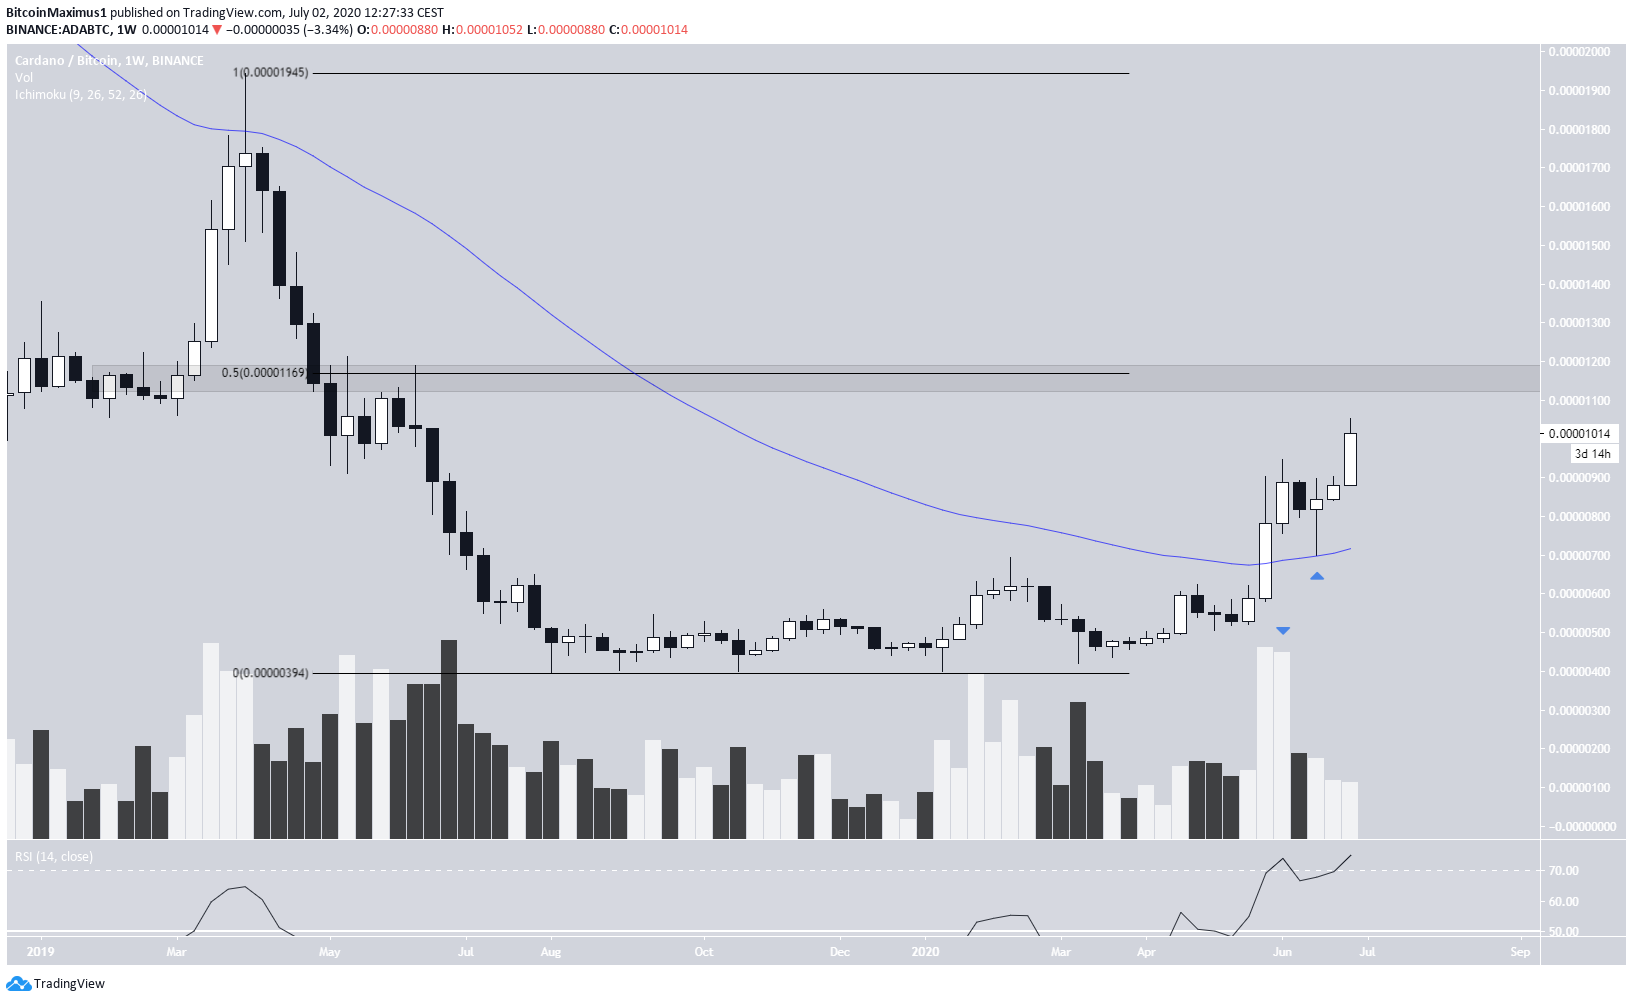
The ADA price was consolidating near 500 satoshis in the period from August 2019 to April 2020. The price initiated an upward move on April 28 and has been increasing at an accelerated rate since. It moved above the 50-week moving average (MA) and validated it as support during the week of June 15.
The closest resistance area is found at 1170 satoshis, which is the 0.5 Fib level of the entire decline, beginning in April 2019. While it seems likely that the price will rally there, it’s unclear whether the price will successfully break out.
Volume has picked up considerably during the beginning of the upward move, and there isn’t any bearish divergence yet on the RSI,
Wave Count
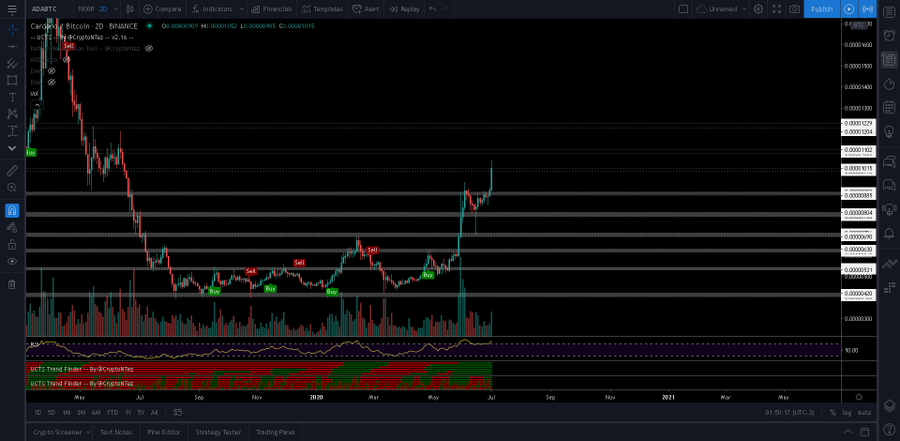
Cryptocurrency trader @CryptoNTez states that ADA could continue increasing towards 1100-1200 satoshis. This is the same resistance area we outlined in the previous section.
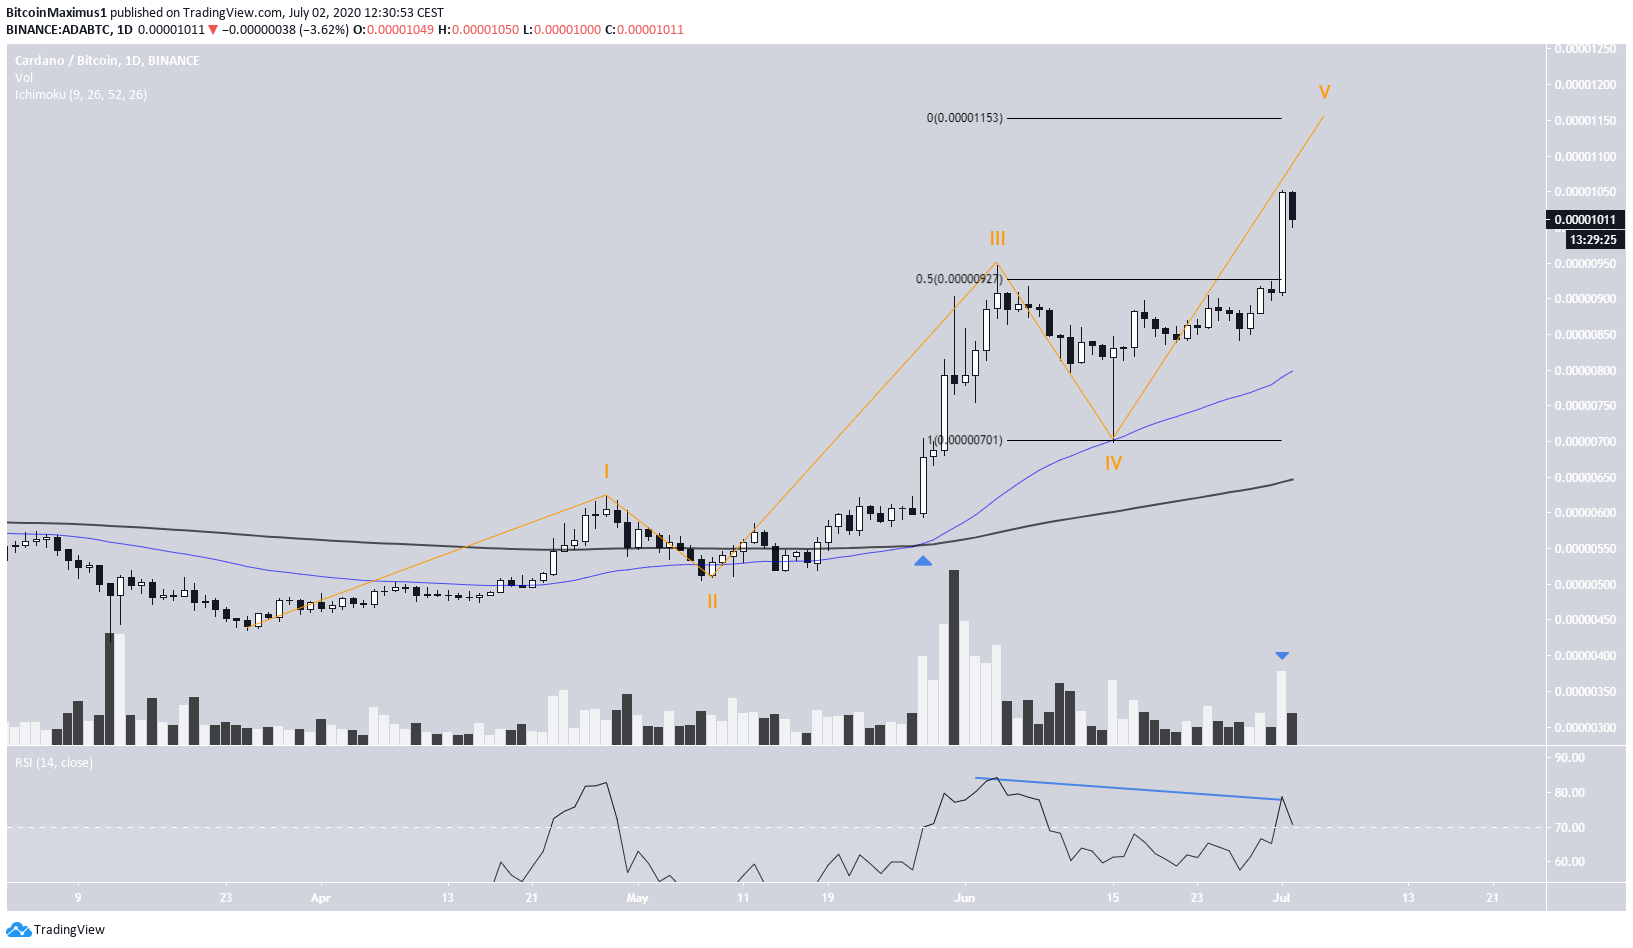
Indeed, a very similar target is found when outlining a five-wave Elliott formation from the start of the move. Equating the height of waves 3 and 5 here is relatively standard.
Even though the 50 and 200-day MAs have already made a bullish cross and the price is trading above them, there is considerable bearish divergence on the RSI, a sign that the move might be coming to an end.
The fact that it is losing steam is especially noticeable during yesterday’s bullish belt hold candlestick, which took place with much smaller volume than the several preceding bullish candlesticks.
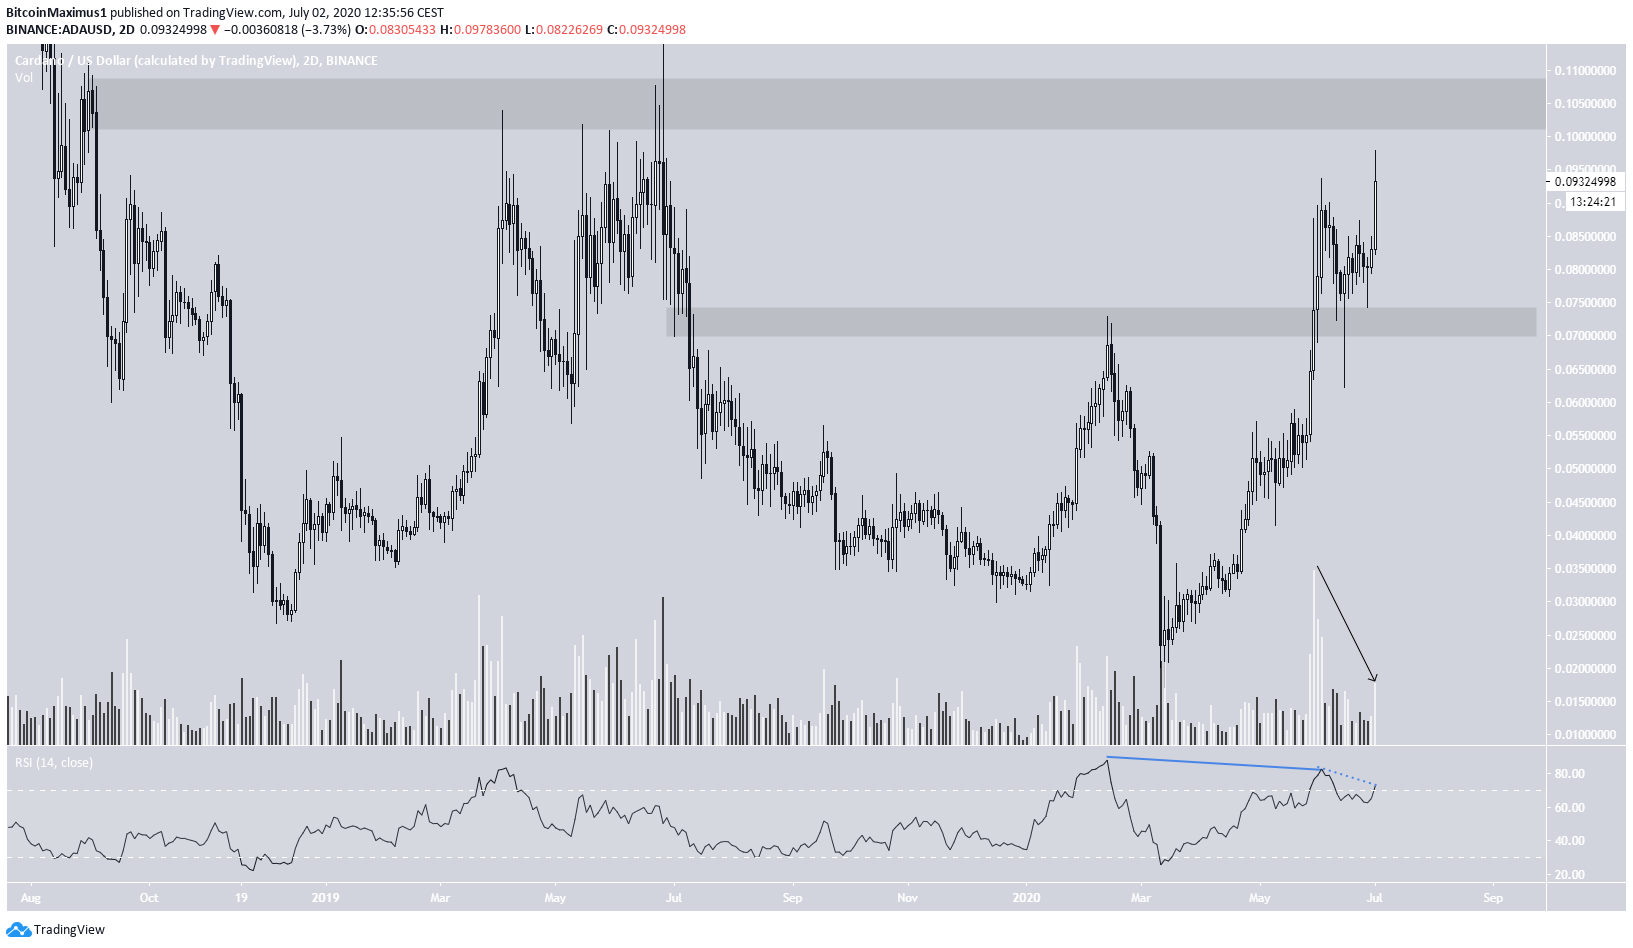
ADA/USD
A look at the ADA/USD pair reveals that the price is trading between resistance and support at $0.105 and $0.072, respectively.
Technical readings are very similar to those for the ADA/BTC pair. Volume has been considerably lower during yesterday’s increase, and there is considerable bearish divergence on different time-frames of the RSI.
Therefore, while the price could potentially reach the resistance area, a breakout does not seem very likely, at least not on the first try.