


The ADA price has broken out above an ascending triangle it had been trading in over the past seven months. We believe the breakout will continue, allowing the price to possibly reach the previous breakdown level at 1000 satoshis.
ADA Highlights
- The ADA price is trading inside an ascending triangle.
- The 100- and 200-day moving averages (MA) have made a bullish cross.
- There is resistance at 780 and 1000 satoshis.
Well-known trader @devchart outlined the recent ADA breakout, stating that the price has increased by 7% since the previous breakout alert.
https://twitter.com/devchart/status/1222076536804859911
Will ADA continue to increase? If so, where will it go? Continue reading below if you are interested in finding out.
Ascending Triangle
The ADA price has been trading inside an ascending triangle, which is considered a bullish pattern since August 2019. The price has validated the resistance and support lines several times, increasing the significance of the pattern.
On January 28, the price broke out above the resistance line of the triangle. However, the daily candle has yet to close, and volume has not been very significant, allowing for the possibility that the price creates a long upper wick and decrease.
But, due to the extreme length of the wick, we think this is unlikely. Also, the 100- and 200-day moving averages (MA) have just made a bullish cross, and indication that a bullish market cycle has begun.
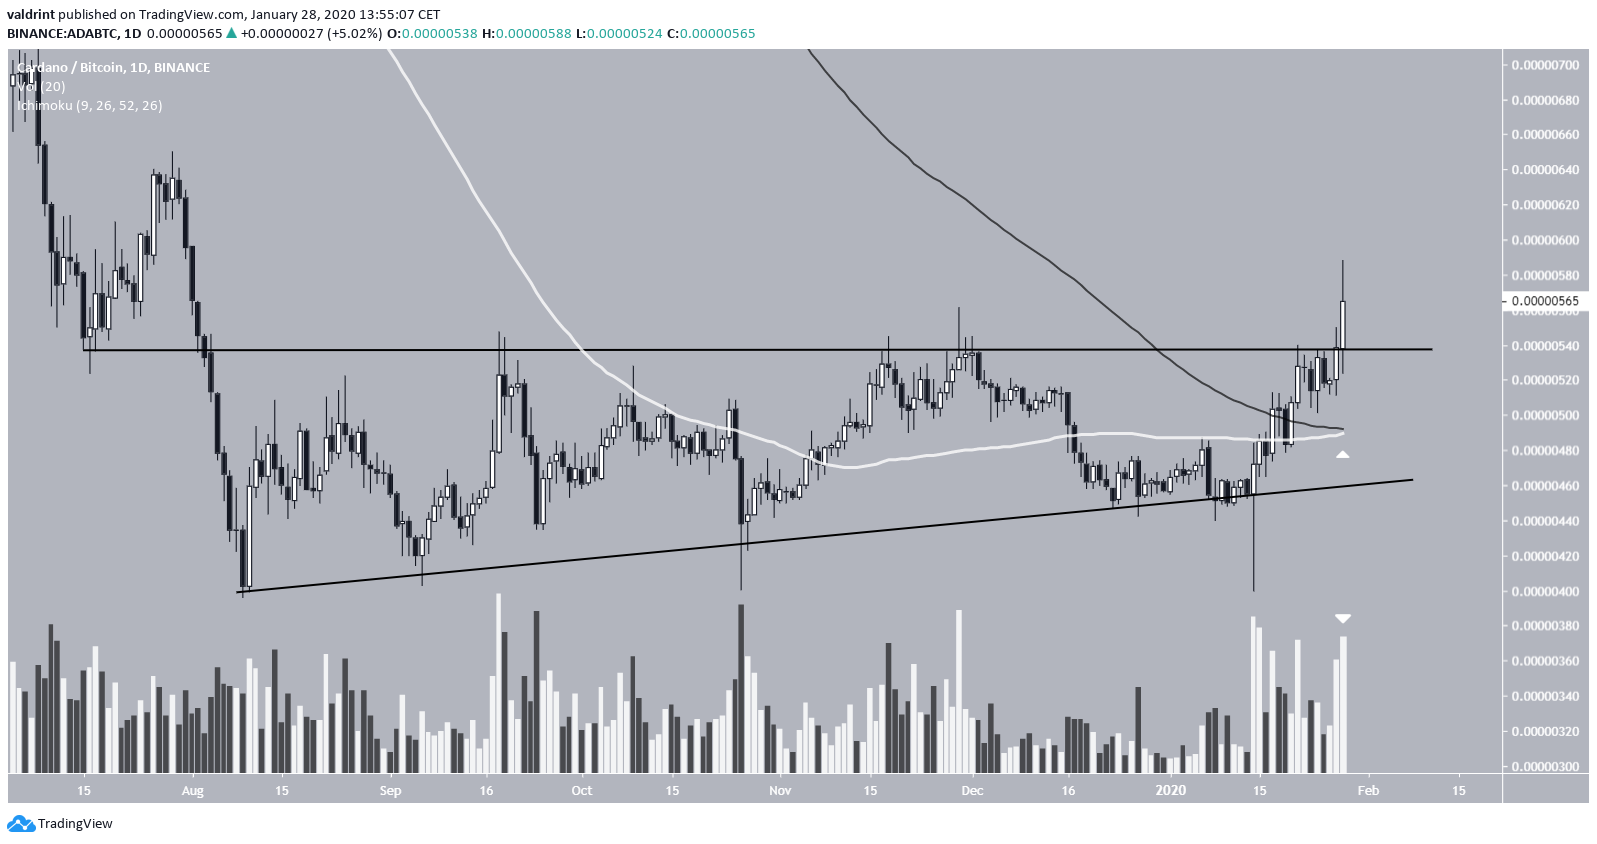
We successfully predicted this breakout in our previous analysis.
Future Movement
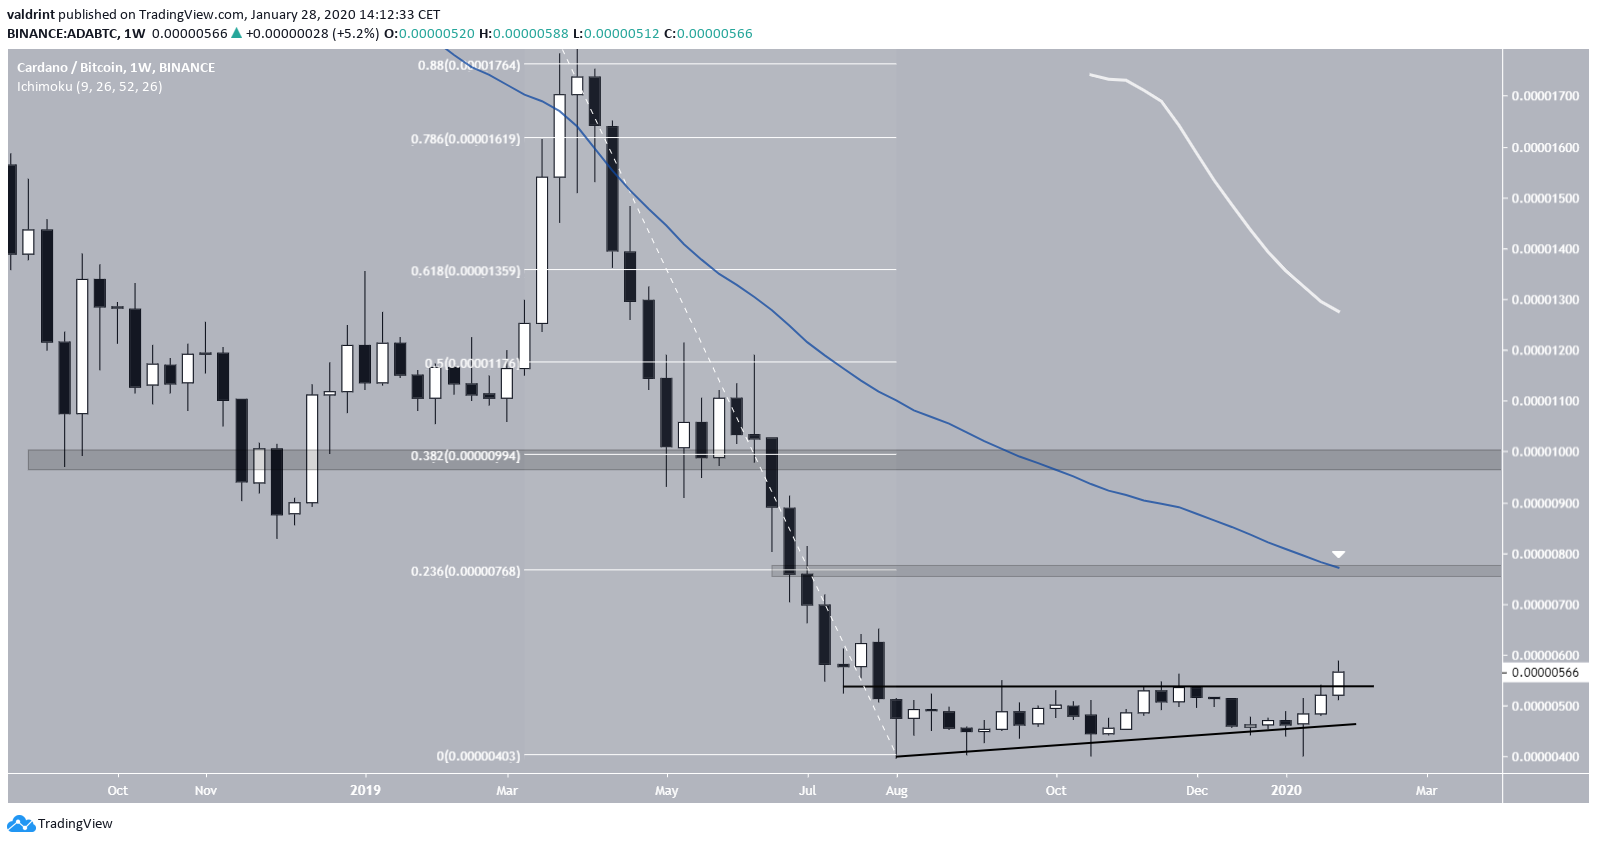
Looking at the weekly chart, the closest resistance areas are found at 780 and 1000 satoshis, the 0.236 and 0.382 fib level of the previous decrease, beginning in April 2019.
The presence of the 50-week MA strengthens the 780 satoshi resistance area. In contrast, the 1000 satoshi area is especially important, since it acts as the previous breakdown level, after which the rate of decrease greatly accelerated.
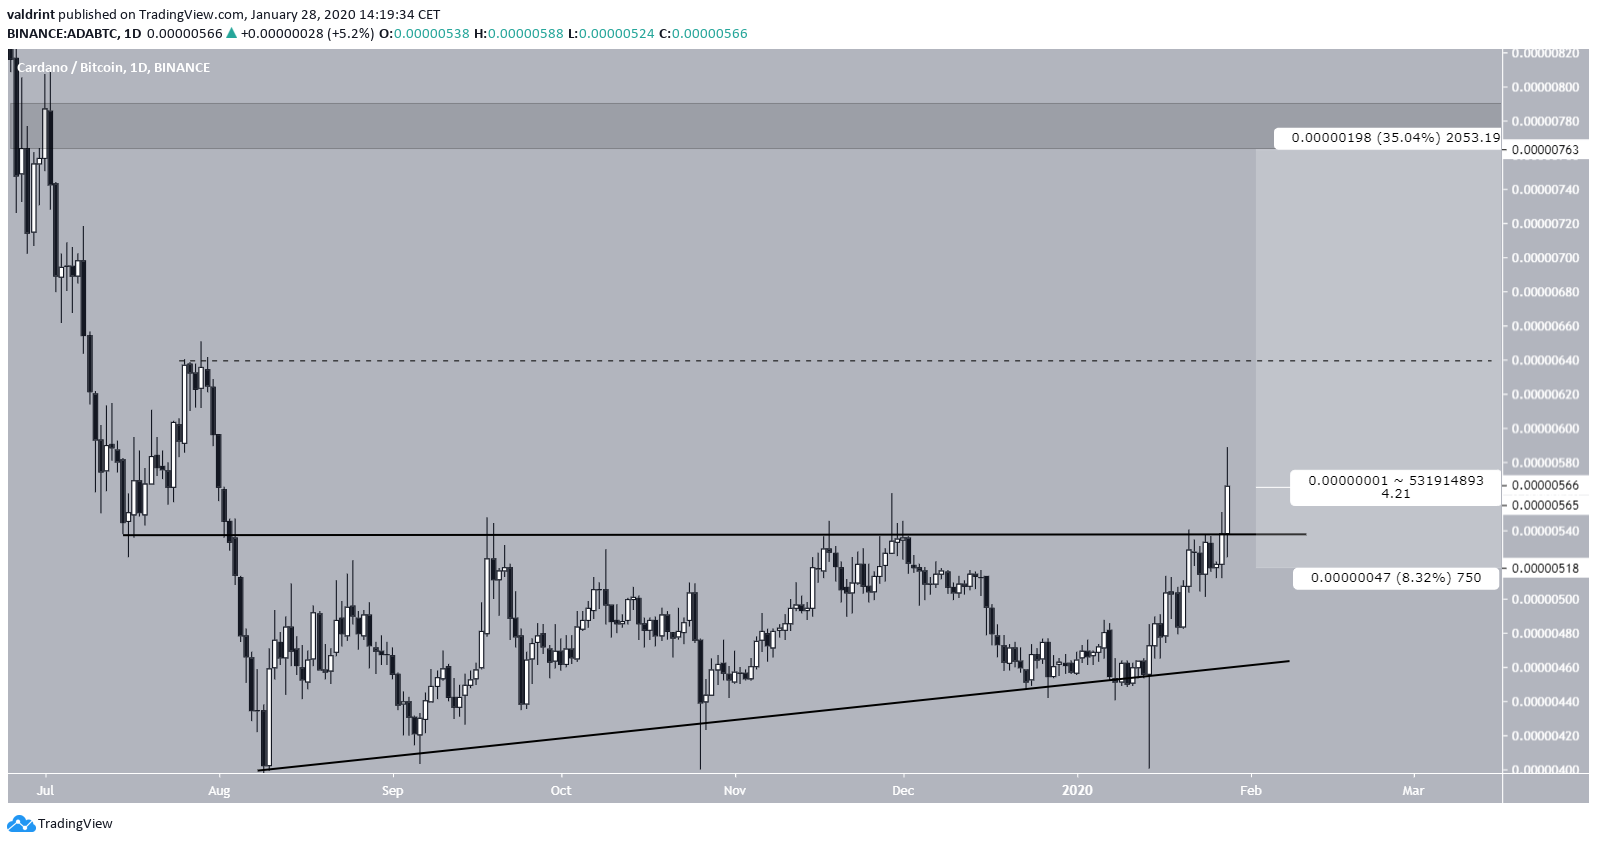
The daily chart suggests that the 780 satoshi resistance area is definitely valid as not only does it serve as a significant fib level, but the price actually reversed once it got there. In addition, the price could face some minor resistance at 640 satoshis.
The current price level is not very far from the resistance line of the triangle. Therefore, initiating a long with an average entry of 565 satoshis and a stop loss below the opening of the previous candle at 518 satoshis gives it a 4.21 risk/reward ratio with a target of 760 satoshis.
To conclude, the ADA price broke out from an ascending triangle it had been trading in since August. The breakout seems legitimate, and we expect the price to continue increasing until it reaches at least one of the resistance areas outlined above.


