
While the NEO price has increased considerably since its March 2020 low, it’s not even close to reaching its all-time high.
NEO is unlike Bitcoin (BTC) and numerous other cryptocurrencies, which are pushing their limits. This article will compare the previous market cycles and see how the current ongoing upward movement compares.
NEO’s First Rally
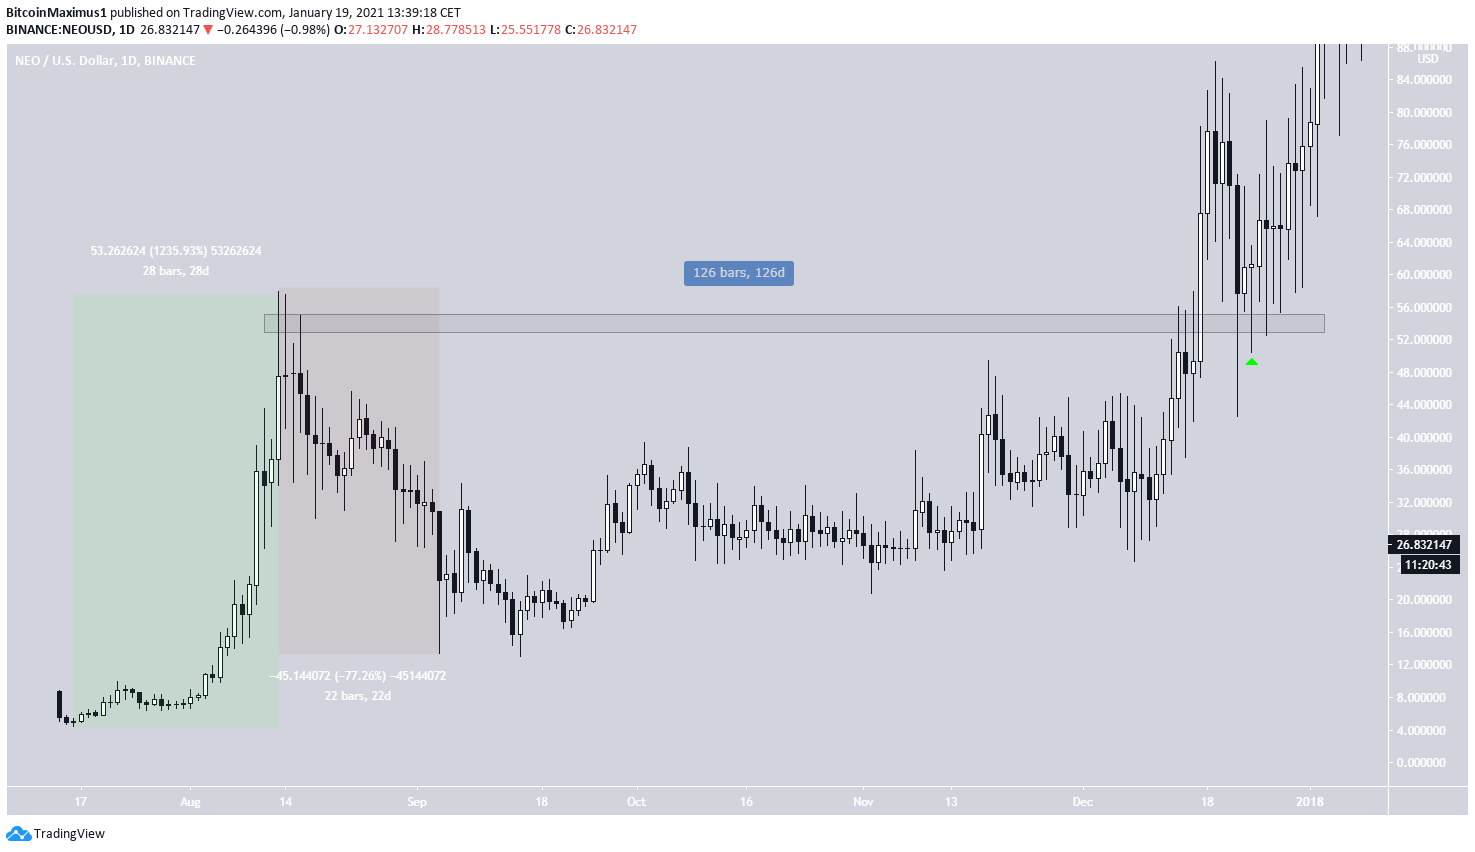
The first rally began on July 16, 2017, when NEO was trading at a low of $4.48. The ensuing upward move took place over 128 days and led to a then all-time high (ATH) of $57.88 on Aug. 13. This amounted to an increase of 1,235%.
Afterward, NEO corrected by 77% over 22 days, dropping to a low of $13.47 and creating its first higher low in the process.
NEO managed to break out above the then all-time high resistance area after 126 days. It subsequently validated it as support on Dec. 24 (shown with the green arrow in the image below) and increased rapidly to reach the current all-time high.
New All-Time High and Correction
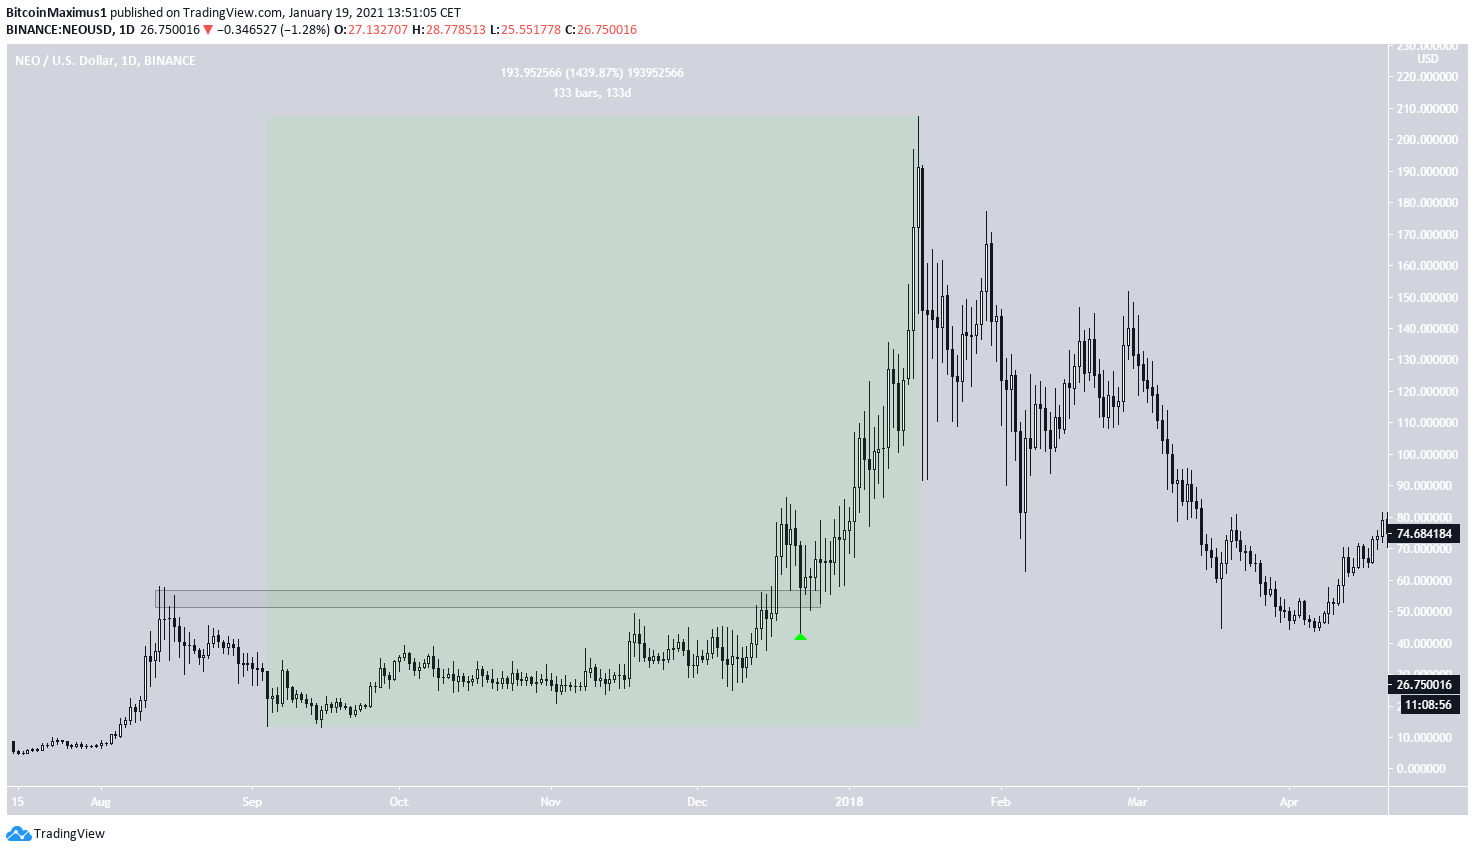
NEOs second rally occurred over a longer period of time, more specifically 133 days, and measured an increase of 1439%.
On Jan. 15, 2018, it reached an ATH of $207.42, which still stands.
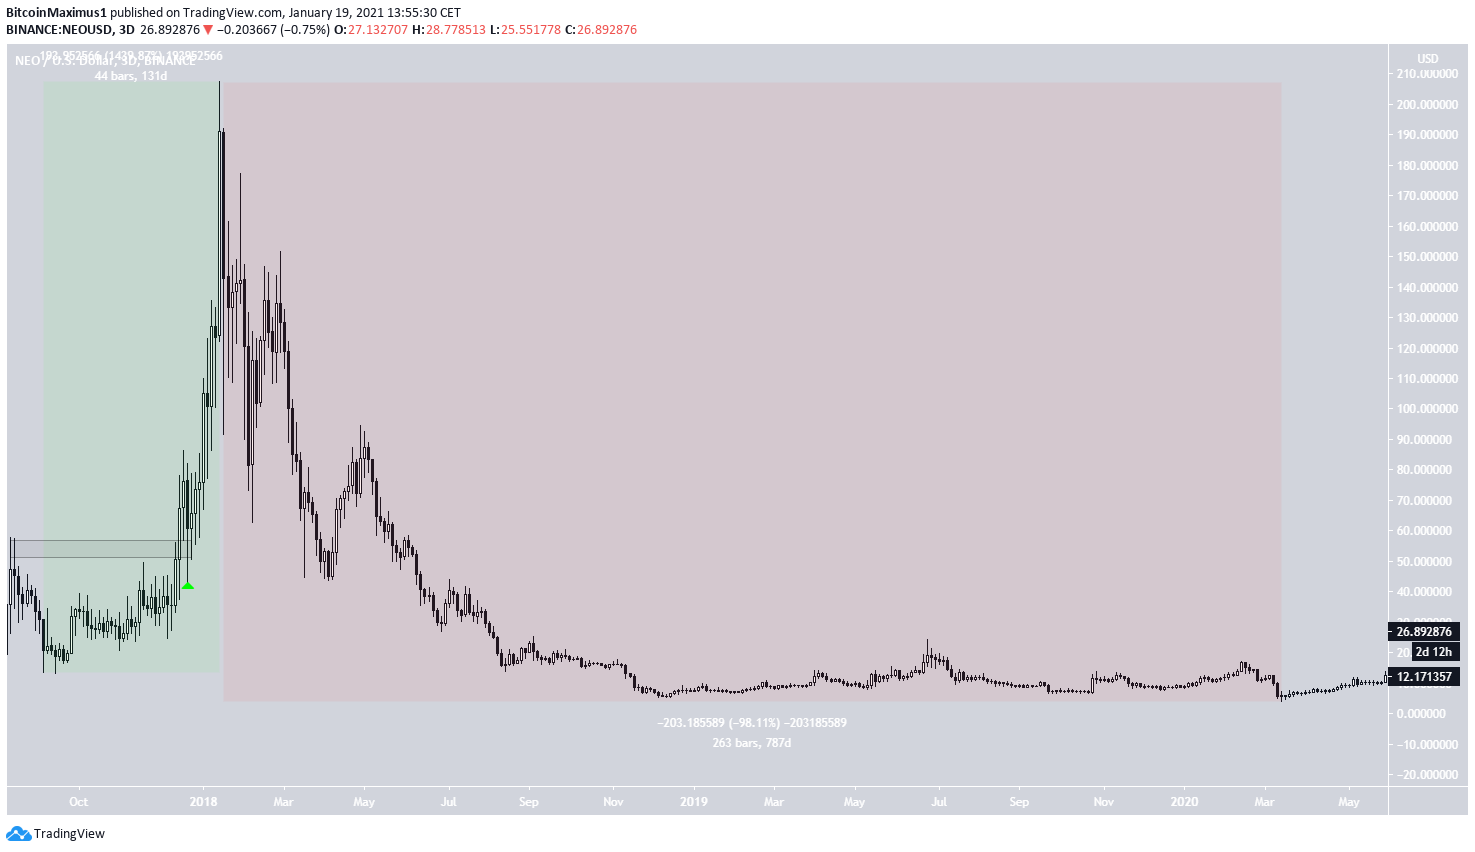
Nevertheless, the ensuing decline was likewise more significant. After reaching the previous $207.42 high, NEO began a 787-day downward trend that eventually led to a low of $3.92 on March 13, an all-time low price. This amounted to a drop of over 98%.
The length of the correction was considerably more than that of both preceding upward moves combined.
The movement is dissimilar to that of other alts, specifically Ethereum (ETH), which has yet to re-test its original ATH, let alone reach a new all-time low price.
Current Movement
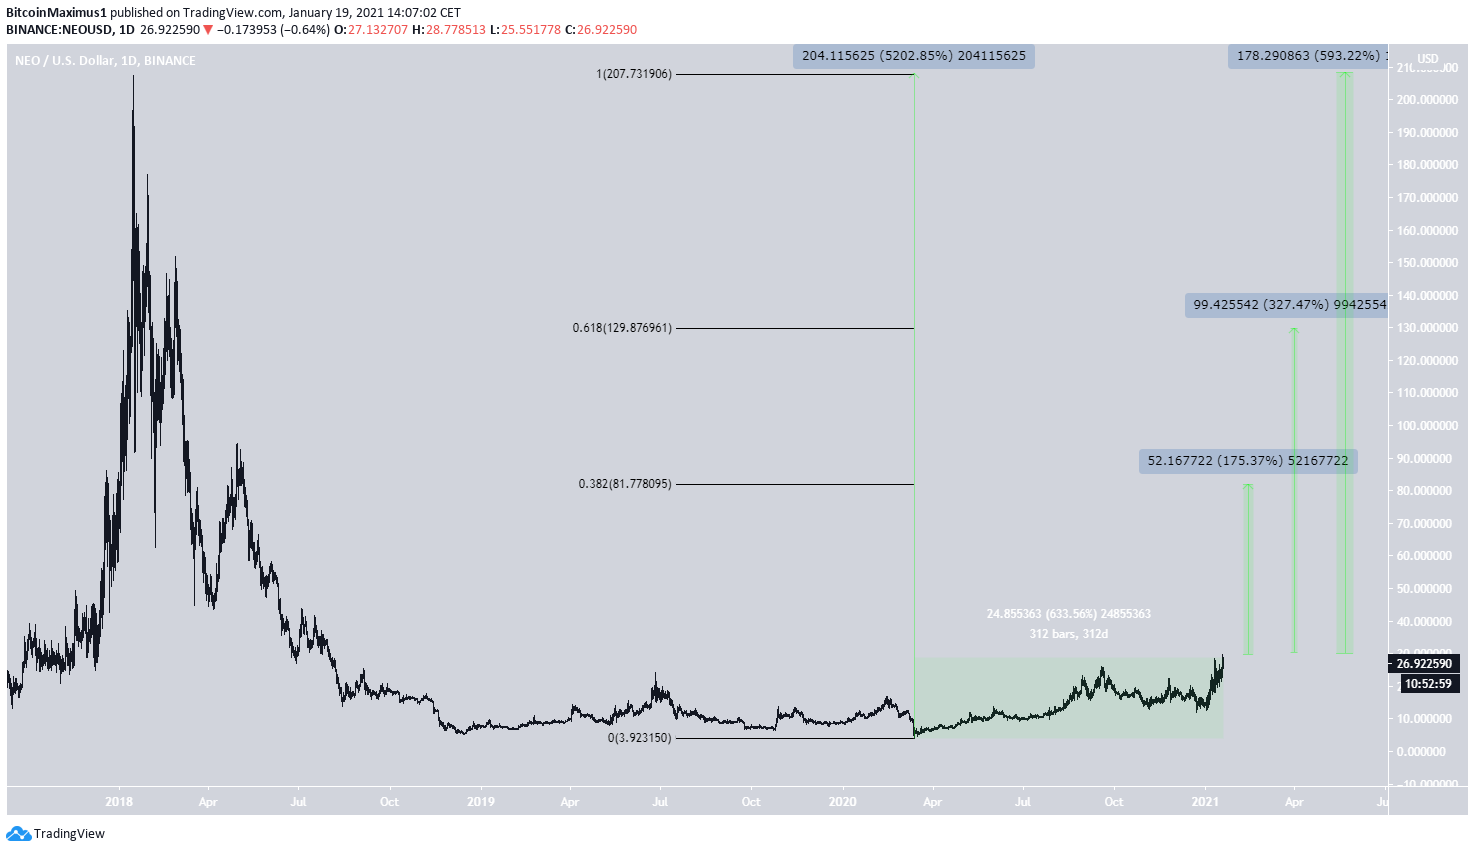
Be that as it may, NEO has been moving upwards since the March 2020 low, increasing by 633% in the 312 days since then.
However, if NEO is to reach a new ATH, the current rally needs to be bigger than the preceding ones. Measuring from the March low, an increase of 5,200% is necessary to reach a new ATH price.
Measuring from the current price, an increase that reaches the 0.382 and 0.618 Fib retracement levels would measure 175% and 327%, respectively, suggesting that the potential for gains is still high even if NEO were not to reach a new ATH price.
For BeInCrypto’s latest Bitcoin (BTC) analysis, click here!
