Binance Coin (BNB) has increased considerably since March 2020 and proceeded to reach a new all-time high price on Feb. 4, 2021.
Binance Coin is currently in its third market cycle. This article will compare previous market cycles and examine how the current cycle compares in terms of rate of increase and length.
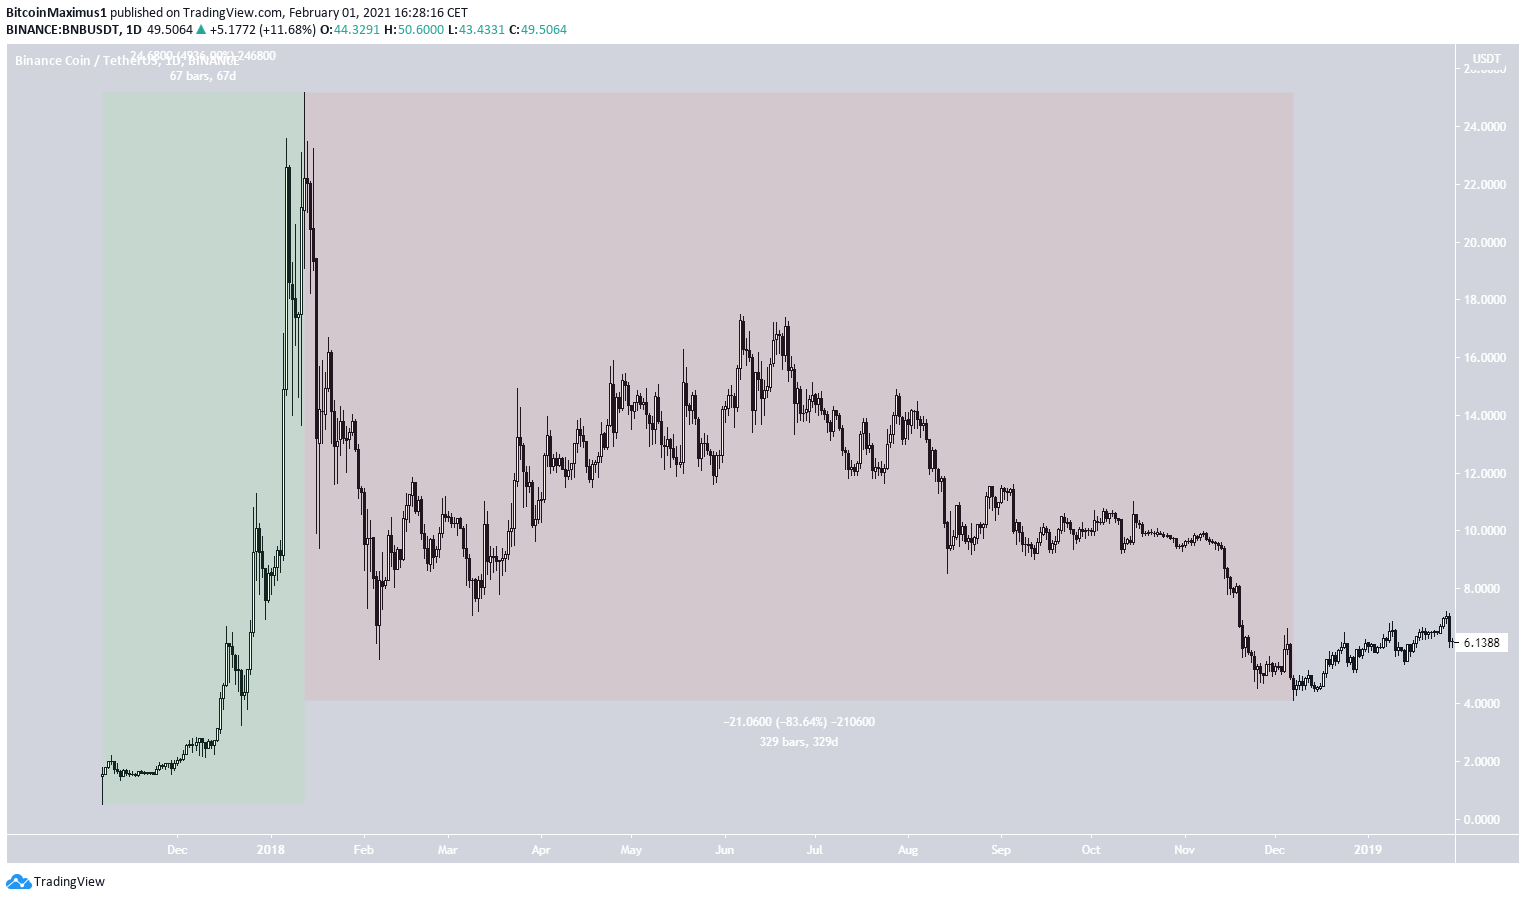
First Binance Coin Cycle
The first market cycle for BNB began with a low of $0.50 on Nov. 17, 2017. BNB followed that up by increasing a massive 4,936% in only 67 days. This culminated with a high of $25.18, which was reached on Jan. 12, 2017. This level remained BNB’s all-time high until April 2019.
After the high was reached, BNB decreased by 84% over 329 days. This is a significant correction, but it was more gradual than the preceding upward move.
BNB move downwards until a low of $4.12 was reached on Dec. 7, 2018. After this, BNB began its second cycle.
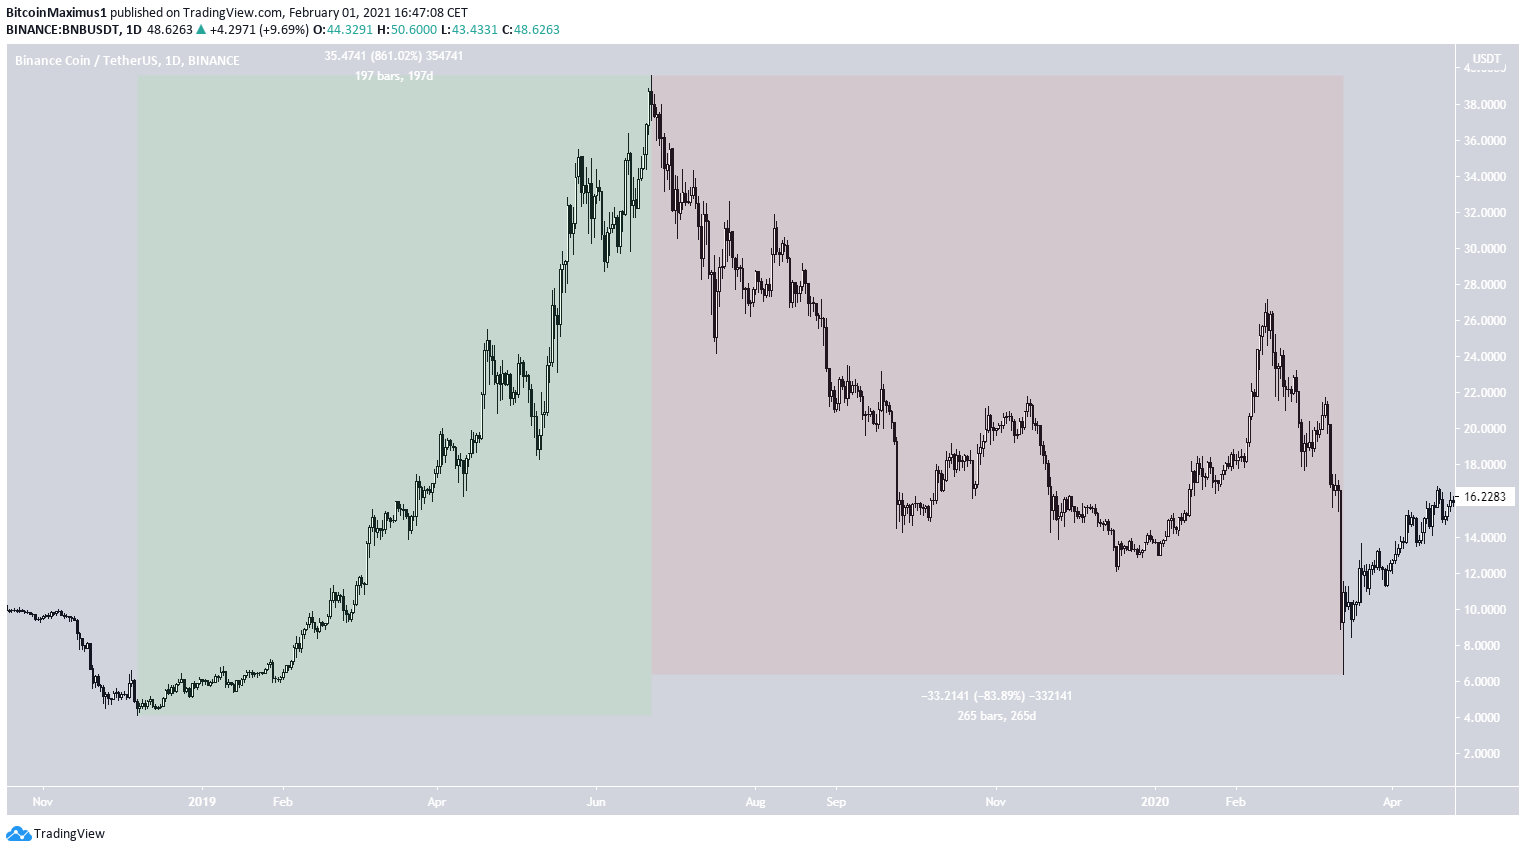
Second Cycle
The second cycle was much more gradual than the first.
BNB increased by 861% over a period of 197 days, culminating with an all-time high price of $39.59 on June 22, 2019. This all-time high remained until Dec. 2020.
It’s interesting to note that once BNB broke its previous all-time high, it dropped significantly before eventually regaining its losses.
Unlike the upward move, the ensuing correction was much more similar to the first. BNB decreased by 84% over 265 days in this correction.
After reaching a low of $6.30 on March 13, 2020 — very close to the previous low of $4.12 — BNB began its third and current market cycle.
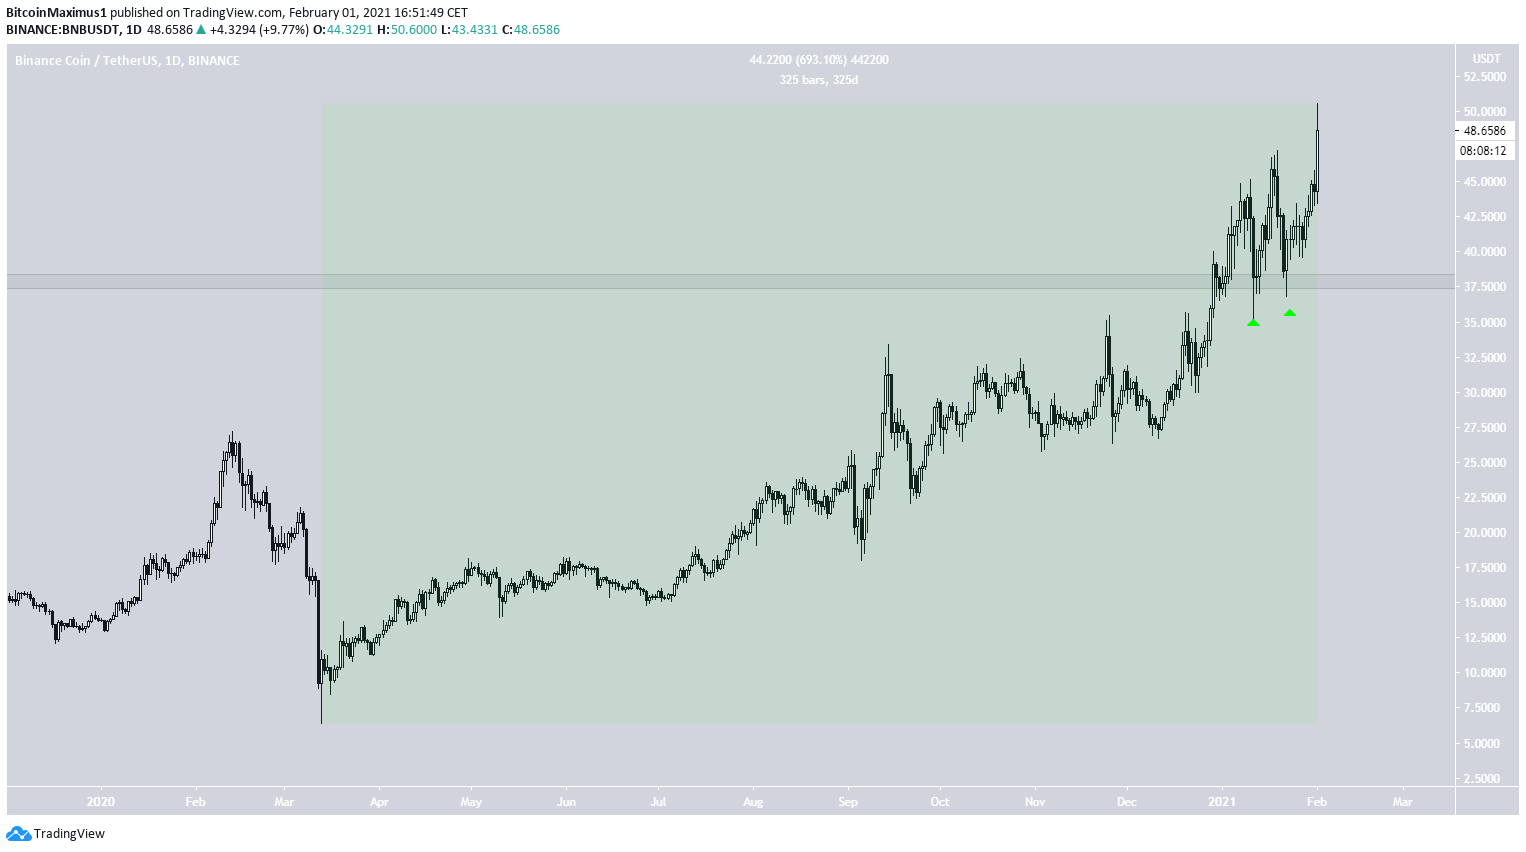
Third Cycle
The third market cycle began with the aforementioned Mar. 13 low and is still ongoing.
So far, BNB has increased by 693% in the days since, without undergoing a significant retracement.
Once it broke out above the previous all-time high, BNB returned to validate it as support twice and has been moving upwards since.
This is unlike the previous all-time high breakout, after which BNB decreased considerably. Therefore, if the current support area holds, BNB would be expected to increase at an accelerated rate.
So far, BNB has reached a new all-time high price of $55.40 on Feb. 4.
An increase of 869%, similar to the second market cycle, would take BNB to $62. A move of 4,936% like the first market cycle would take it to $320.