


![A BAT Reversal Could Take Place Soon [Premium Analysis]](/_mfes/post/_next/image/?url=https%3A%2F%2Fassets.beincrypto.com%2Fimg%2F52ydbzvlCSdZTtfZyha7ZoLy2eU%3D%2Fsmart%2F8a94b2a8260045ec80f4ac340f518535&w=1920&q=75)
The BAT price has decreased by 30% since Nov 18. It has now reached a support area which looks expected to initiate a reversal.
The BAT price began an uptrend on Sept 6, more than doubling its value in a little more than a month. However, it twice failed to break out above the resistance area at 3,200 satoshis and began the currently ongoing correction.
Cryptocurrency trader @thecryptocactus stated that the BAT price was rejected by the current resistance area and is in the process of retracing towards support at 2,300 satoshis. If this support area fails, BAT could be heading towards new all-time lows.
$BAT Update
Clearly rejected from this 3000 region and now seeing a major pullback to retest our strong 2300 level which has been a strong level for buyers in the past…
Crucial for this level to hold on the weekly otherwise we could see a retrace back to all-time lows. pic.twitter.com/W4tEMOQduc
— Cactus (@thecryptocactus) December 22, 2019
BAT Trading Areas
The BAT price had been increasing since Sept 6, more than doubling its value in slightly more than a month. The Sept 6 low came in at 1,572 satoshis while the Oct 18 high reached 4,473 satoshis.
The price made a double-top inside the 3,200 satoshi resistance area between Oct 18 and Nov 18 and has been decreasing ever since.
There are two main support areas, found at 2,250 and 2,050 satoshis respectively. The price is currently trading inside the former, which also coincides with the 0.618 fib level of the entire upward move.
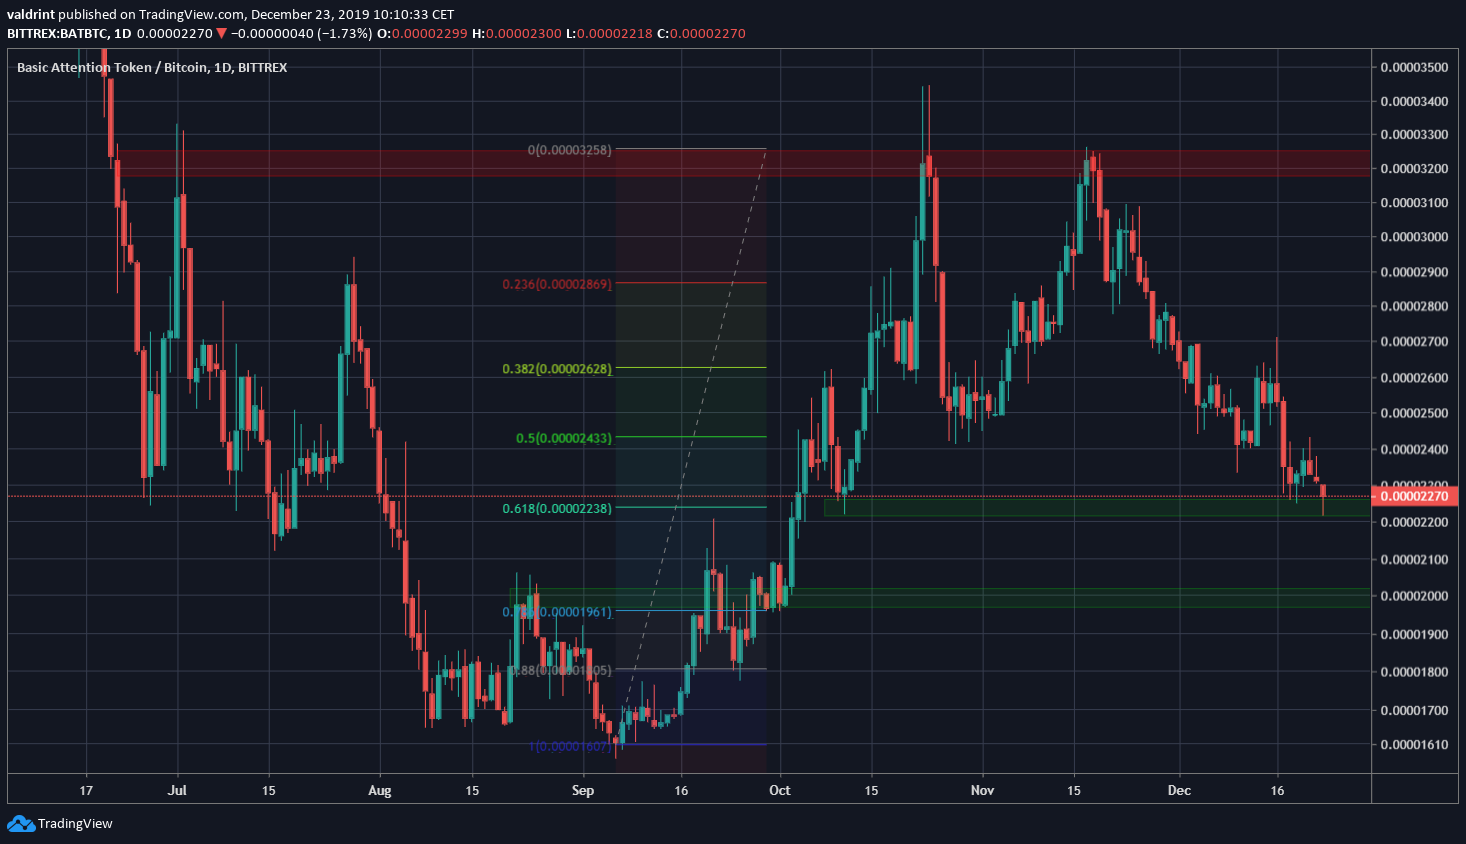
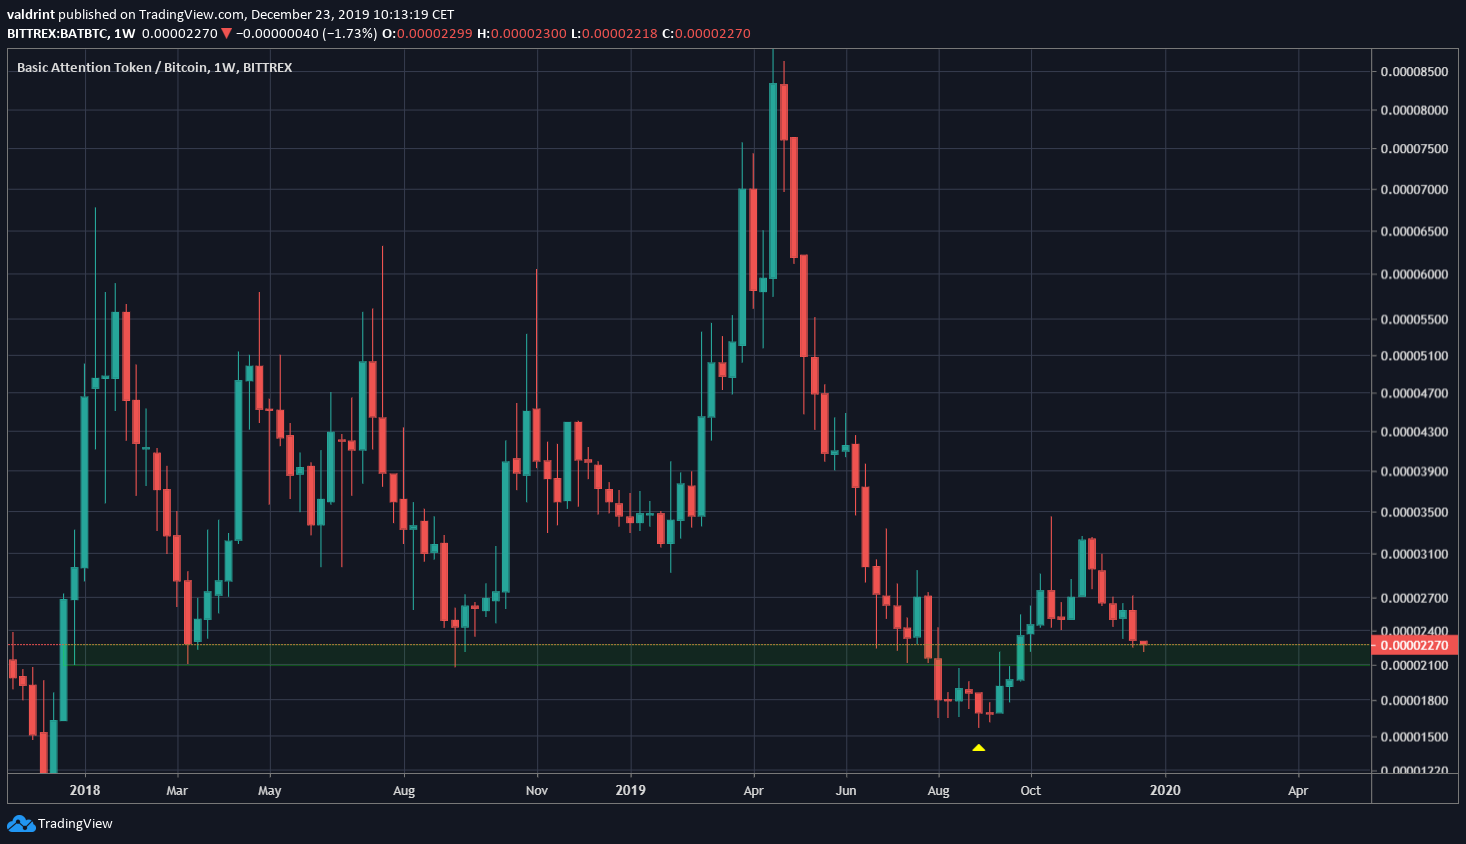
The current support area holds tremendous significance. Looking at the long-term chart, it has acted as support since 2017.
While the price broke down in August and September of this year, the lower price levels could not be sustained. Whether the price holds above the support area this time will indicate if that was a failed breakdown, which is currently looking likely.
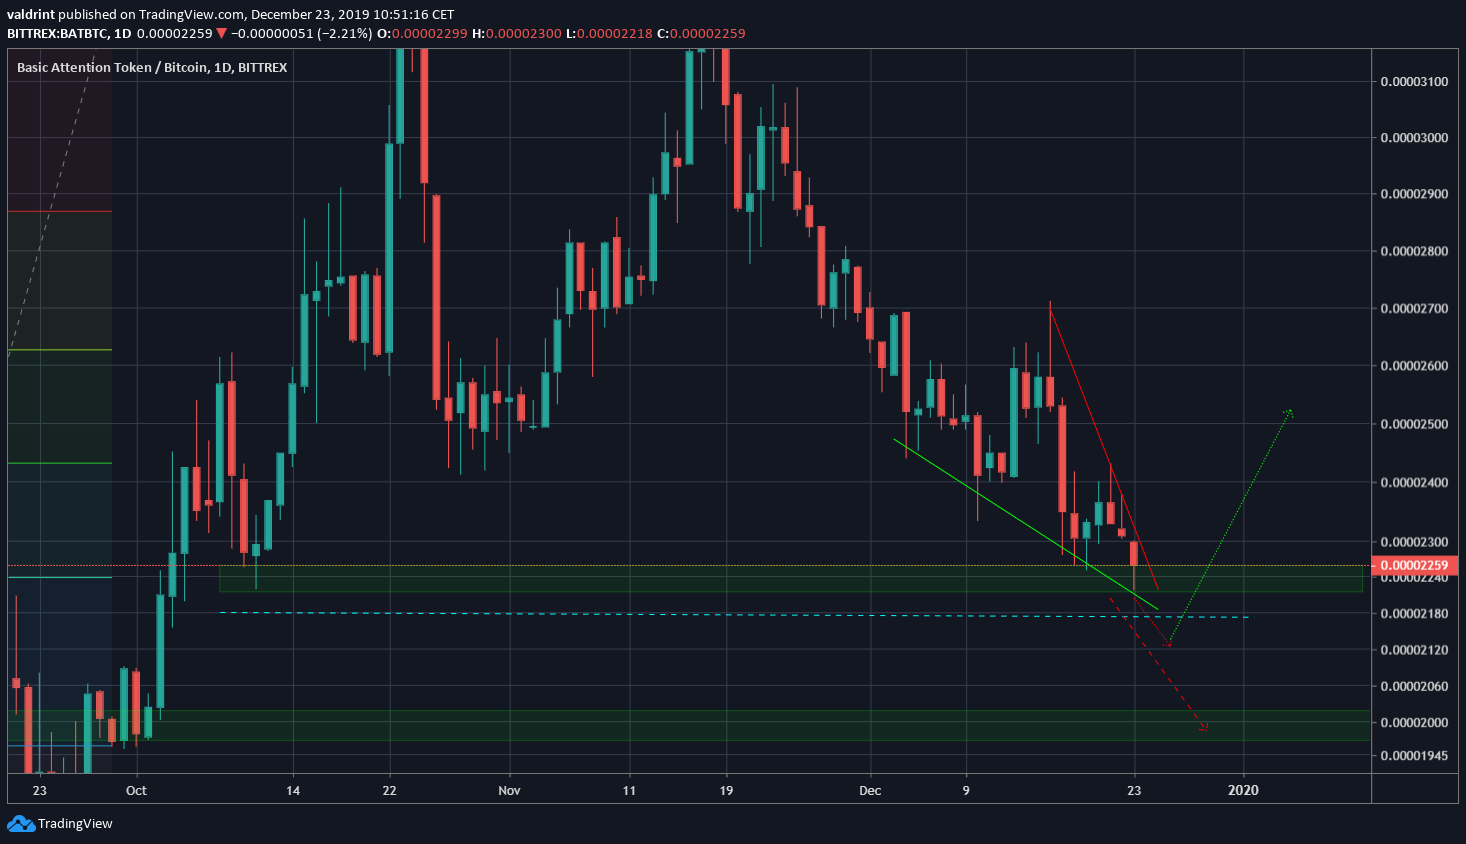
Descending Wedge
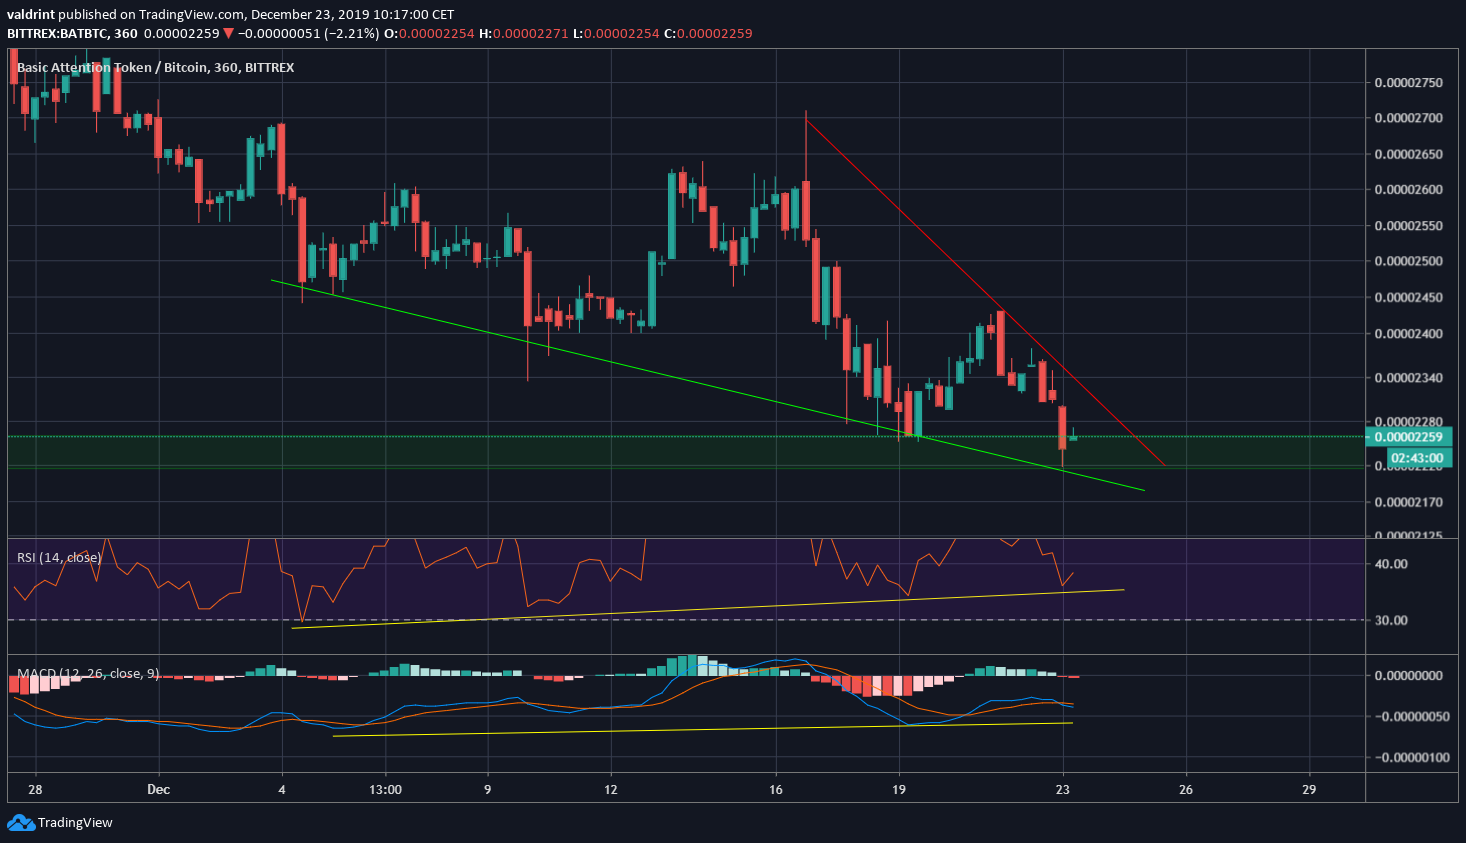
A look at lower time-frames reveals that the price has been trading inside a descending wedge since Dec 4. This is considered a bullish pattern, after which a breakout should ensue.
Also, there is strong bullish divergence developing in both the RSI and MACD. Combining this with the fact that the price is inside a significant support area and the wedge is a bullish pattern, it is likely that a breakout should transpire soon.
Future Movement
If the price breaks out, the next resistance areas to keep an eye on are at 2,500 and 2,600 satoshis. These are the levels most likely to initiate a retracement.
For the longer-term, it seems as if the price will again revisit the 3,200 satoshi resistance area.
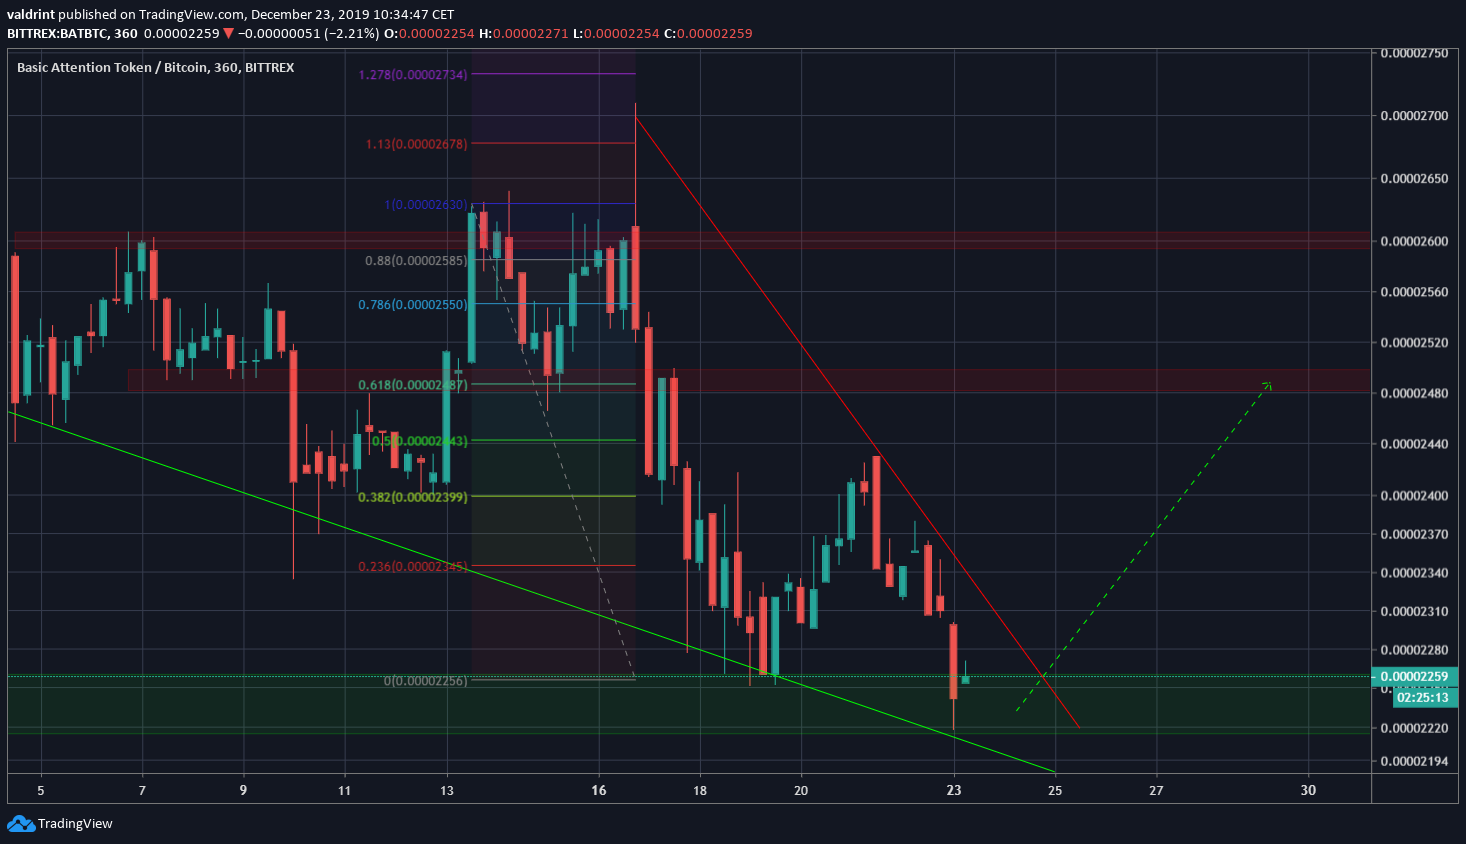
For hypothetical trading purposes, those that enter a position would be prudent to place a stop loss below the wick, at around 2,170 satoshis. This is because if the price falls below the current support area it is likely to head lower (dashed red line).
It is unlikely that a fake breakdown scenario will occur (dotted line).
To conclude, the BAT price has decreased to a significant support area and has created a bullish pattern. It looks poised to break out and head towards the resistance areas outlined above.
