

In the early hours of Nov. 26, the BTC price was subject to a rapid decrease, dropping by nearly $1,700 in a matter of hours.
The price has broken down from a bullish structure that had been in place since the upward move began to accelerate in September.
It is possible that BTC has begun a corrective trend.
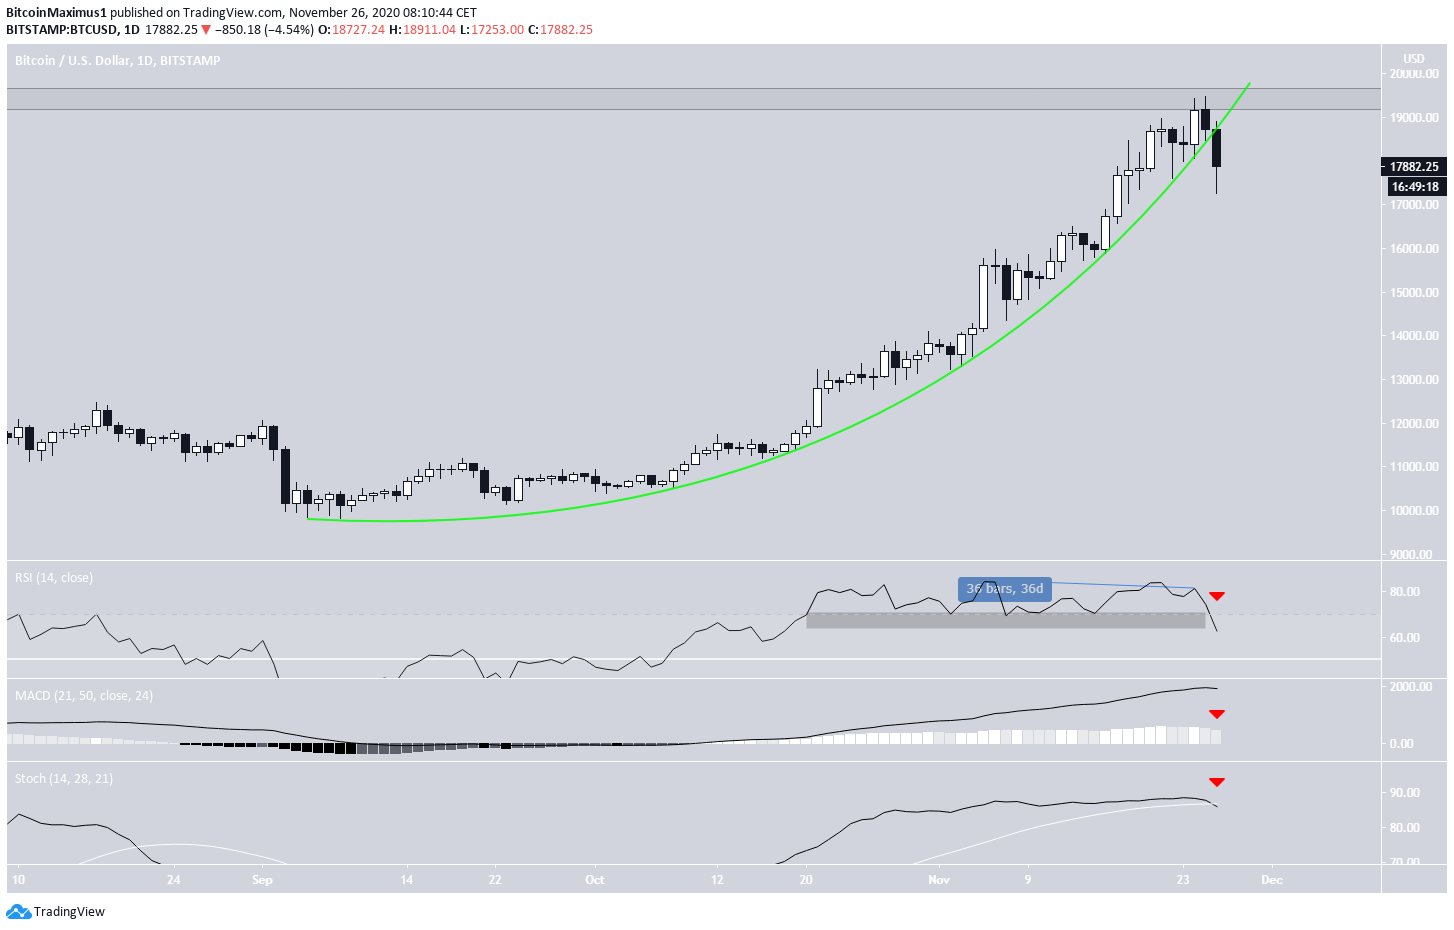
Bitcoin Parabolic Support Breakdown
The Bitcoin price had been following a parabolic ascending support line since Sept. 5, when the entire upward move began. Following this line, BTC reached a high of $19,490 on Nov. 25, slightly below the all-time high price of $19,666.
On Nov. 26, BTC created a significant bearish candlestick, broke down from the support line, and began a downward move that is still ongoing.
After 36 days in overbought territory and multiple bearish divergences, the daily RSI has finally decreased below 70. In addition, the Stochastic oscillator has made a bearish cross and the MACD is also decreasing.
Therefore, it is possible that the upward move has ended.
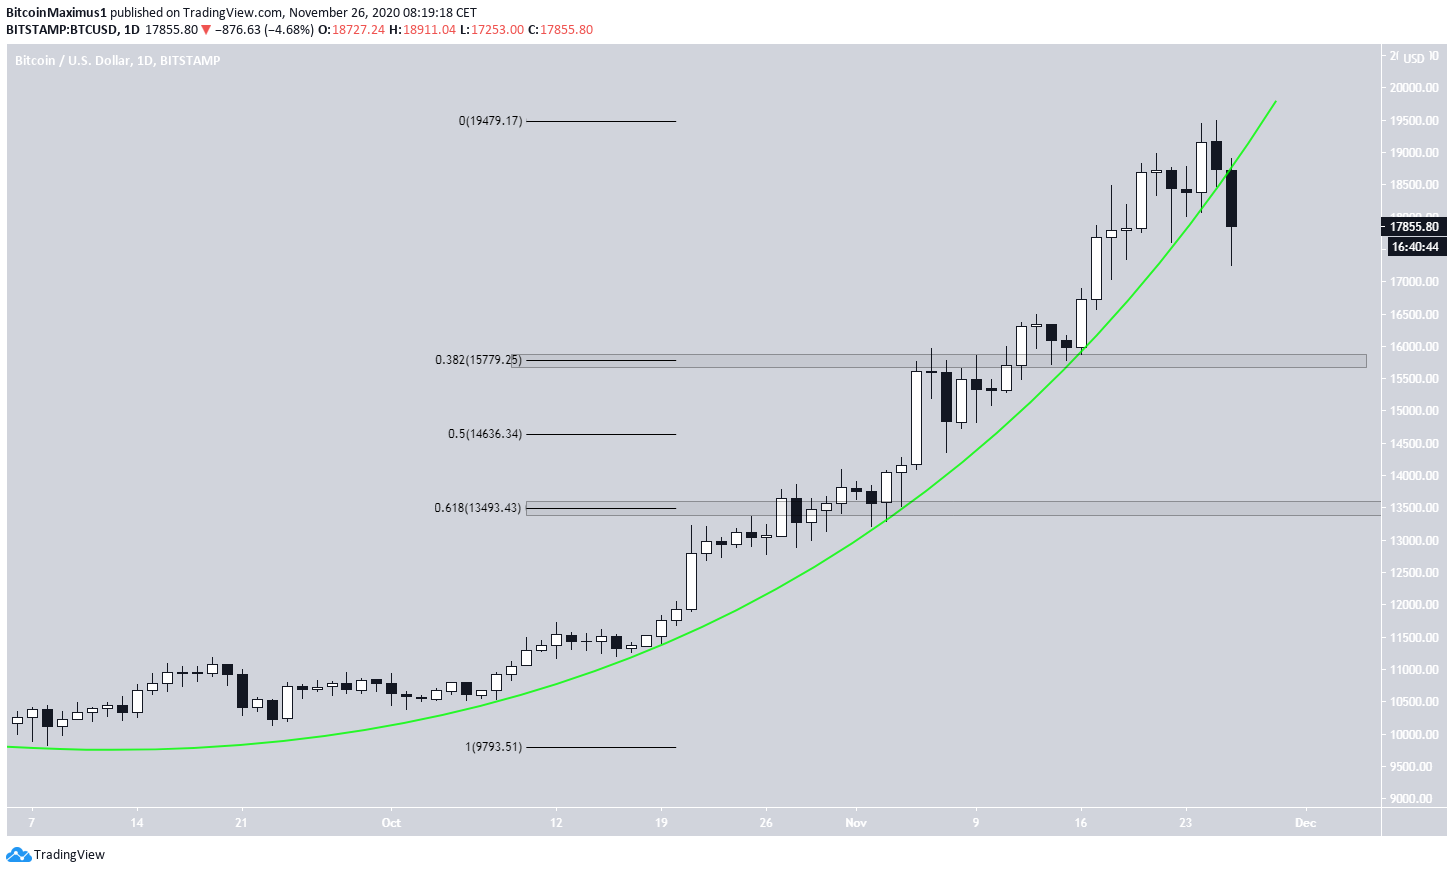
If BTC continues decreasing, the two most likely levels to complete the correction are found at $15,800 and $13,500. These are the respective 0.382 and 0.618 Fib retracement levels of the entire upward move.
The 0.5 Fib level at $14,640 is also likely to provide support, however it is not a horizontal support area.
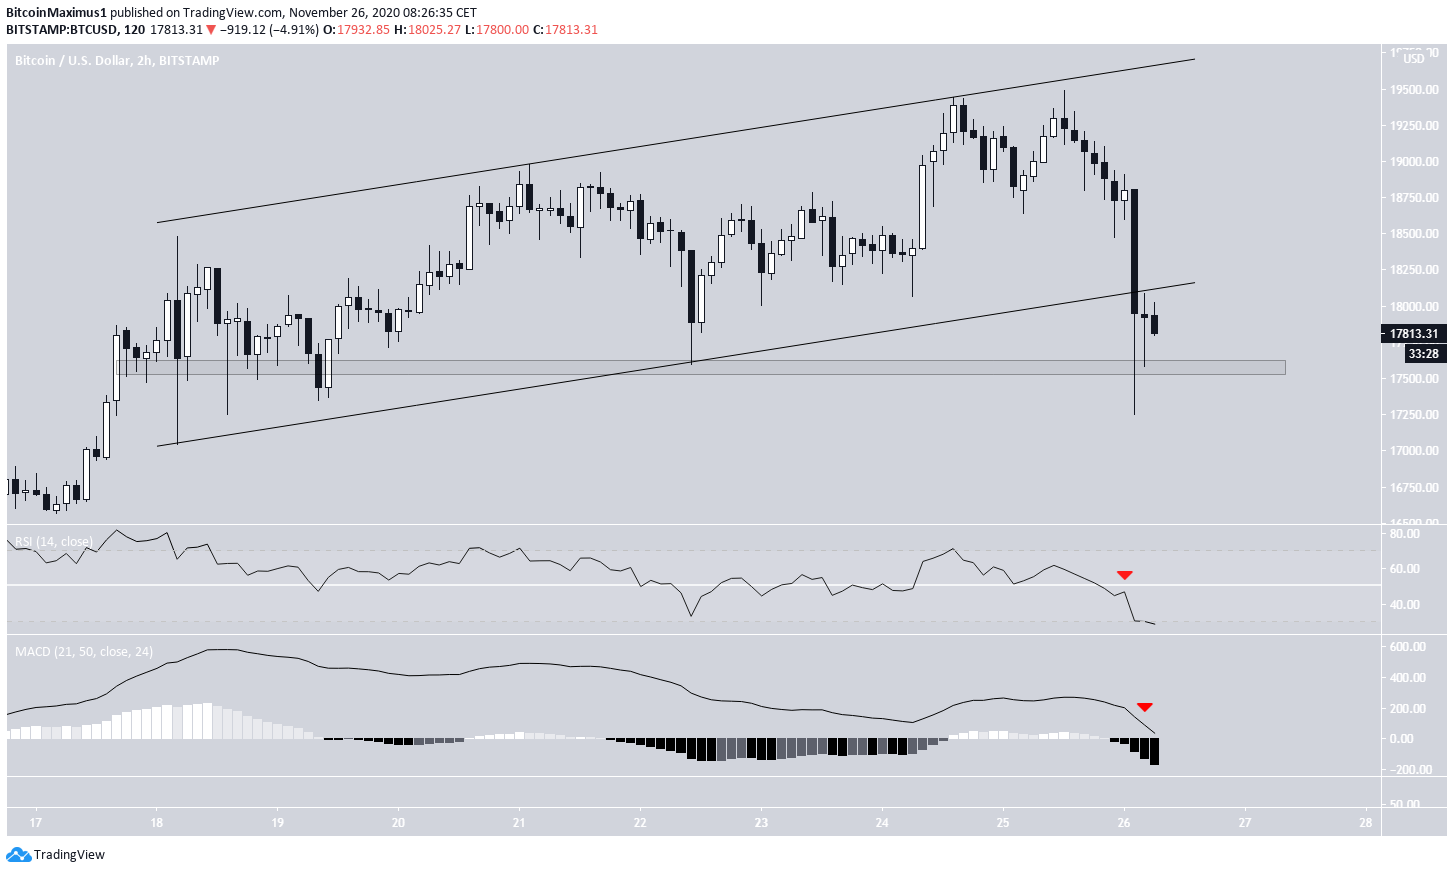
Short-Term BTC Movement
The two-hour chart shows that the price broke down from a parallel ascending channel that had been in place since Sept. 18.
Short-term technical indicators have turned bearish. Both the RSI and MACD are decreasing and the former has dropped below 50.
Therefore, while a bounce could occur, possibly to validate the support line of the channel BTC just broke down from, the price is expected to eventually also break down from this support area.
Conclusion
To conclude, Bitcoin’s breakdown suggests that the price has now begun a corrective movement which could take the price back to $15,800.
For BeInCrypto’s previous Bitcoin analysis, click here!
Disclaimer: Cryptocurrency trading carries a high level of risk and may not be suitable for all investors. The views expressed in this article do not reflect those of BeInCrypto
Trusted
Disclaimer
In line with the Trust Project guidelines, this price analysis article is for informational purposes only and should not be considered financial or investment advice. BeInCrypto is committed to accurate, unbiased reporting, but market conditions are subject to change without notice. Always conduct your own research and consult with a professional before making any financial decisions. Please note that our Terms and Conditions, Privacy Policy, and Disclaimers have been updated.
