

Mantle (MNT) has defied the broader market’s lackluster performance over the past week, standing out as one of the best-performing tokens.
While many altcoins struggled to hold ground, MNT has climbed an impressive 35% in the past seven days. It trends within an ascending parallel pattern on the daily timeframe, suggesting more upside could be ahead.
MNT Price Action Strengthens
Readings from the MNT/USD daily chart show the token trending within an ascending parallel channel. This is a bullish pattern formed when an asset’s price action consistently makes higher highs and higher lows, moving between two upward-sloping parallel lines.
For token TA and market updates: Want more token insights like this? Sign up for Editor Harsh Notariya’s Daily Crypto Newsletter here.
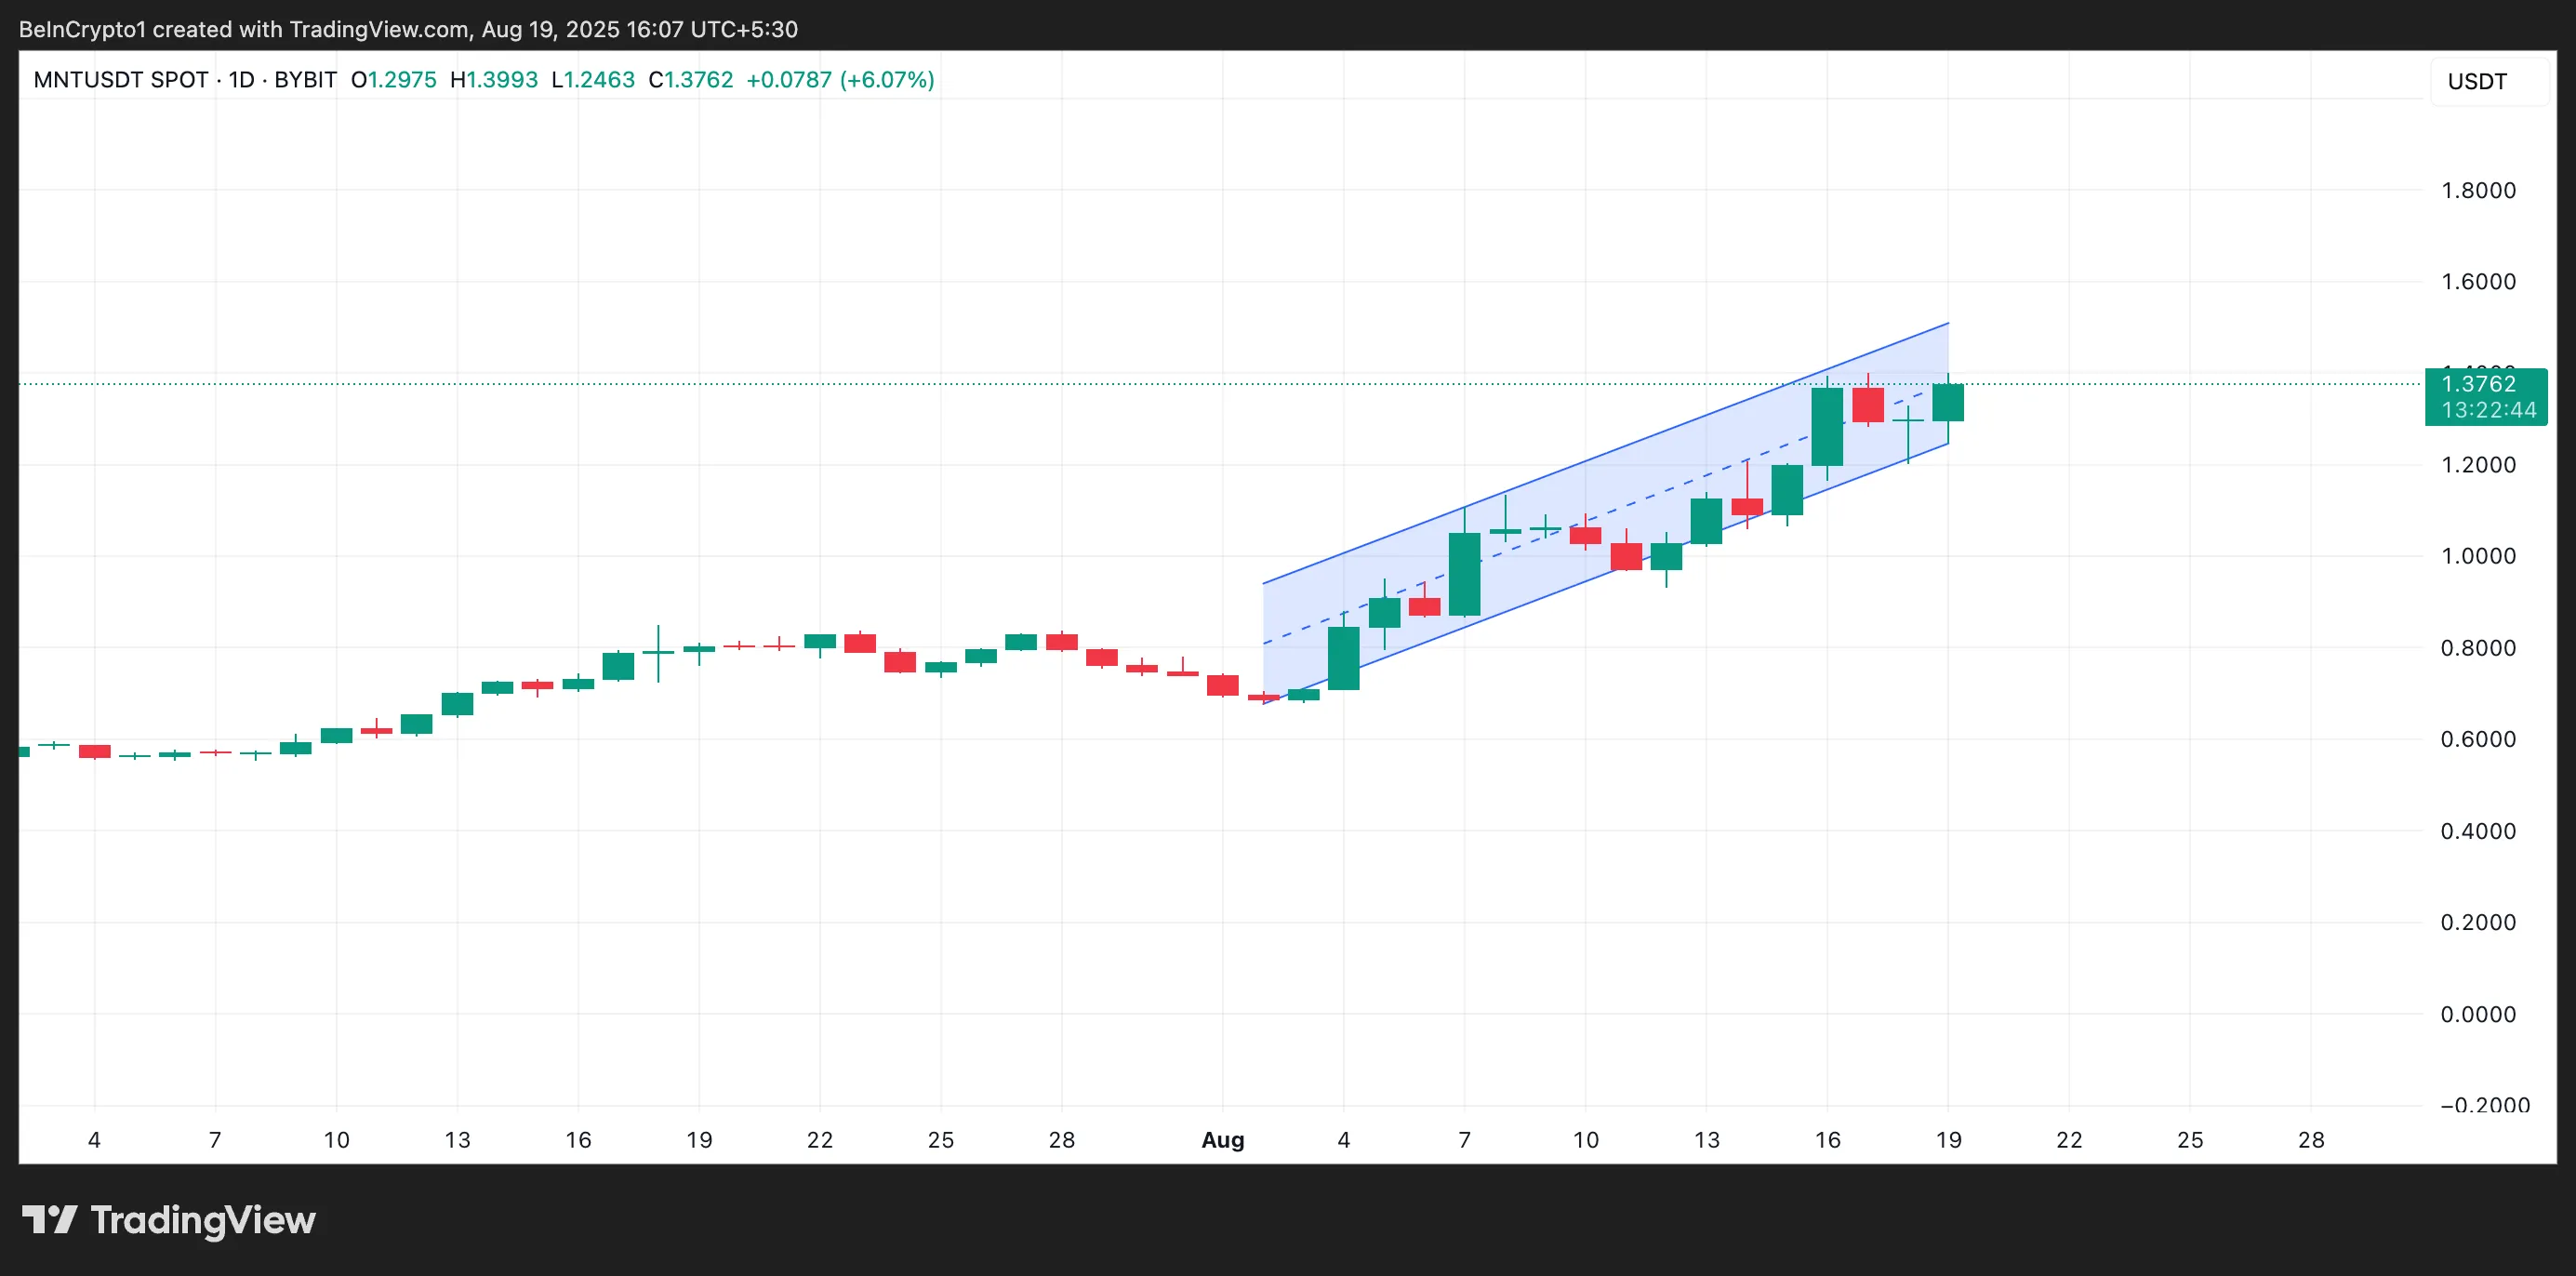
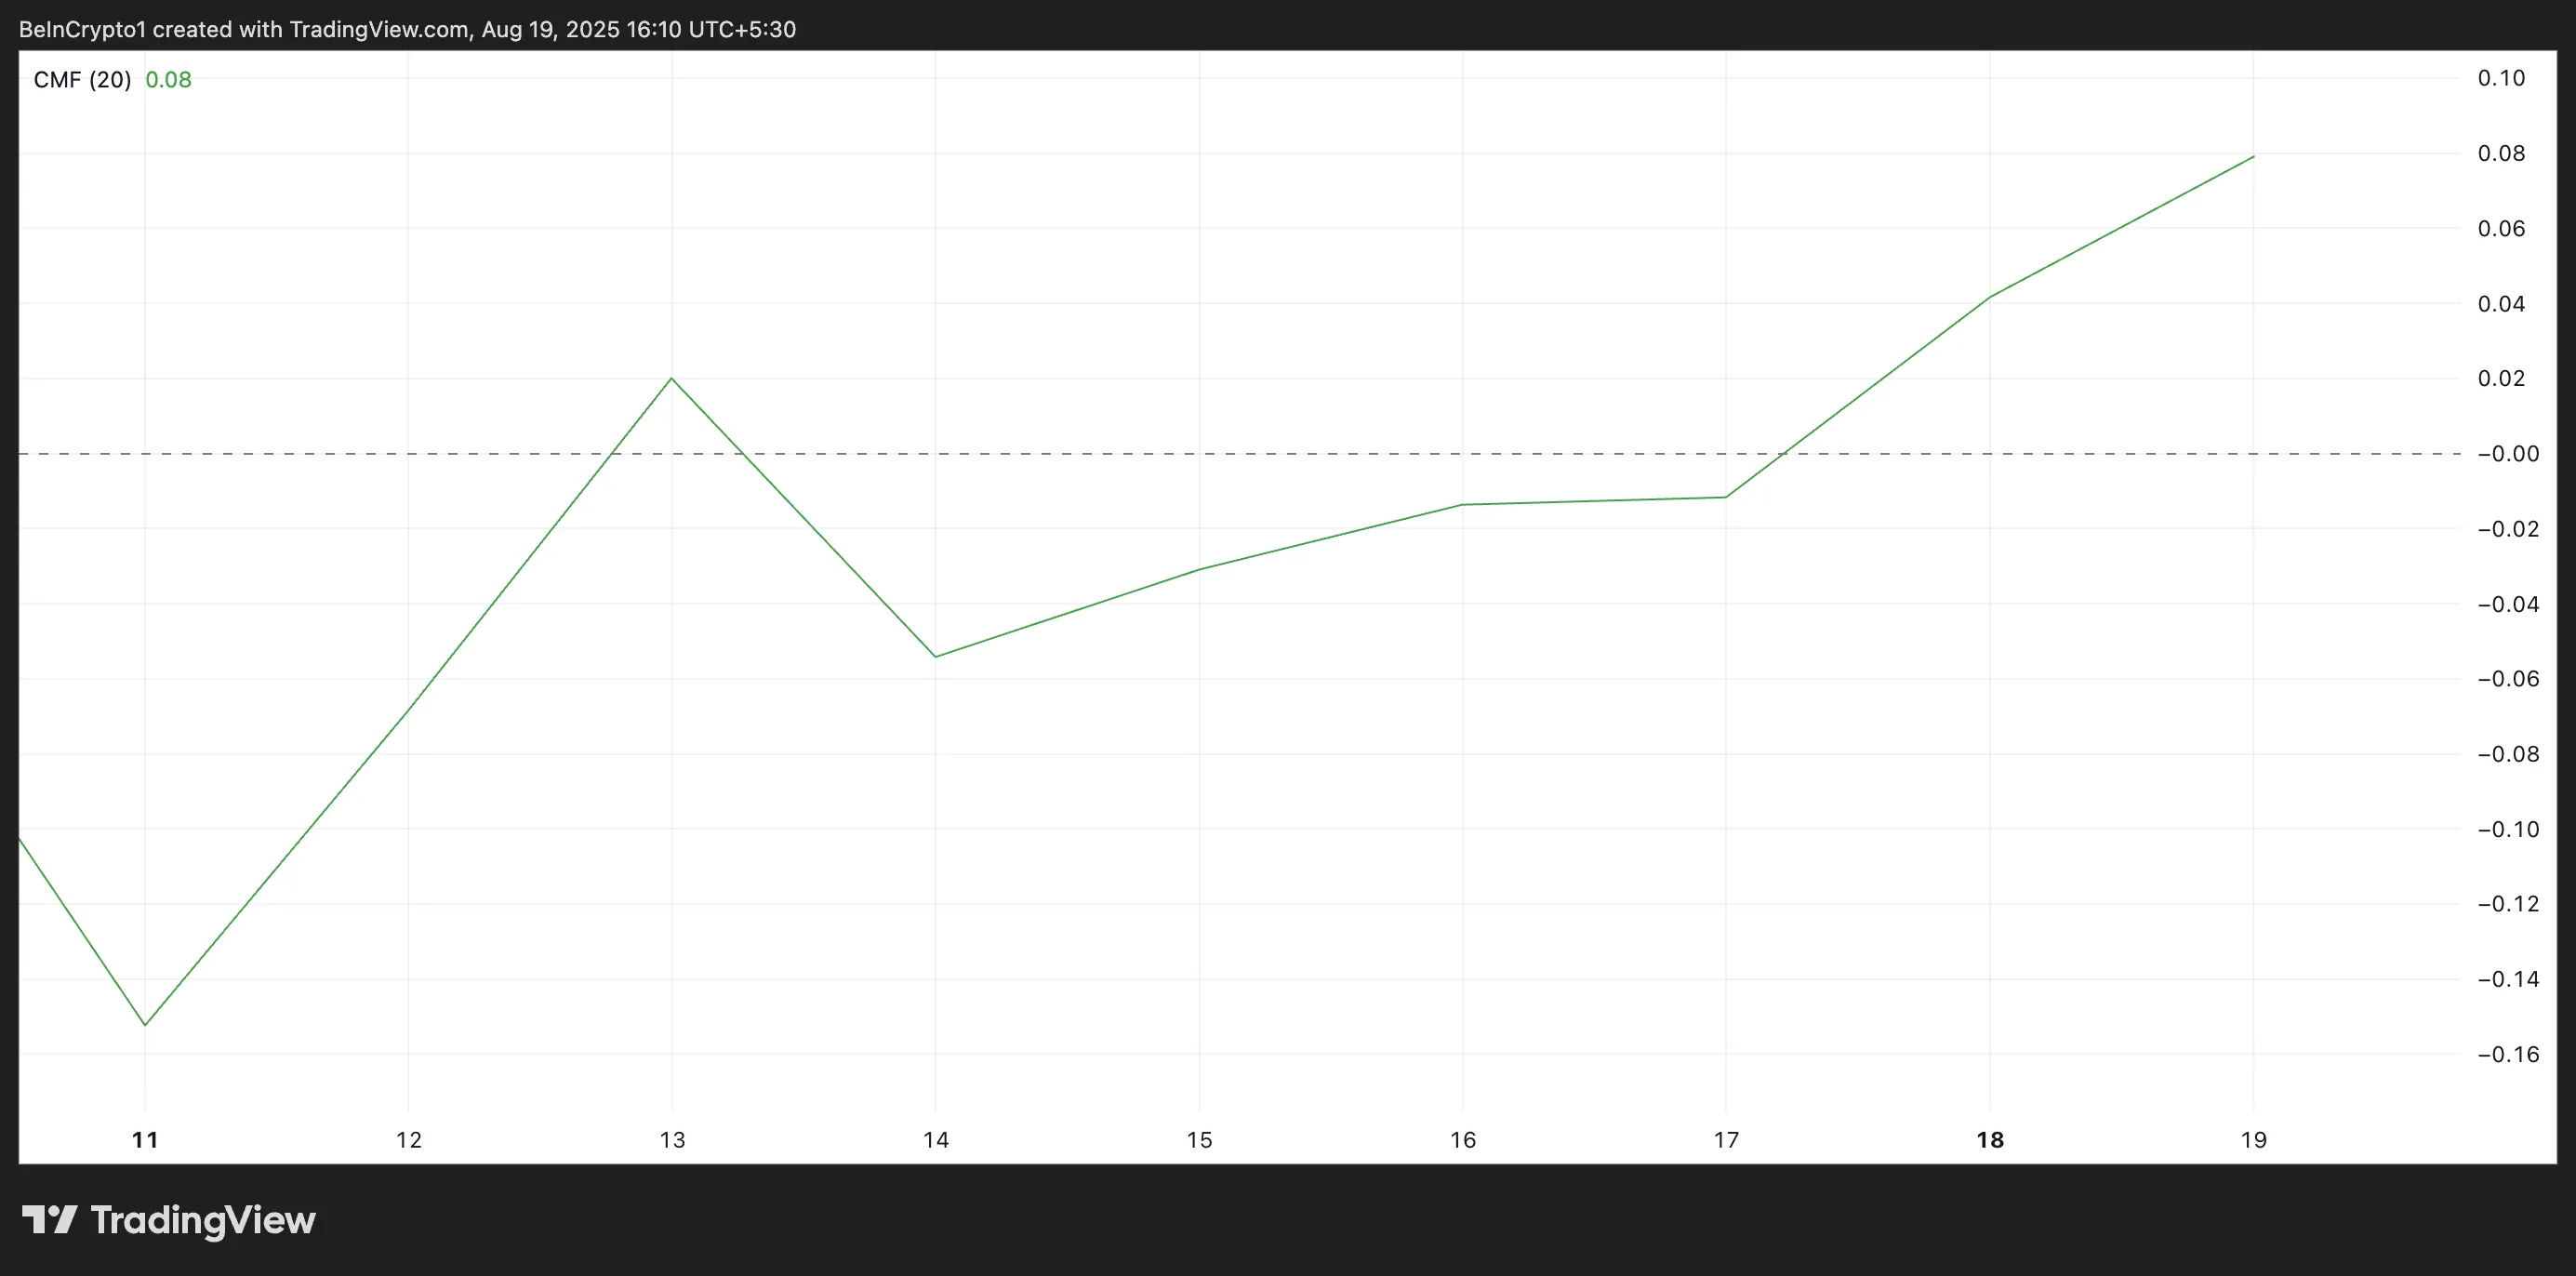
The pattern reflects a market in a steady uptrend, where each dip is met with renewed buying pressure. MNT’s surging Chaikin Money Flow (CMF) supports the uptick in buy-side pressure.
As of this writing, this momentum indicator, which tracks how money flows into and out of an asset, is at 0.08 and trending upward. The positive CMF reading indicates strong buying pressure, showing investors continue to pour capital into MNT.
Furthermore, MNT’s Super Trend indicator, which currently forms dynamic support below its price at $0.99, confirms this bullish setup.
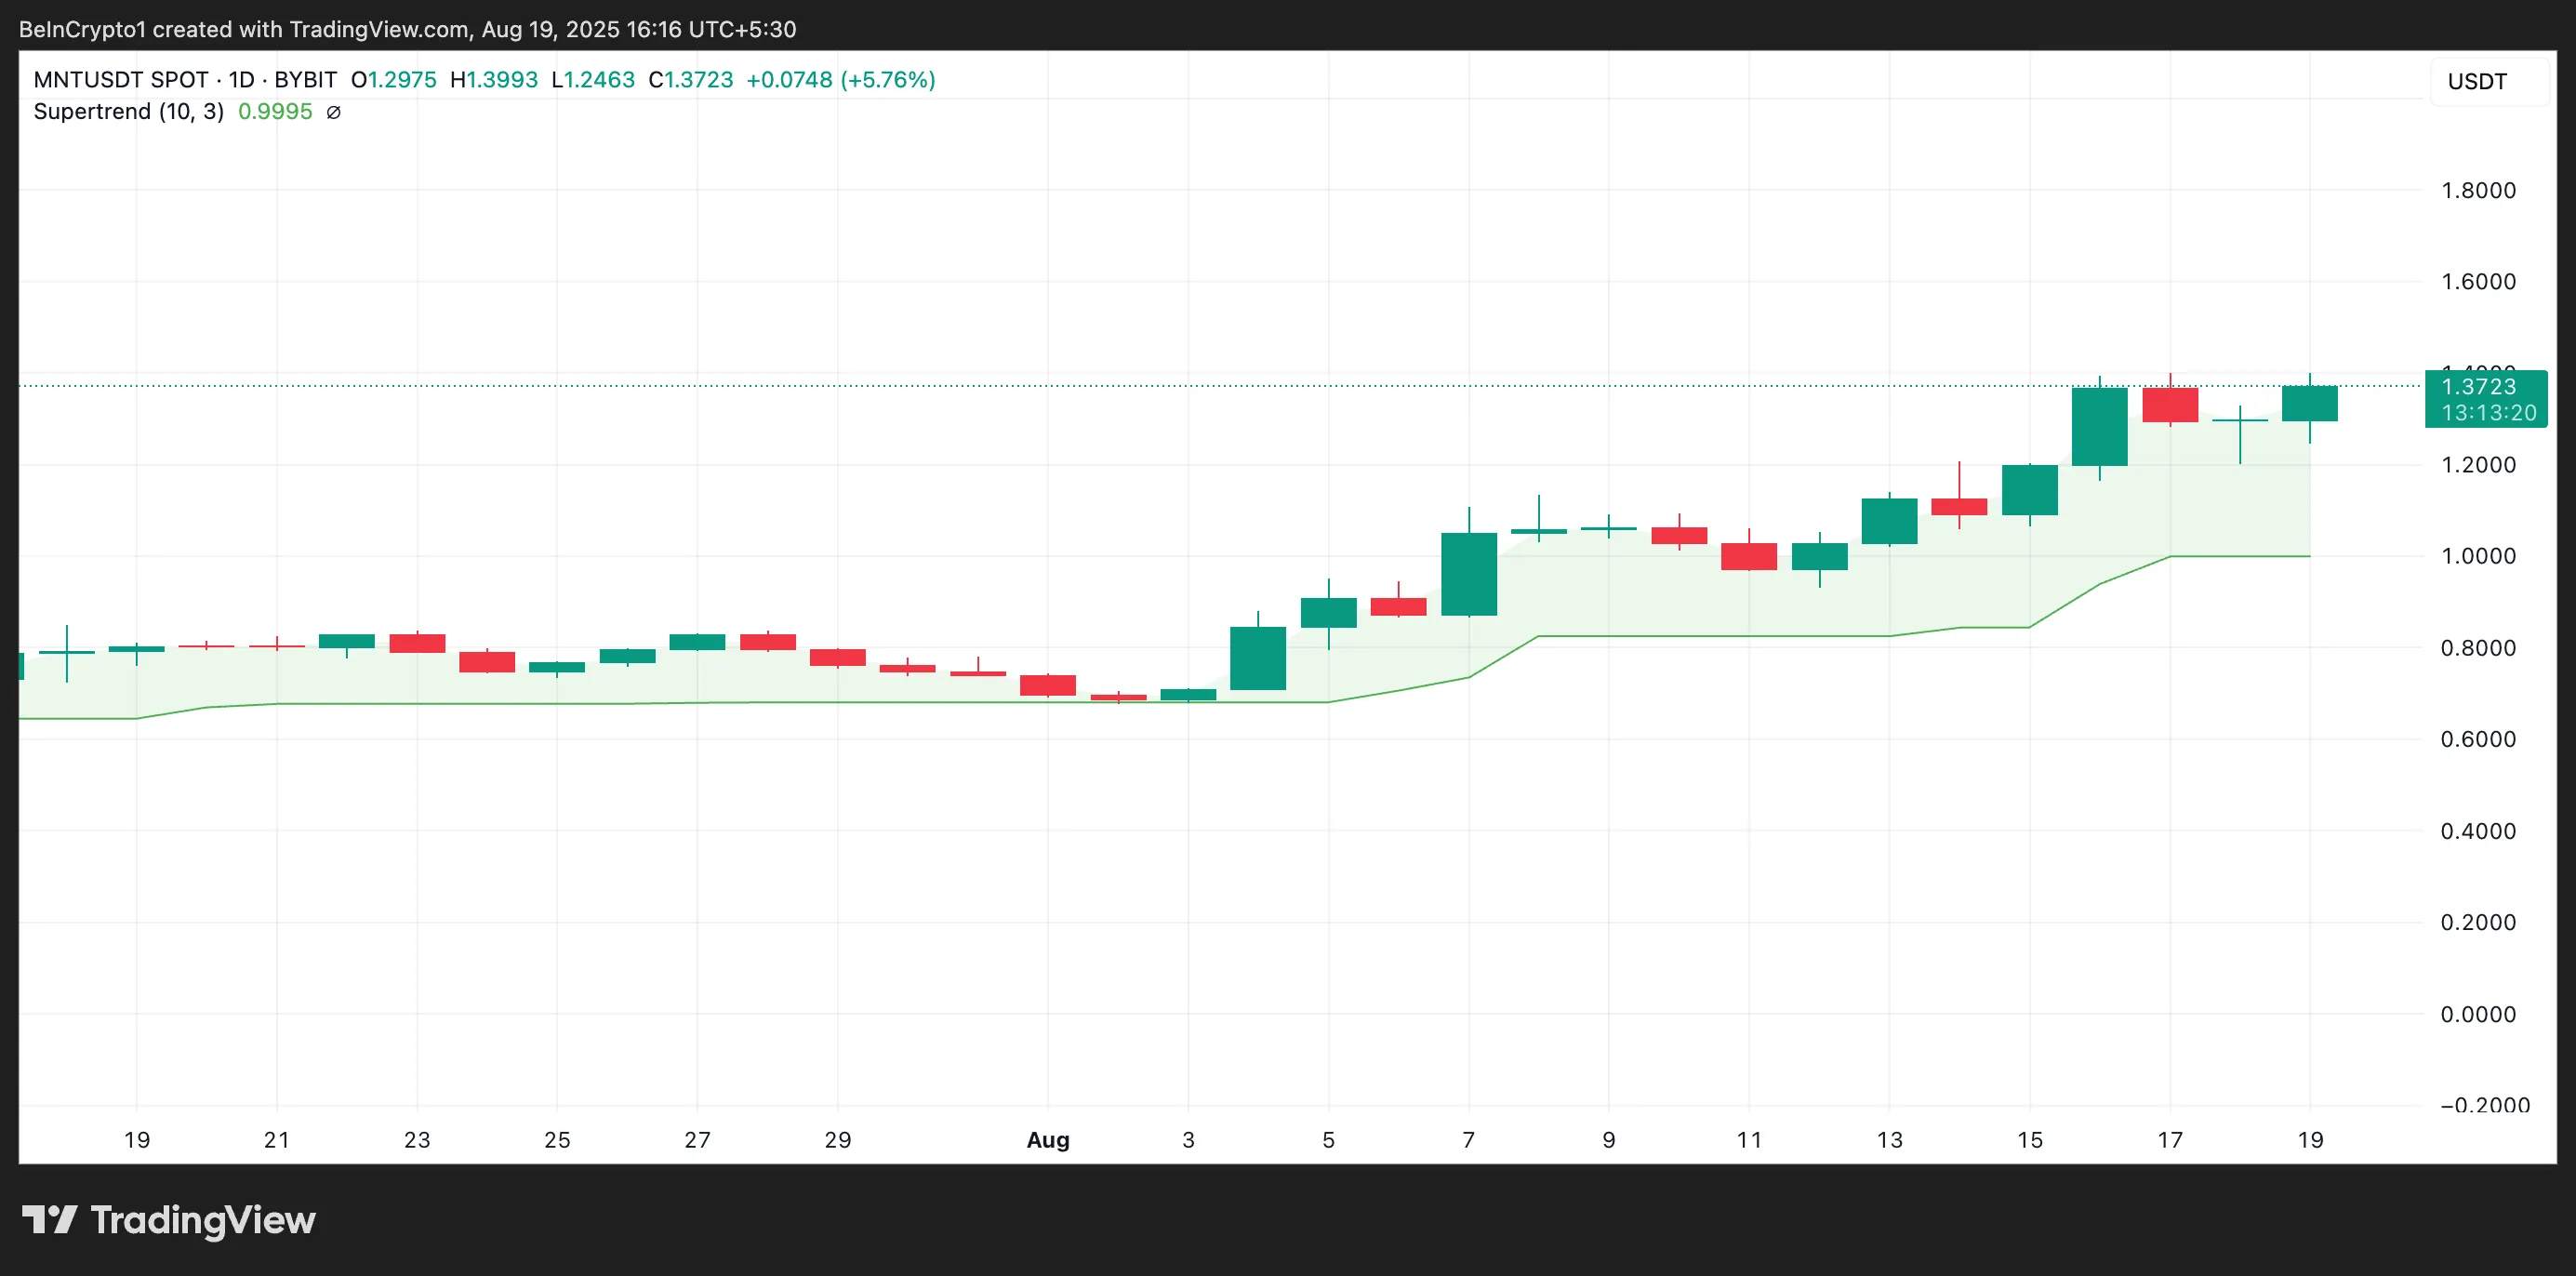
This indicator helps traders identify the market’s direction by placing a line above or below the price chart based on the asset’s volatility.
When an asset’s price trades below the Super Trend line, it signals a bearish trend, indicating that the market is in a downtrend and selling pressure is dominant. Conversely, as with MNT, when the price rests above this indicator, upward momentum is strong and buyers are in control.
MNT Traders Brace for Next Big Move
At press time, MNT trades at $1.37, hovering above the support at $1.26. If accumulation persists, MNT could rally to $1.51, a high last reached in April 2024.
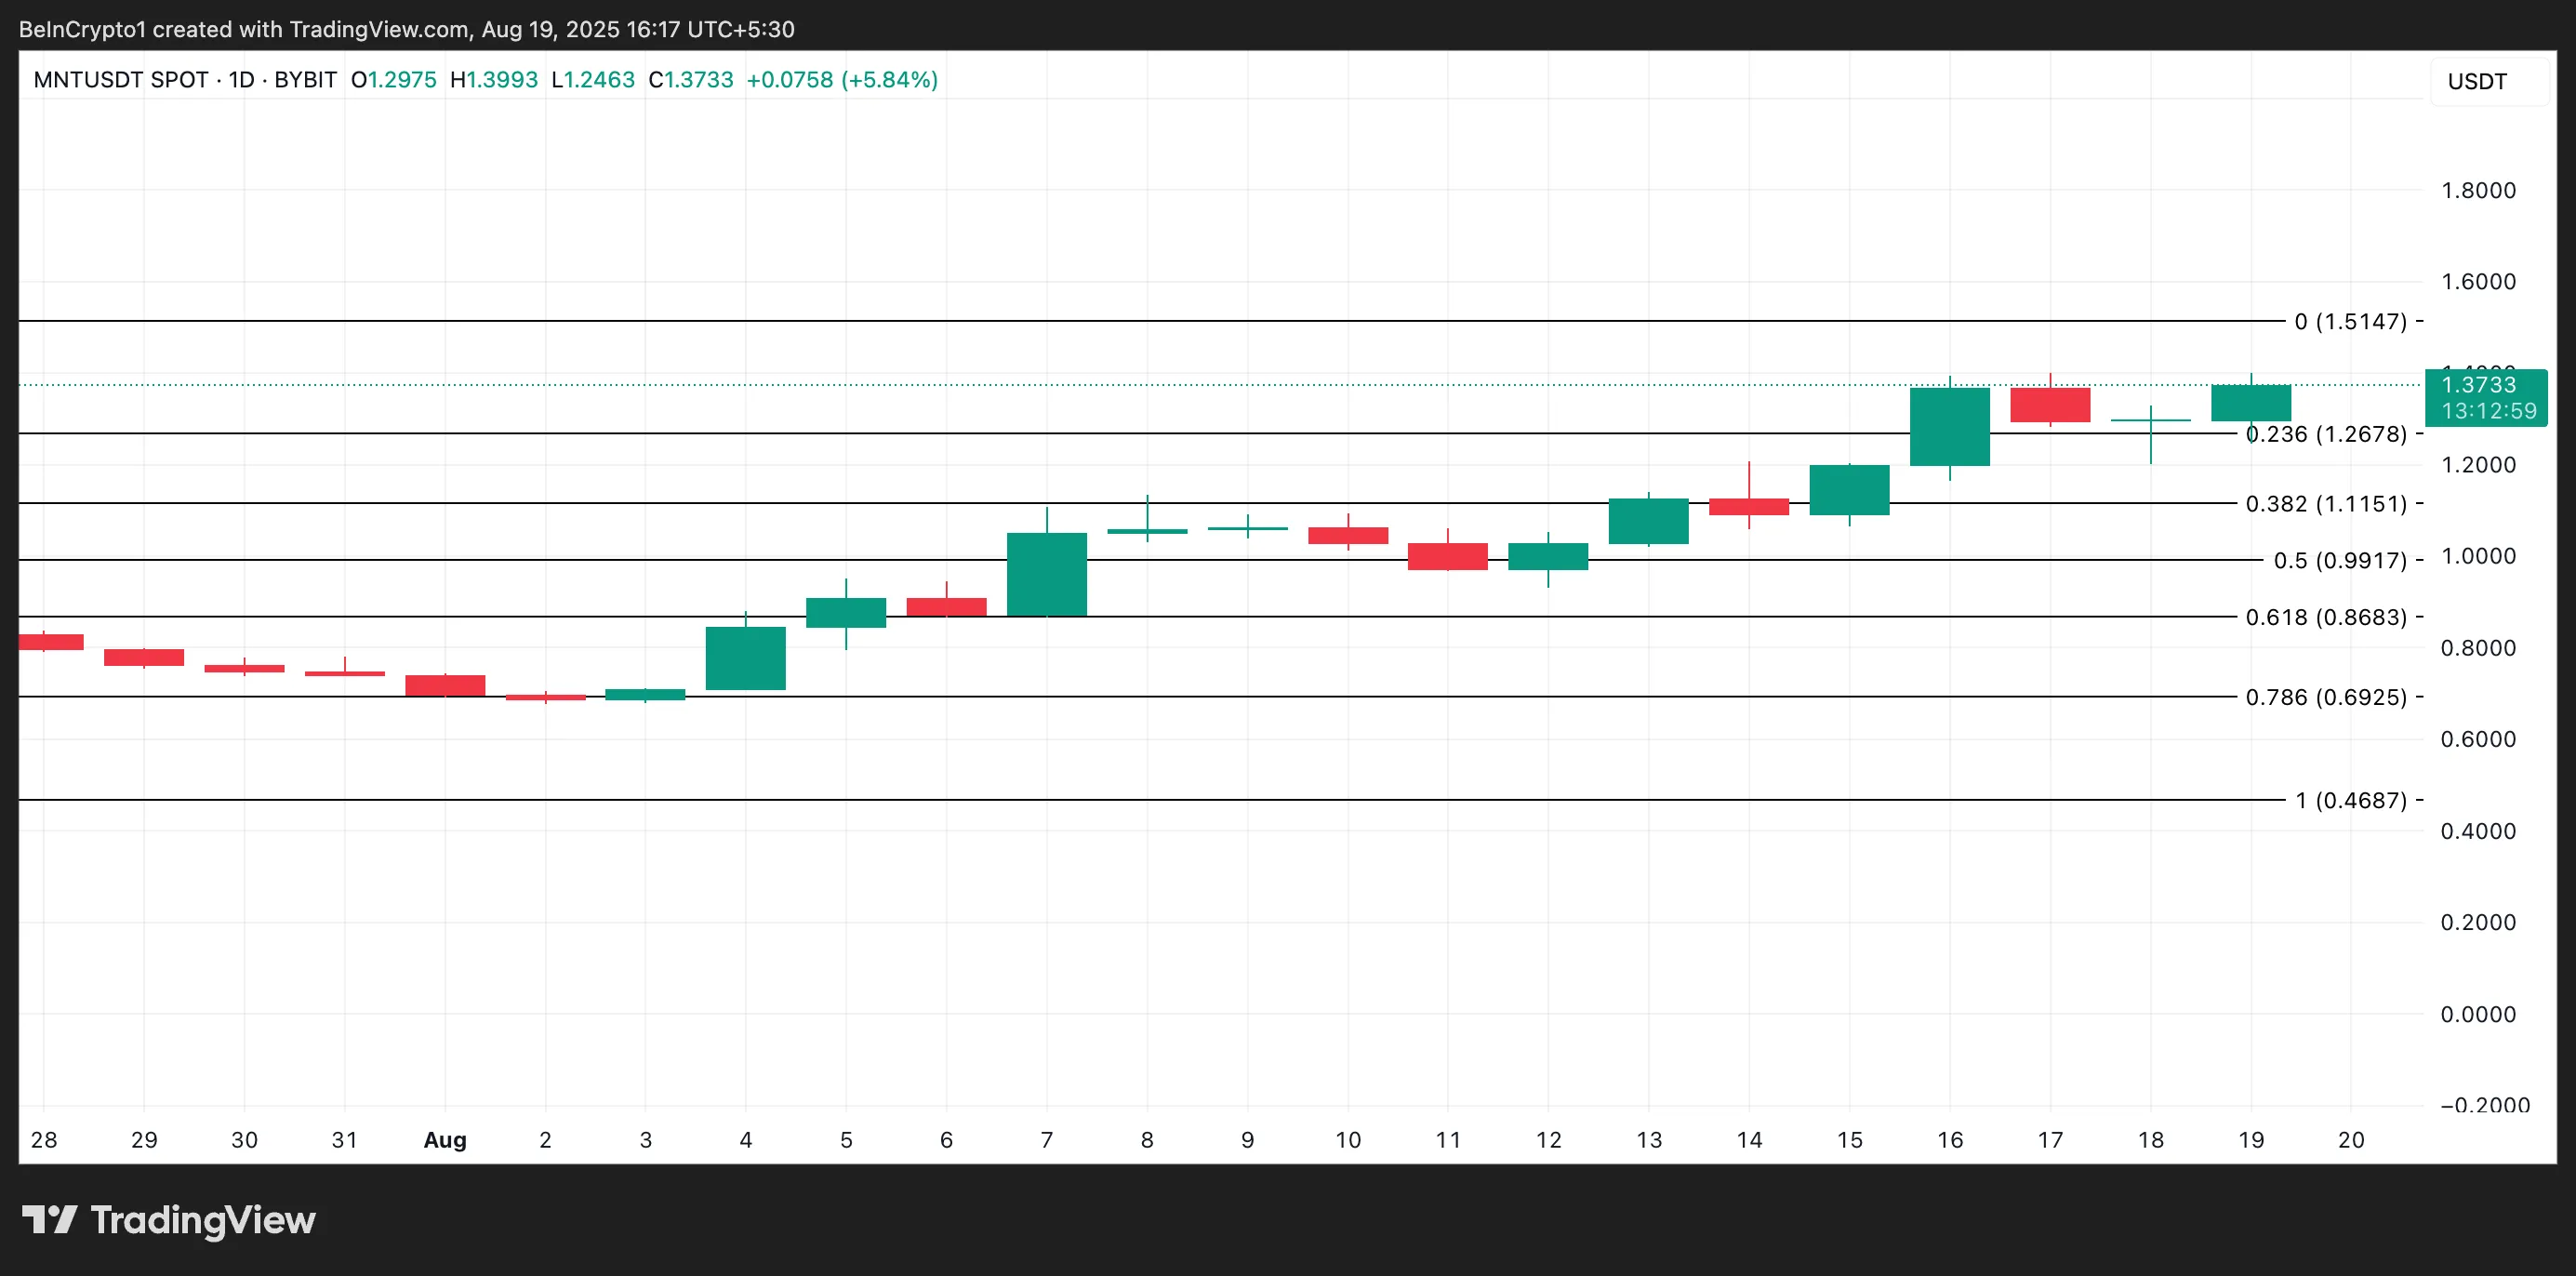
On the other hand, if buying declines, MNT’s price could break below the support at $1.26 and fall toward $1.11.
Disclaimer
In line with the Trust Project guidelines, this price analysis article is for informational purposes only and should not be considered financial or investment advice. BeInCrypto is committed to accurate, unbiased reporting, but market conditions are subject to change without notice. Always conduct your own research and consult with a professional before making any financial decisions. Please note that our Terms and Conditions, Privacy Policy, and Disclaimers have been updated.