

On February 11, the LINK price broke out above a significant resistance area and reached an all-time high price of 40,580 satoshis the next day.
Link Highlights
- The breakout transpired with weak volume.
- The price is following a parabolic ascending support line.
- Technical indicators are bullish.
- There is support at 36,000 satoshis.
- The price could be trading inside a short-term ascending channel.
Beginning from next week’s vote, the analysis will be shared exclusively on Telegram.⚠️ Weekly Vote ⚠️
— BeInCrypto (@beincrypto) February 12, 2020
Let us know which #cryptocurrency you'd like to see a TA of in our Telegram Trading Community here: https://t.co/vdLSNy2rZN$LINK $BAT $WTC or $DOGE ?
All-Time High Price
LINK’s price movement has been bullish since its inception and has been following a parabolic ascending support line since late 2017. The price reached an all-time high price of 39,500 satoshis on July 2, 2019, but decreased afterward. After a long period of consolidation, the price broke out above this resistance area on February 11. If we use the Fib retracement tool in the final downward move, we get a target of 53,000 satoshis, which, based on the slope of the ascending support line, should be reached in June. The weekly RSI gives a bullish indication. The price bounced on the support line on January 5, the same time the weekly RSI bounced at 50 and began to increase. It has yet to reach overbought levels or generate bearish divergence, both signs of weakness.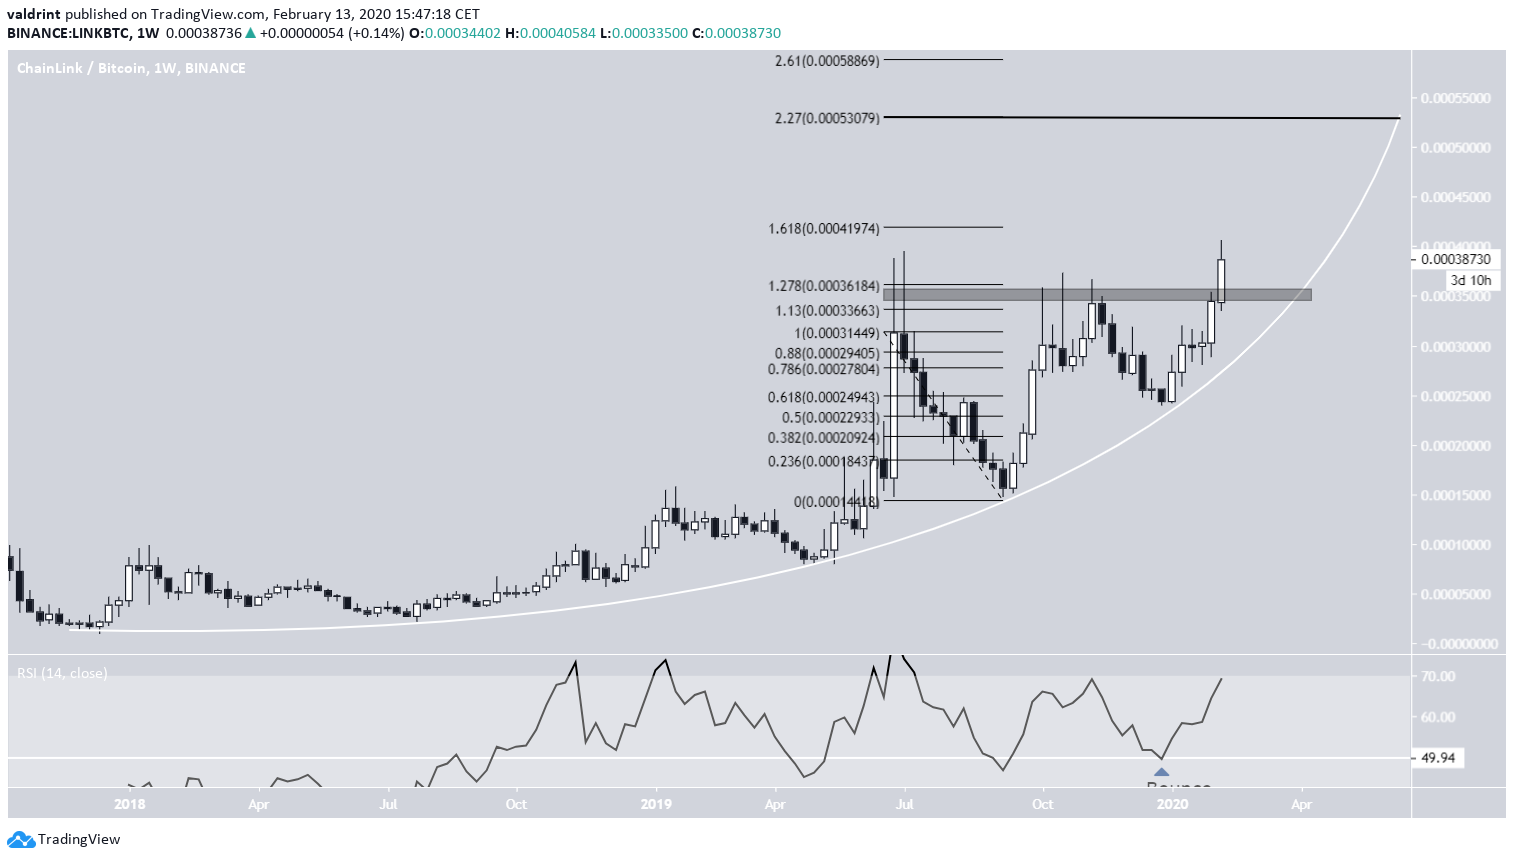
Weak Breakout
The LINK price has indeed broken out above the 36,000 satoshi resistance area, which is likely to act as support in the future. The breakout was ordinary since the price created a bullish engulfing candlestick and followed it by two dojis that validated the area as support. However, the volume was extremely lacking, especially for an all-time high breakout. In fact, the succeeding doji had a higher volume than the breakout candlestick.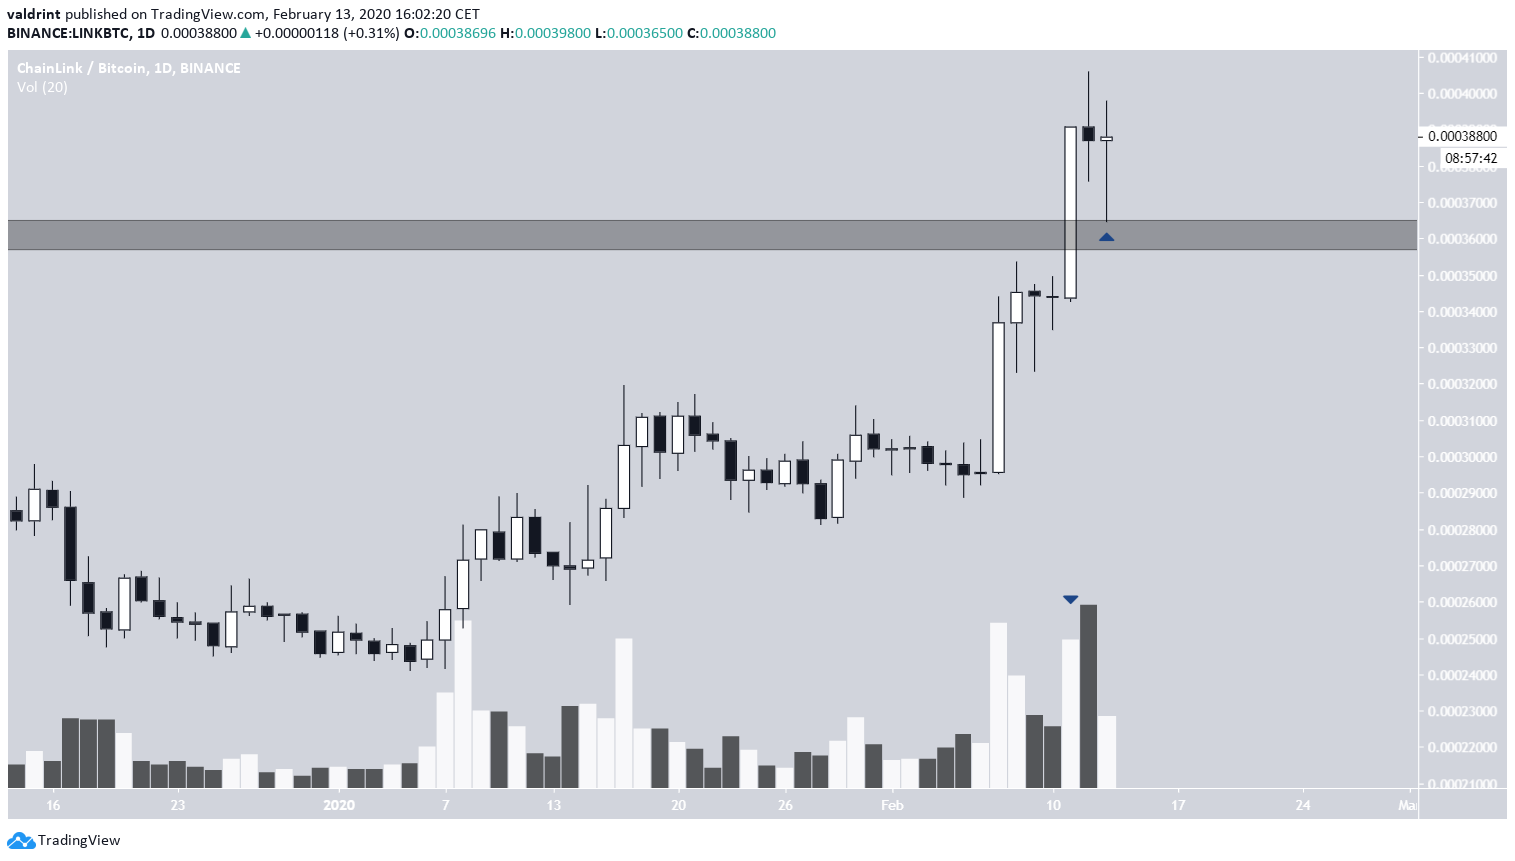 Nevertheless, the daily moving averages (MA) and RSI have yet to show any weakness. The price is trading above both the 50- and 200-day MAs, which have previously made a bullish cross. While the daily RSI is overbought, it has yet to generate any trace of bearish divergence.
The volume alone is not sufficient in calling this a fake breakout, but it does raise some concerns about the potency of the breakout.
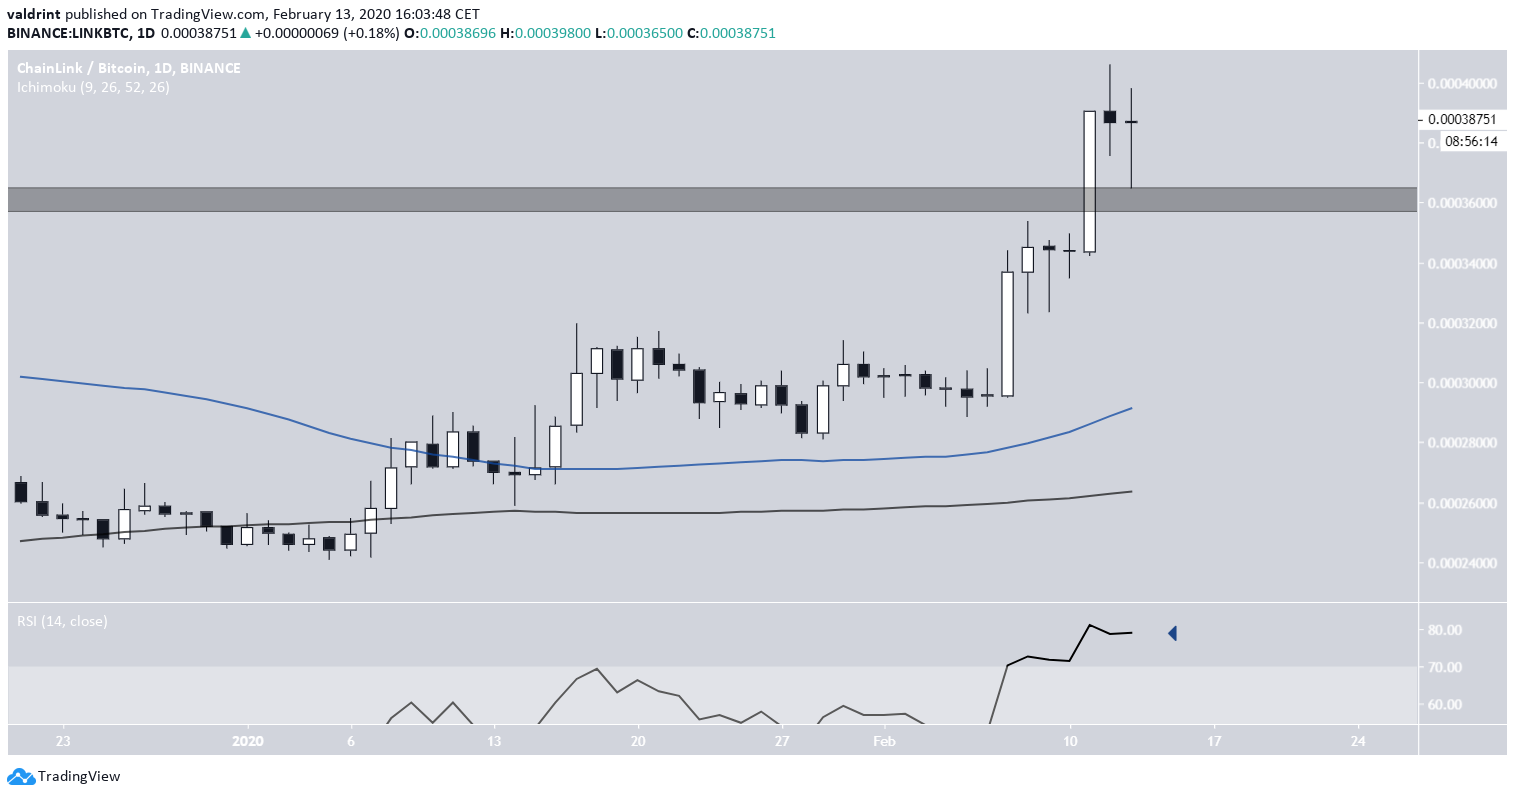
Nevertheless, the daily moving averages (MA) and RSI have yet to show any weakness. The price is trading above both the 50- and 200-day MAs, which have previously made a bullish cross. While the daily RSI is overbought, it has yet to generate any trace of bearish divergence.
The volume alone is not sufficient in calling this a fake breakout, but it does raise some concerns about the potency of the breakout.
LINK Short-Term Pattern
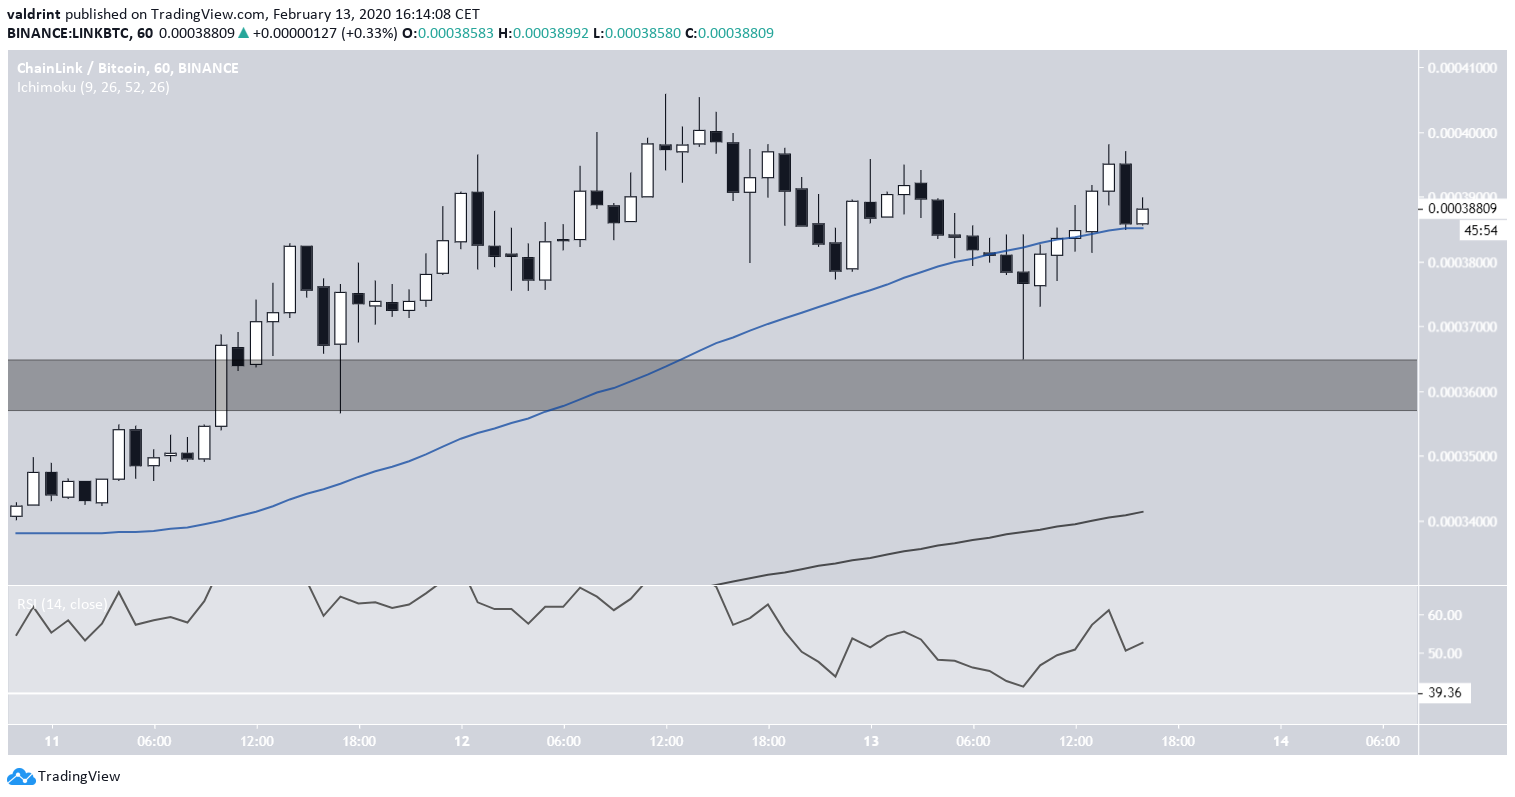
In the short-term, the price may be currently creating the right shoulder of a head and shoulders pattern. While this is a bearish pattern that suggests a breakdown will occur, the price showed strength in the form of a lower wick that was bought up very quickly once the price reached the support area.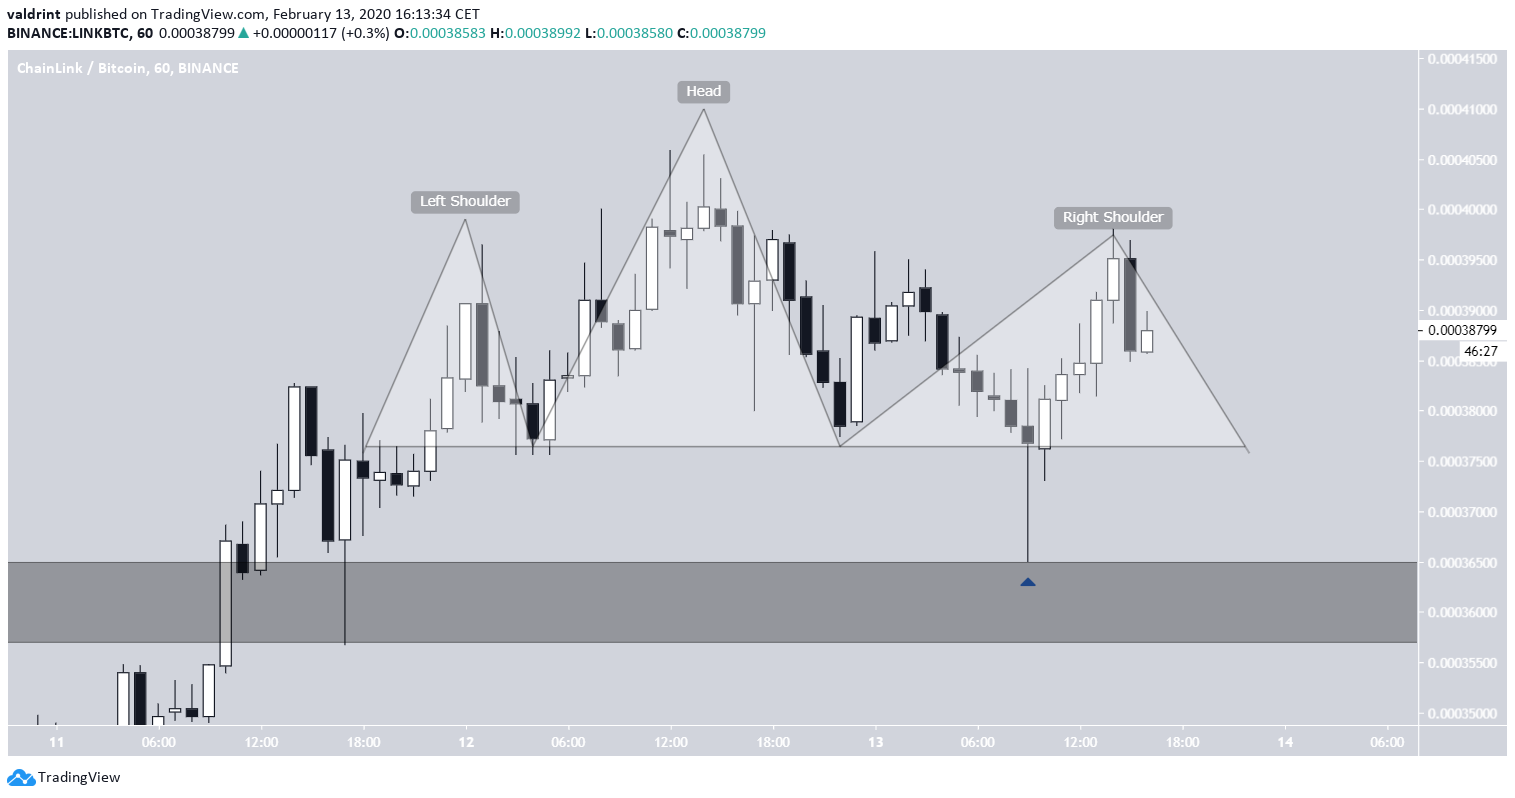 Similar to the daily outlook, short-term indicators are bullish.
The price is trading above the 50- and 200-hour MAs, which have made a bullish cross. If the price were to drop to the 36,000 support area, it would likely find support at the 200-hour MA, which is creeping upwards.
The hourly RSI is above 50 and has bounced there twice.
Similar to the daily outlook, short-term indicators are bullish.
The price is trading above the 50- and 200-hour MAs, which have made a bullish cross. If the price were to drop to the 36,000 support area, it would likely find support at the 200-hour MA, which is creeping upwards.
The hourly RSI is above 50 and has bounced there twice.
 There is another possible pattern in play, which would invalidate the head and shoulders. The price could be trading in a very steep ascending channel, moving upwards with strength. Also, strength is shown by the creation of a bullish hammer that validated the 36,000 satoshi area as support.
A breakdown from the channel would likely take the price to the support area once more, but besides the low volume on the breakout, there are no other signs that suggest LINK will do so.
There is another possible pattern in play, which would invalidate the head and shoulders. The price could be trading in a very steep ascending channel, moving upwards with strength. Also, strength is shown by the creation of a bullish hammer that validated the 36,000 satoshi area as support.
A breakdown from the channel would likely take the price to the support area once more, but besides the low volume on the breakout, there are no other signs that suggest LINK will do so.
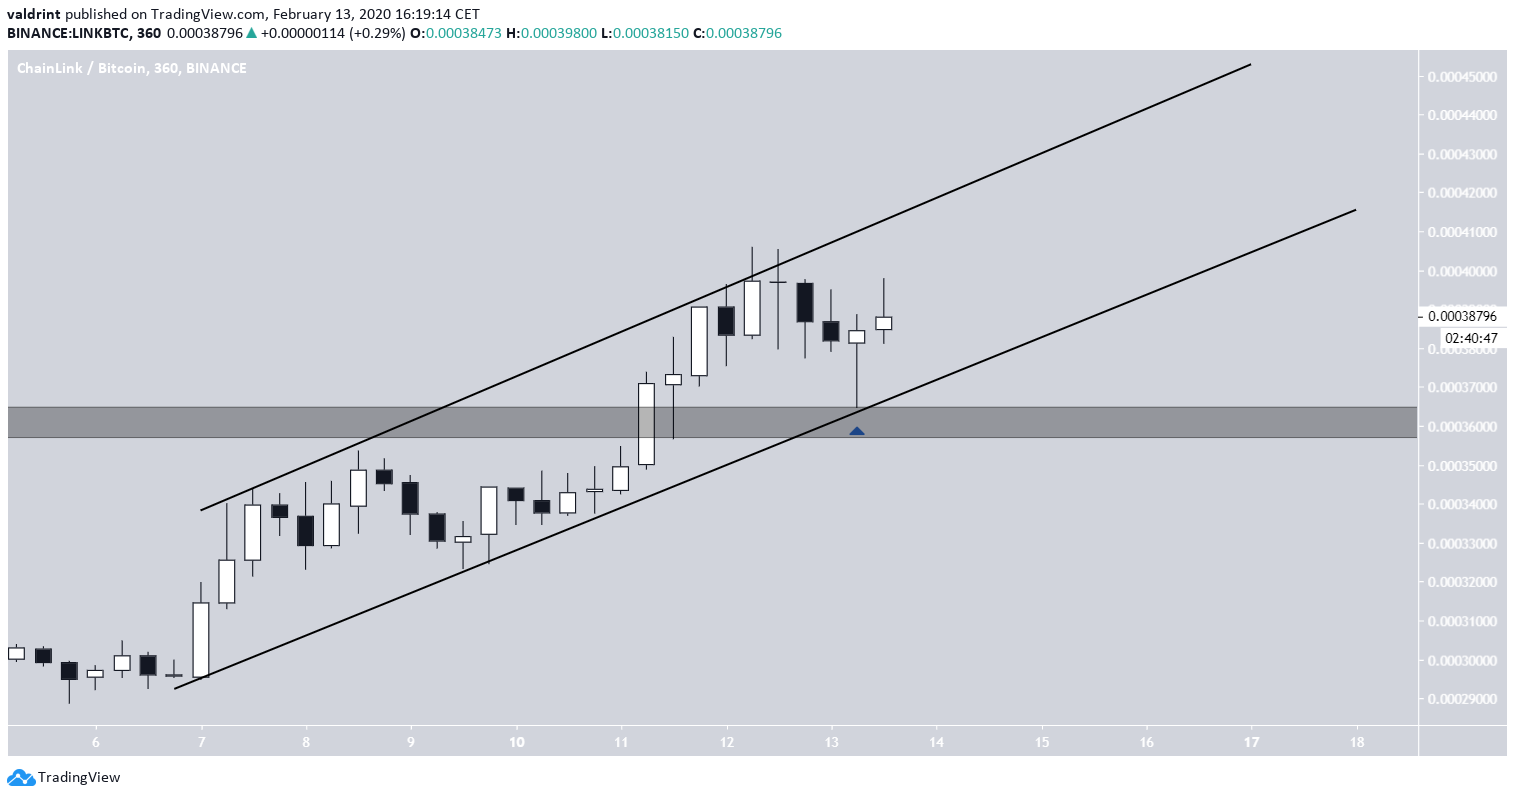 To conclude, as long as the price is trading inside the ascending channel, we will consider its short-term movement bullish. A breakdown from the channel would likely take the price to the 36,000 satoshi support area.
In the long-term, as long as the price is staying above this area and the parabolic support line, we are considering its long-term movement bullish and presuming that it will get to 53,000 satoshis. In any case, a stop loss can be placed below 34,000 satoshis to minimize losses in case a long-term reversal occurs.
To conclude, as long as the price is trading inside the ascending channel, we will consider its short-term movement bullish. A breakdown from the channel would likely take the price to the 36,000 satoshi support area.
In the long-term, as long as the price is staying above this area and the parabolic support line, we are considering its long-term movement bullish and presuming that it will get to 53,000 satoshis. In any case, a stop loss can be placed below 34,000 satoshis to minimize losses in case a long-term reversal occurs.
Disclaimer
In line with the Trust Project guidelines, this price analysis article is for informational purposes only and should not be considered financial or investment advice. BeInCrypto is committed to accurate, unbiased reporting, but market conditions are subject to change without notice. Always conduct your own research and consult with a professional before making any financial decisions. Please note that our Terms and Conditions, Privacy Policy, and Disclaimers have been updated.

Valdrin Tahiri
Valdrin discovered cryptocurrencies while he was getting his MSc in Financial Markets from the Barcelona School of Economics. Shortly after graduating, he began writing for several different cryptocurrency related websites as a freelancer before eventually taking on the role of BeInCrypto's Senior Analyst.
(I do not have a discord and will not contact you first there. Beware of scammers)
READ FULL BIO
Sponsored
Sponsored