EOS Highlights
- USD
- There is resistance at $6 & $8.
- A golden cross has transpired.
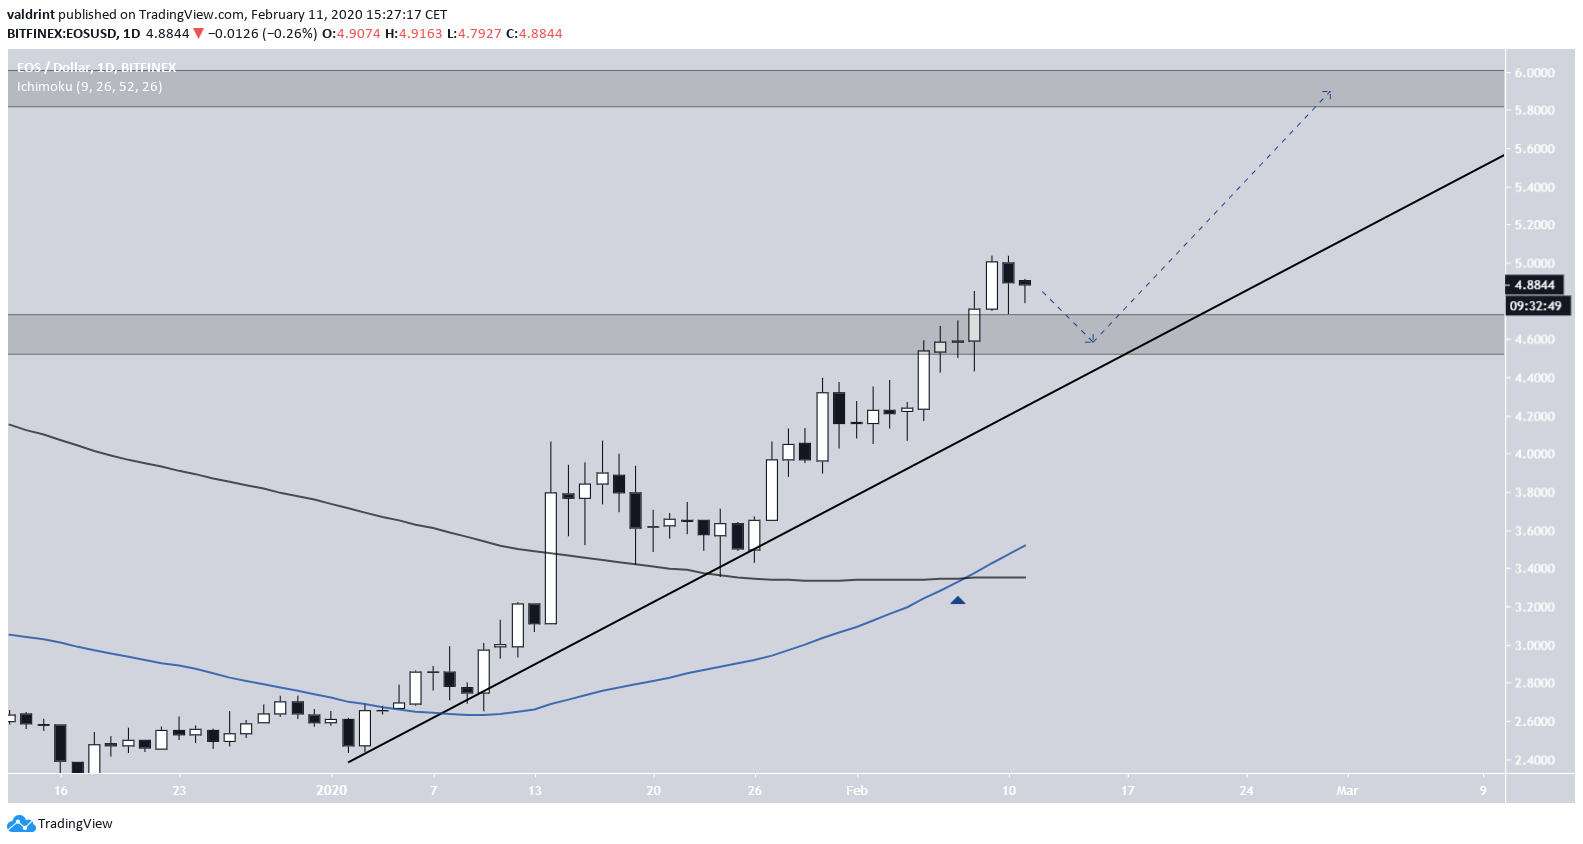
- The price is trading inside an ascending channel.
- BTC
- The price broke out from an ascending triangle.
- A golden cross has transpired.
- There is resistance at 57,000 & 78,000 satoshis.
Let’s take a closer look at the EOS price and see how likely it is to get there. We will analyze both the EOS/BTC and EOS/USD pairs.$EOS
— krillin ॐ (@LSDinmycoffee) February 11, 2020
Charting the USD pair because PA and MA is cleaner, look at these fib levels, so perfect!
I don't see it moon directly here (blue). Could be wrong, but I think this would be a great long here (purple). pic.twitter.com/cIRjz1YVm7
USD Comparison
A look at the EOS/USD chart immediately reveals the importance of the $4.5 level. It acted as support in May 2019, before the price broke down and validated it as resistance in July of the same year. Currently, the price has reached a close above this level and it is likely to use it as support in the future. There is a strong resistance area at $6, but besides that, it seems that the road towards $8 is relatively clear.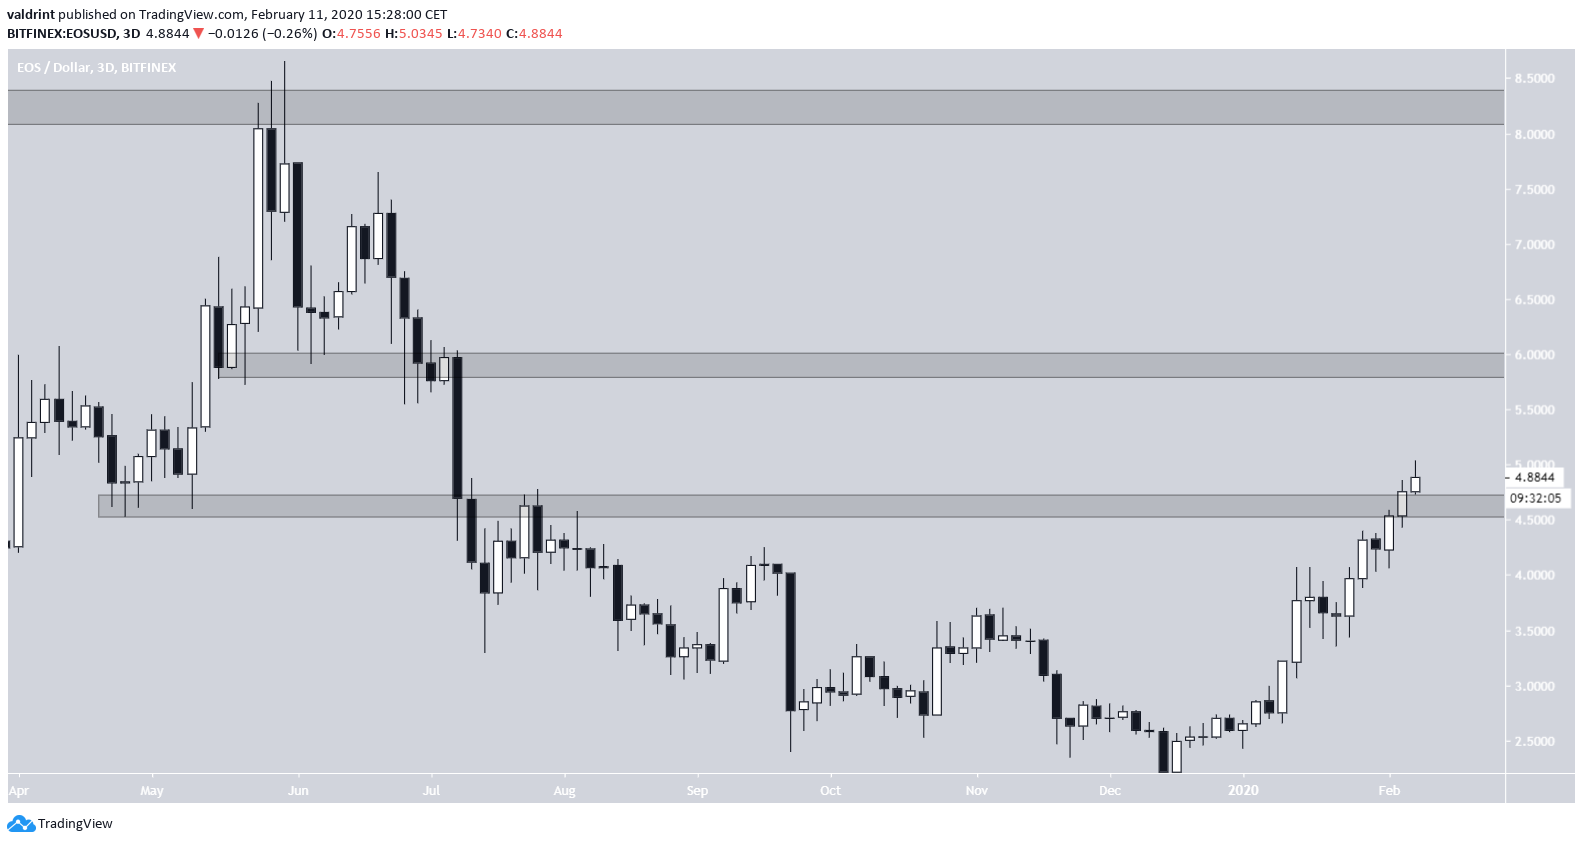 In the shorter-term, we can see that EOS is following an ascending support line and has been doing so since January 1. A slight decrease to $4.5 would serve to validate both the previously mentioned resistance area and this ascending support line, but this is a relatively small decrease which is not certain that will occur. Since the price has yet to show any weakness, it is possible that it will continue moving upward without validating this line/area.
In addition, the 50- and 200-day moving averages (MA) have made a bullish cross, confirming that the price has begun an upward trend. The cross between these particular MAs is otherwise known as a golden cross.
EOS/BTC Comparison
On January 14, the price broke out from the main resistance area of 41,000 satoshis and created an ascending triangle, from which it broke out on February 4. The price has been increasing since. Similar to the EOS/USD pair, a golden cross has transpired, confirming that the price is in an upward trend. Besides a minor resistance area near the current level, the next major resistance is found at 57,000 satoshis, which at the current Bitcoin price is very close to $6, fitting with the resistance from our EOS/USD analysis.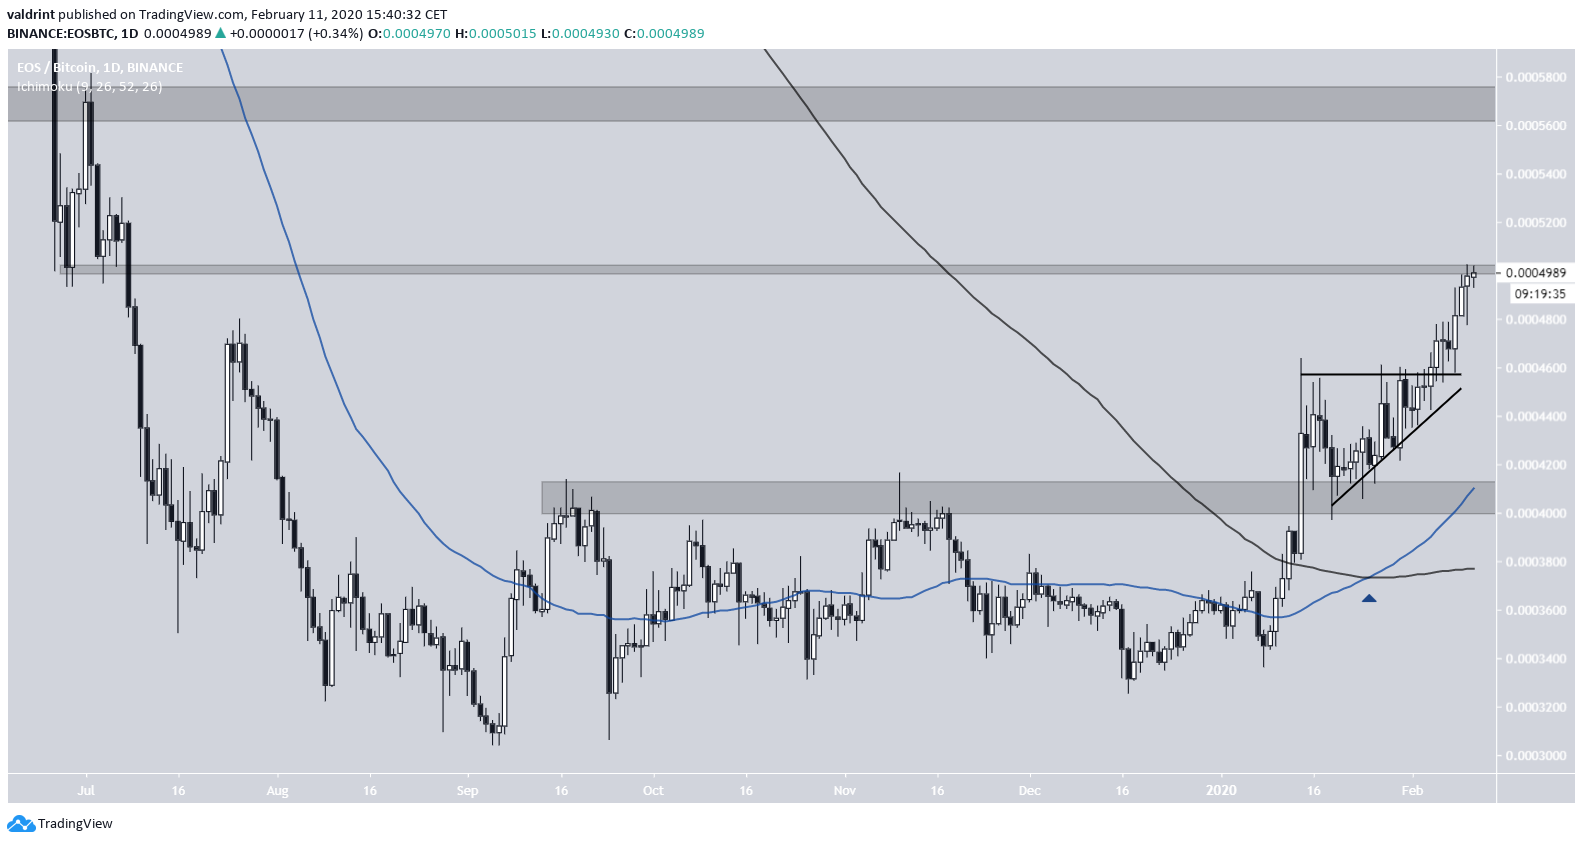 The weekly chart solidifies the importance of the 57,000 satoshi resistance area since it acted as support throughout the entirety of 2018 and reveals another resistance area at 76,000 satoshis, which also fits in with our USD analysis.
Furthermore, the weekly RSI has crossed above 50, confirming once more that the price has begun an upward trend.
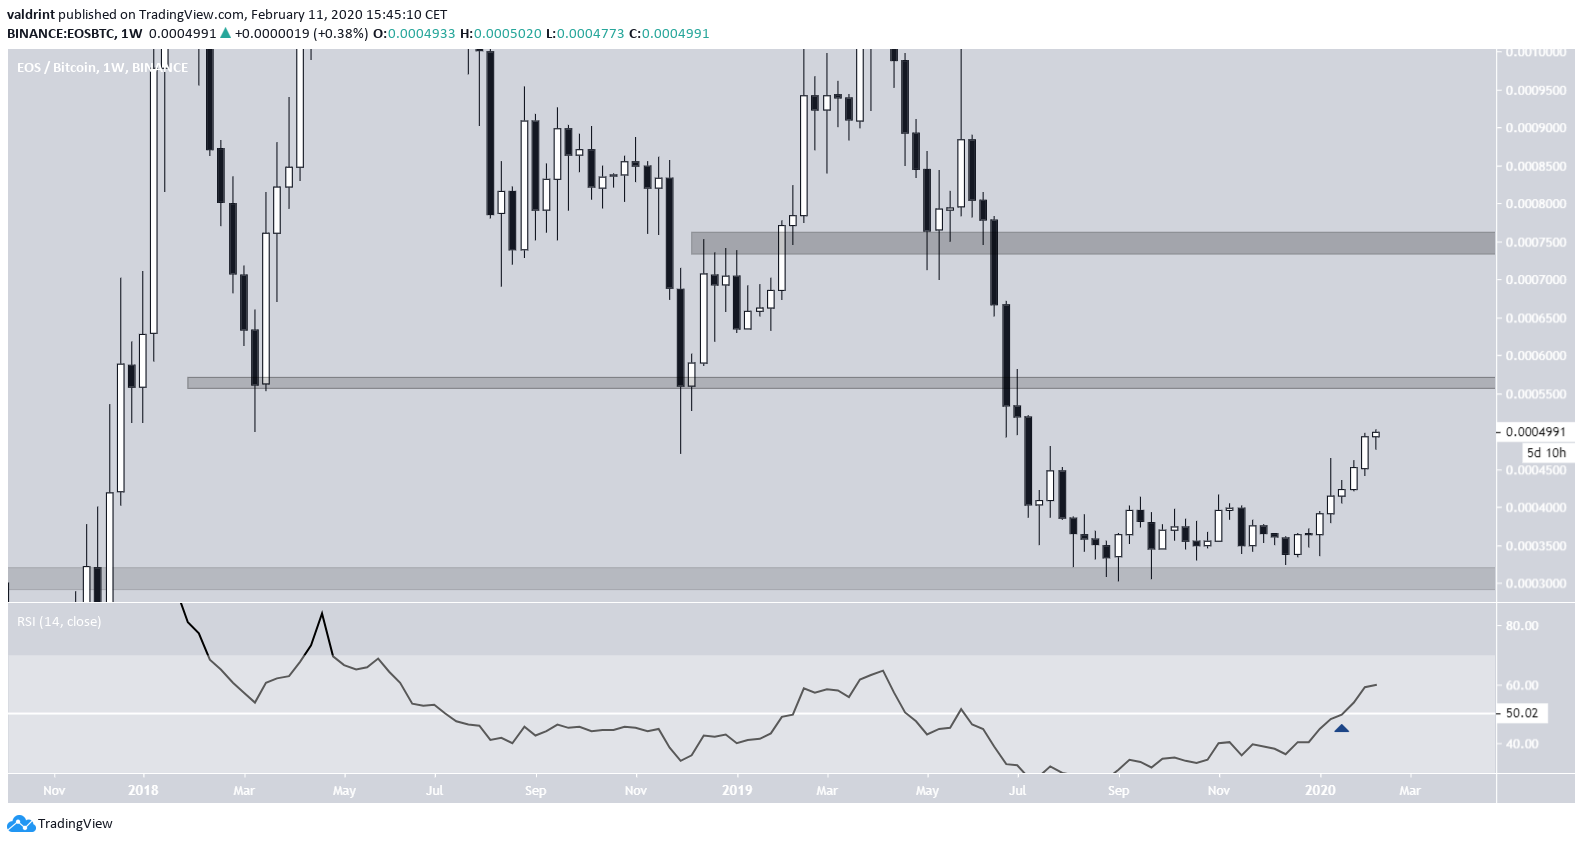 To conclude, both the EOS/USD and EOS/BTC prices have likely begun upward trends. The targets for the end of their respective movements are found at $8 and 76,000 satoshis.
Disclaimer
In line with the Trust Project guidelines, this price analysis article is for informational purposes only and should not be considered financial or investment advice. BeInCrypto is committed to accurate, unbiased reporting, but market conditions are subject to change without notice. Always conduct your own research and consult with a professional before making any financial decisions. Please note that our Terms and Conditions, Privacy Policy, and Disclaimers have been updated.


