

PI’s price has climbed 7% over the last seven days, signaling modest upward momentum. It currently trades at $0.65.
However, technical readings reveal that the rally largely lacks conviction from bullish traders, suggesting the price growth is more reflective of overall market growth than demand for PI.
PI Climbs, But Momentum Stalls
A key indicator supporting this outlook is the Relative Strength Index (RSI), which has remained largely flat despite the price uptick. This indicates a balance between PI’s buying and selling pressure, rather than a surge in bullish sentiment that typically accompanies sustainable rallies.

The RSI indicator measures an asset’s overbought and oversold market conditions. It ranges between 0 and 100. Values above 70 suggest that the asset is overbought and due for a price decline, while values under 30 indicate that the asset is oversold and may witness a rebound.
When it is flat like this, there is a balance between buying and selling pressure, with no clear momentum in either direction. This signals market indecision or consolidation, rather than a strong trend, despite PI’s price hike.
Further, PI’s Super Trend indicator, which continues to act as dynamic resistance above the token’s price, adds to the cautious outlook. This is currently at $0.85
The indicator helps traders identify the market’s direction by placing a line above or below the price chart based on the asset’s volatility.
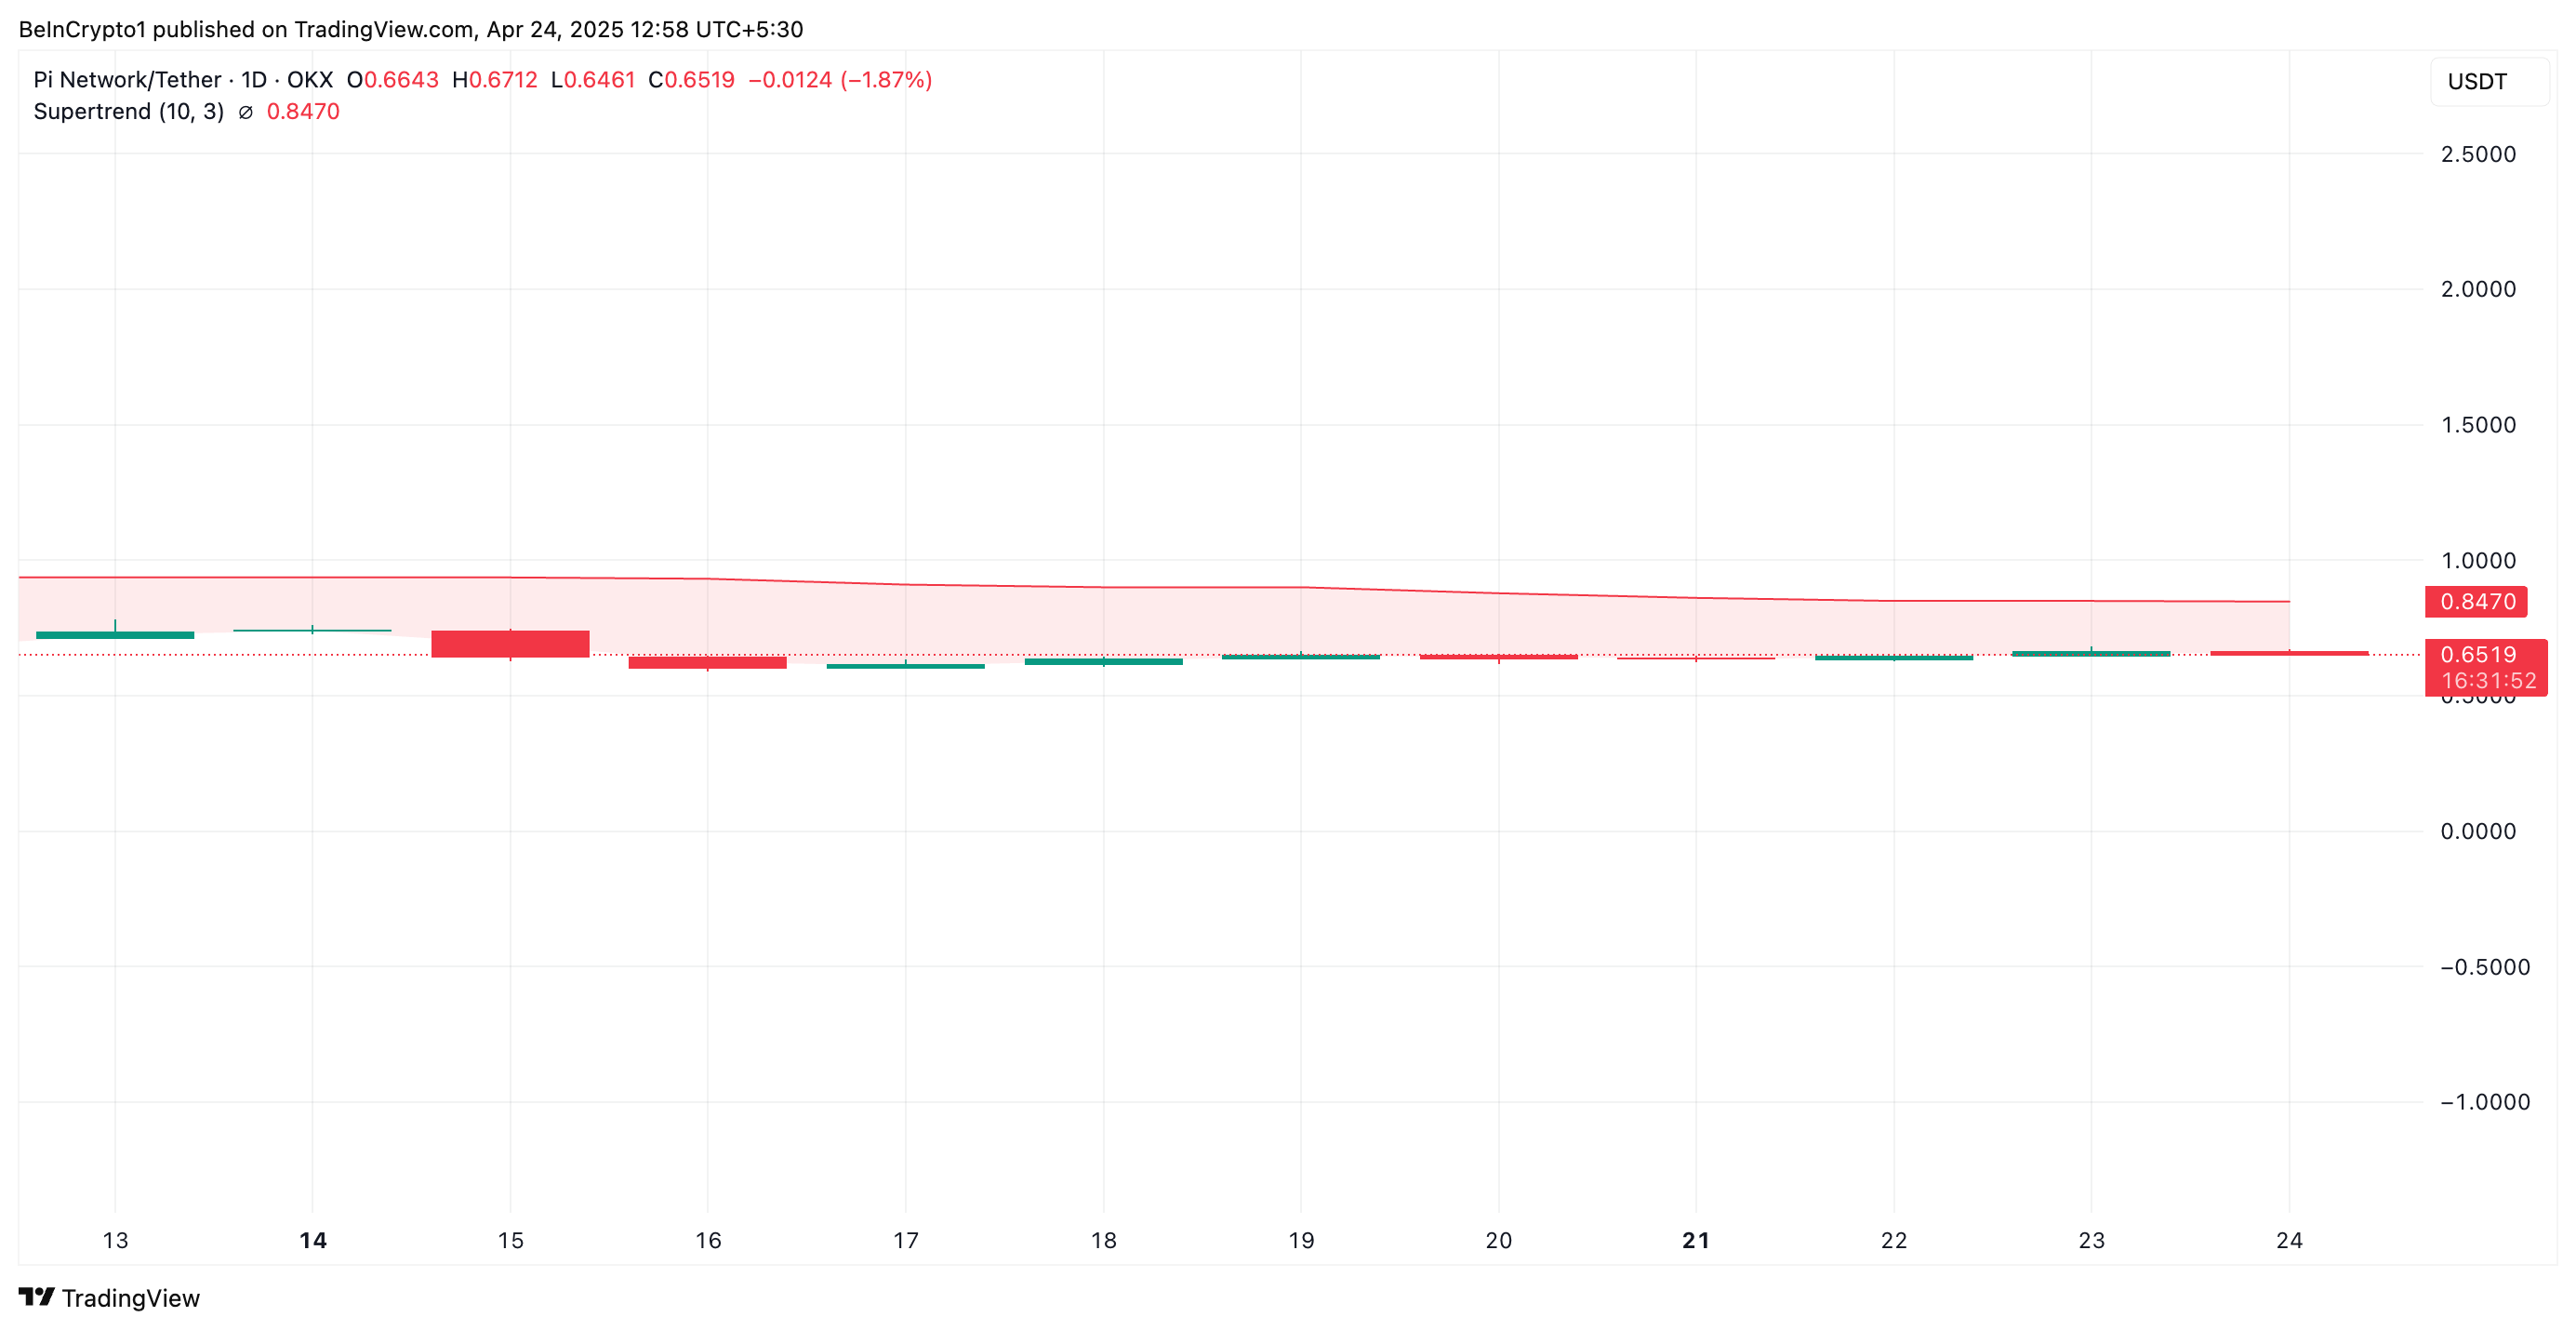
As with PI, when an asset’s price trades below the Super Trend line, it signals a bearish trend, indicating that the market is in a downtrend and selling pressure is dominant.
As PI struggles to break above this level, the trend line reinforces bearish sentiment and suggests pushing the asset higher in the short term will be difficult.
PI Risks Drop to $0.40 Without Renewed Demand
PI currently trades at $0.65, resting below its 20-day exponential moving average (EMA). This indicator measures an asset’s average price over the past 20 trading days, giving more weight to recent prices.
When the EMA is positioned above the asset’s current price, it signals a short-term downtrend, indicating that recent prices are lower than the average of the past 20 days. If demand wanes further, PI could extend its losses and revisit its all-time low of $0.40.
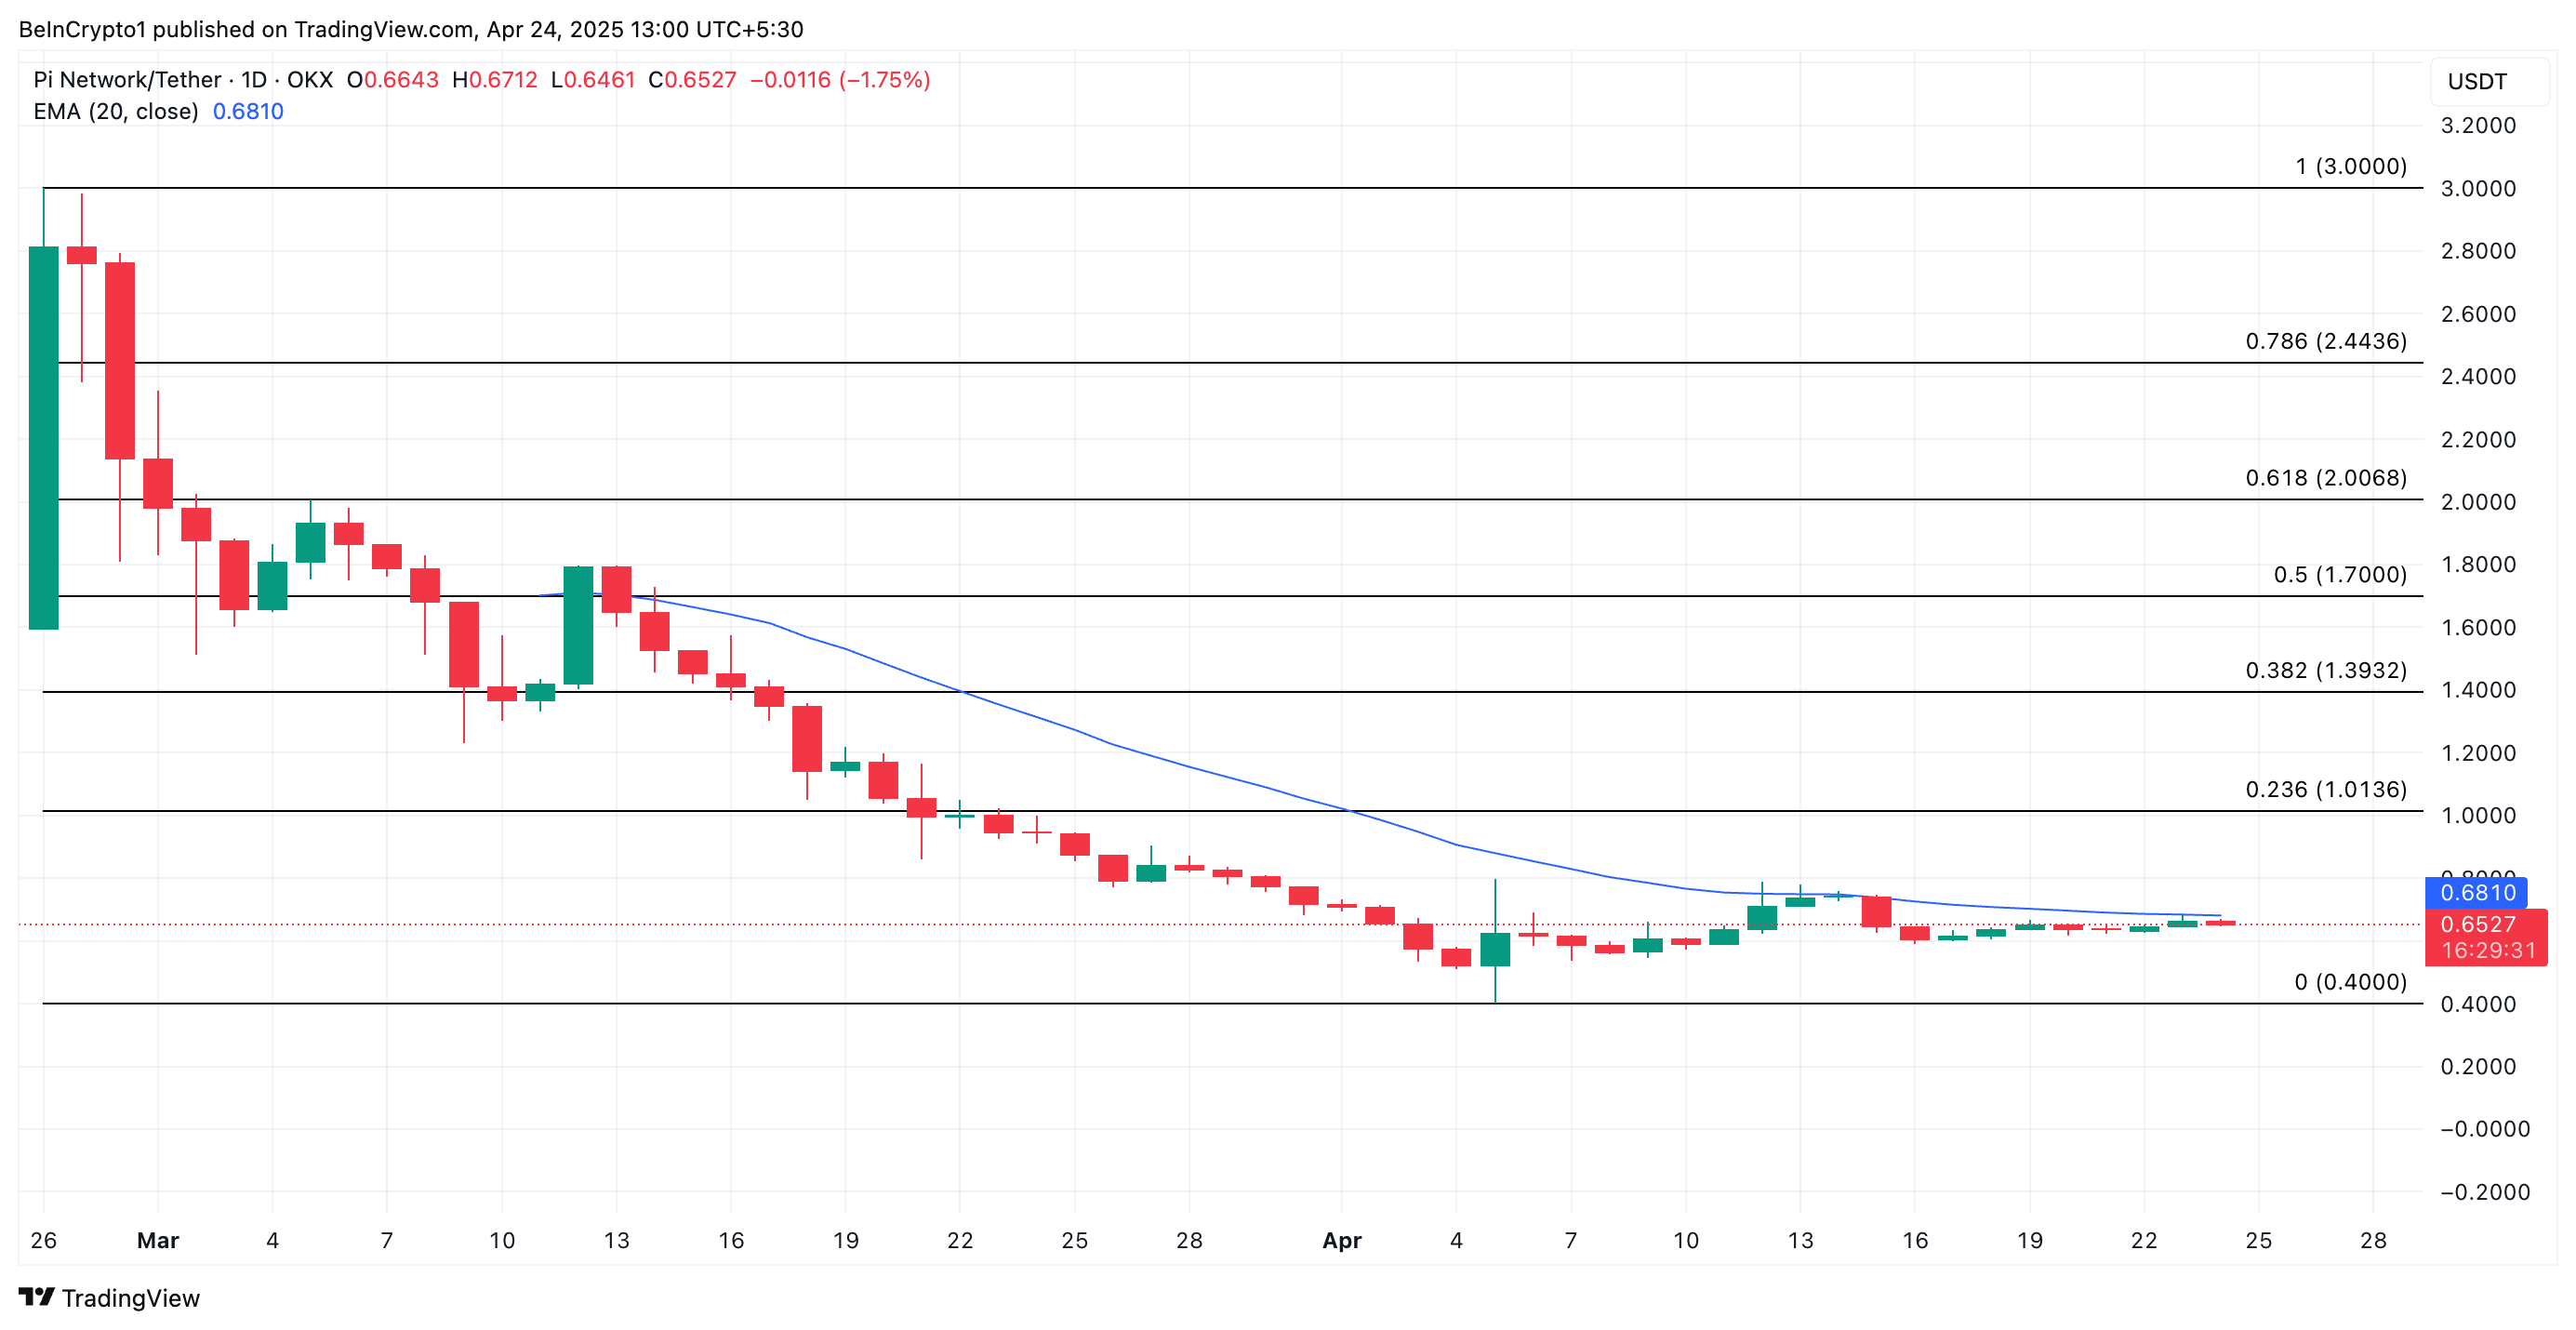
On the other hand, if the bulls regain market dominance, they could drive PI’s value above its 20-day EMA and toward $1.01.
Disclaimer
In line with the Trust Project guidelines, this price analysis article is for informational purposes only and should not be considered financial or investment advice. BeInCrypto is committed to accurate, unbiased reporting, but market conditions are subject to change without notice. Always conduct your own research and consult with a professional before making any financial decisions. Please note that our Terms and Conditions, Privacy Policy, and Disclaimers have been updated.