
![LINK’s Parabolic Increase Continues [Premium Analysis]](https://beincrypto.com/wp-content/uploads/2019/12/bic_chainlink_price_up-750x375.jpg.optimal.jpg)
On January 14, the LINK price validated the previous resistance line and has increased by more than 20% since.
The upward move marked an end to a 53-day downward trend, in which the LINK price decreased by 35%. The price has moved above some minor resistance areas, as outlined by Bitcoin and altcoin trader Euro Sniper (@TheEuroSniper), who posted a LINK price chart in which the price is following a parabola. The next target outlined is given at 32,500 satoshis.
Will the LINK price get there? Let’s take a closer look and find out.$LINK / $BTC
— €uroSniper (@TheEuroSniper) January 16, 2020
Next Target pic.twitter.com/FfdA4ZFQik
Parabola
The LINK chart has been following a parabola for almost the entirety of its price history, since December 2017. The main resistance area is found at 35,000 satoshis. The price has failed to reach a weekly close above this area until now. Once the price has reached it, it has created long upper wicks and decreased, most recently in November 2019. The ensuing price decrease caused LINK to reach the parabola at the beginning of 2020 and the price has been increasing since. We successfully predicted this price increase in our previous article.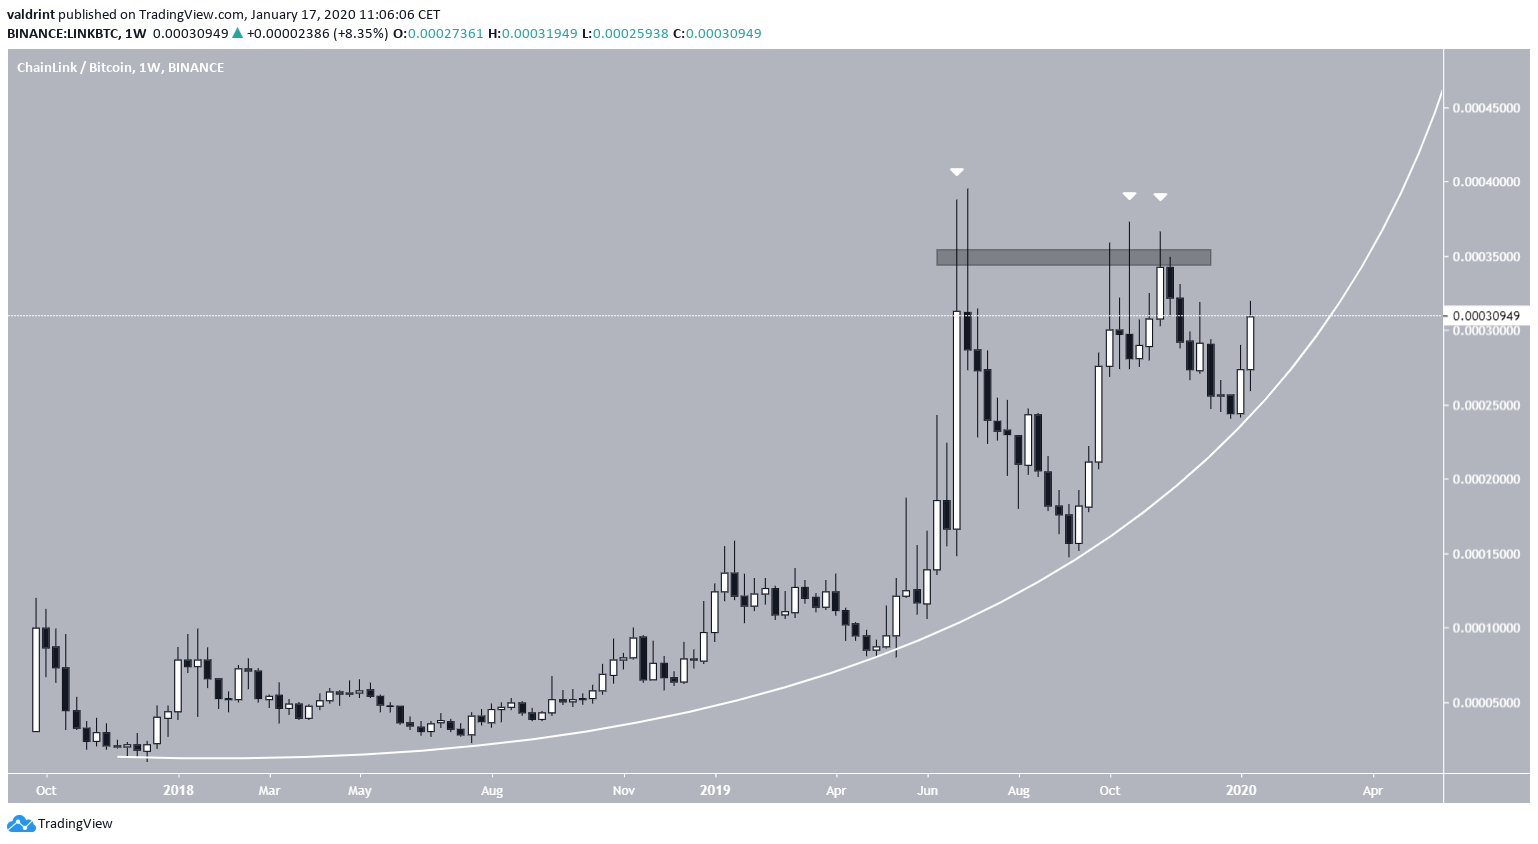
Resistance Validation
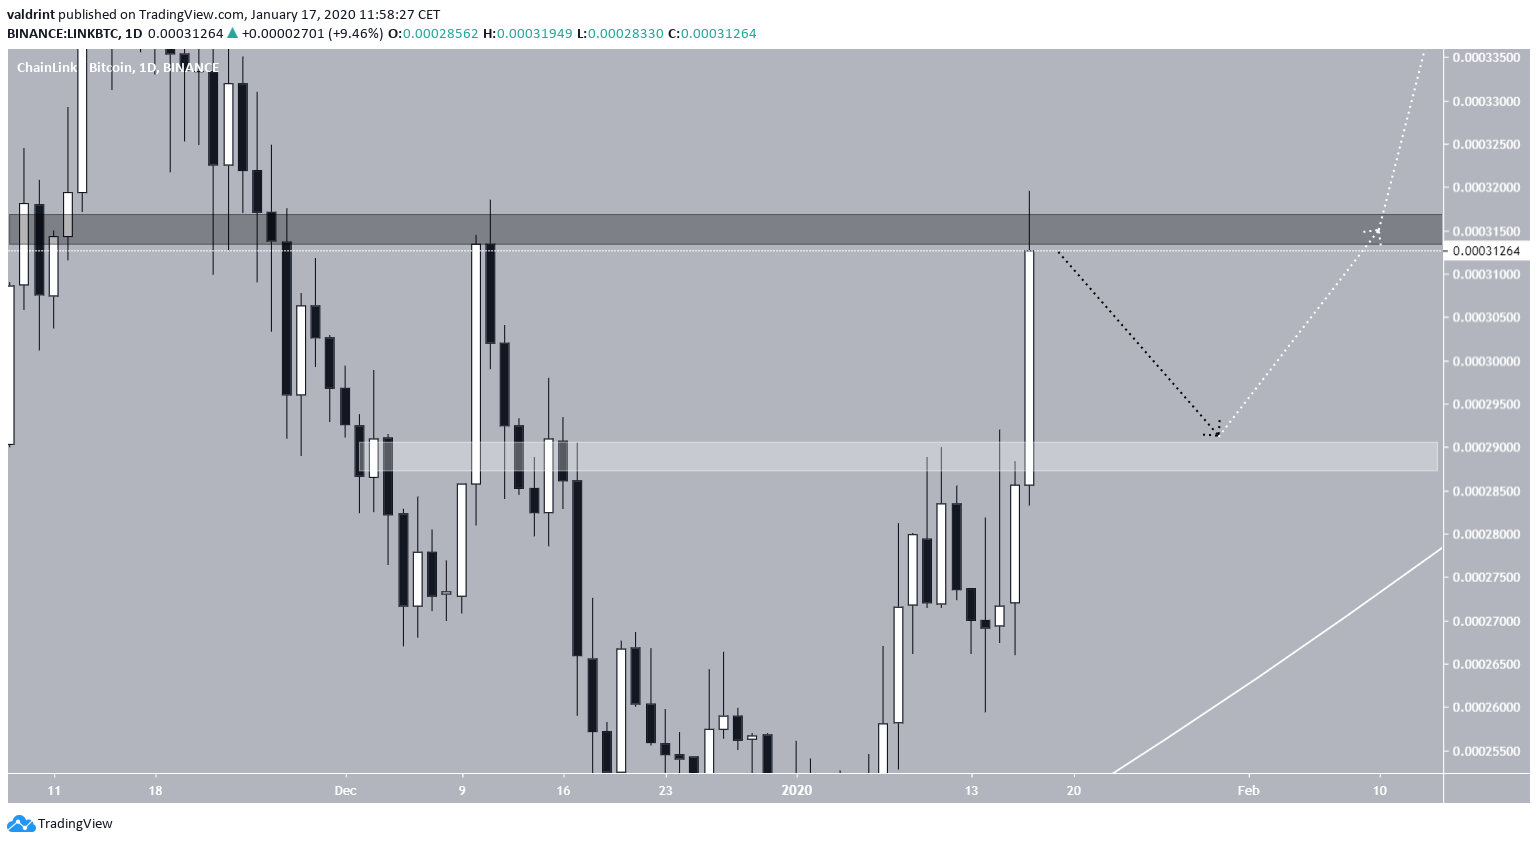
The price had been following a descending resistance line since November 4. On January 9, the price broke out and returned to validate the resistance line on January 13. The price has been increasing since. The bounce on the resistance line coincided with the 200-day moving average (MA). In addition, the recent upward movement has caused the price to increase above the 100-day one, amidst a bullish engulfing candlestick. A retest of the MA and validation as support would be a major bullish development.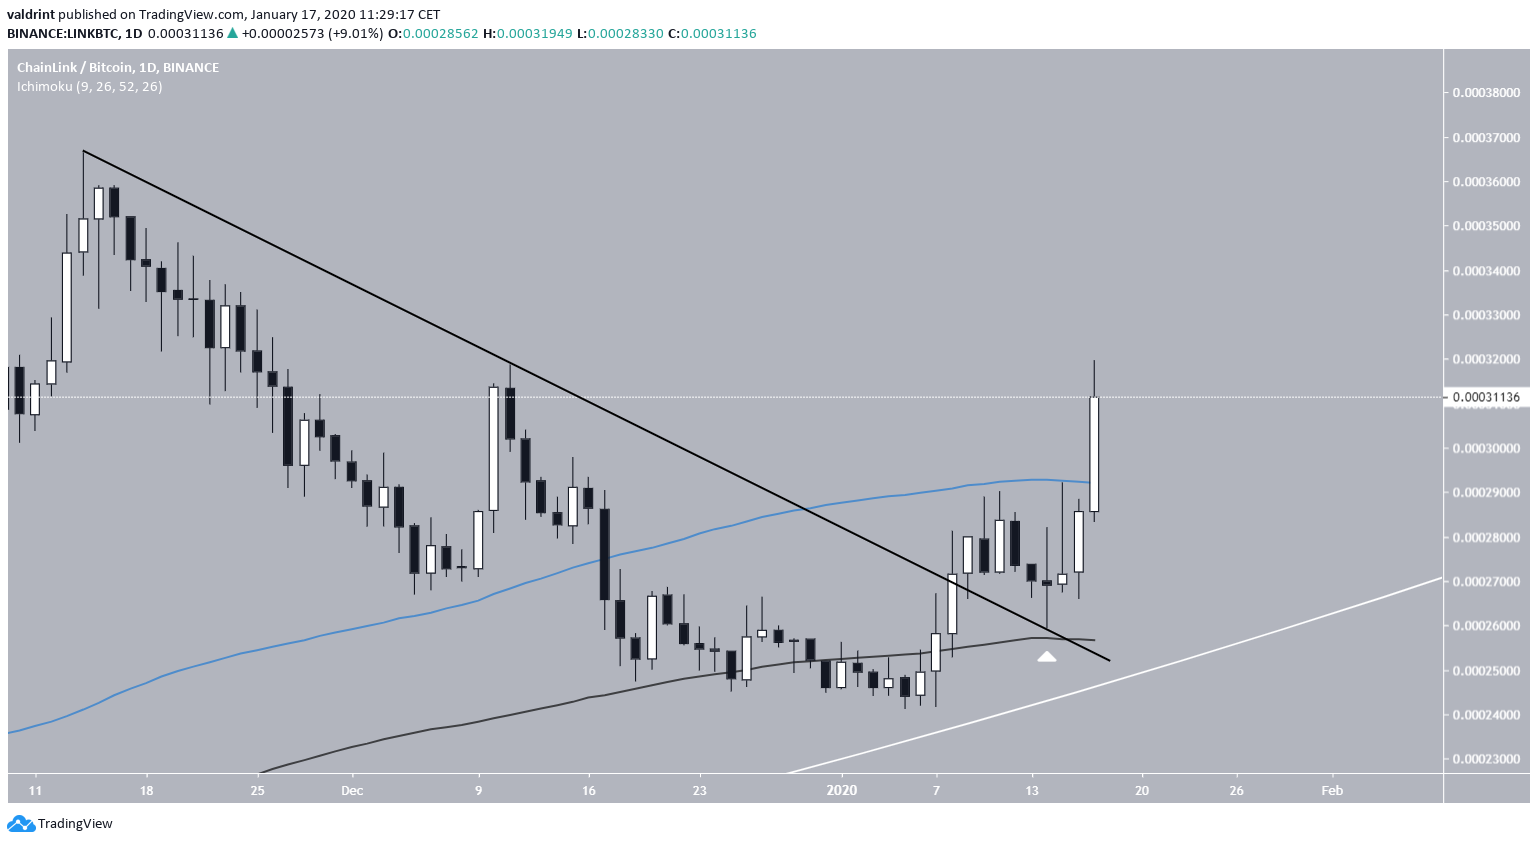 The closest minor resistance and support areas are found at 31,500 and 29,000 satoshis. A common movement would be a retest of the 29,000 area (100-day MA), followed by an eventual breakout above resistance, with a target of 35,000 satoshis.
LINK Future Movement
Looking at the long-term chart, based on the fib levels from the previous decrease, a likely target for a possible breakout is given at 58,000 satoshis. This is to be expected, based on the parabolic rate of increase and possible ascending triangle created along with the resistance area at 35,000 satoshis. In our previous article, the stop loss was placed at 22,000 satoshis, but we have moved it upward at 24,000 since the parabola is ascending. This is done in order to prevent significant losses in case the price breaks down from the parabola, even if we think that is unlikely.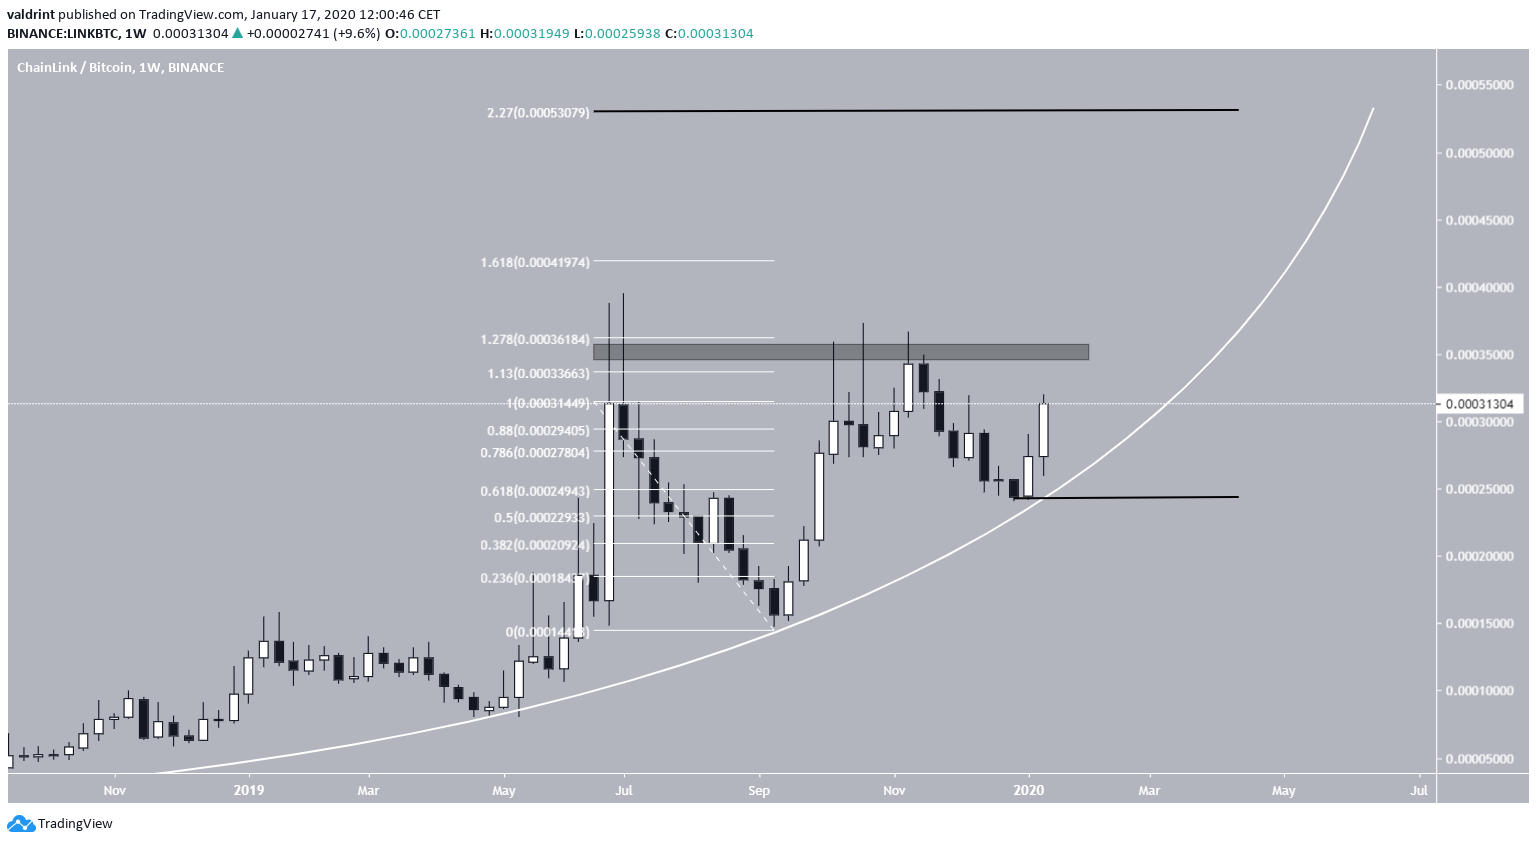 To conclude, the LINK price broke out above a descending resistance line in place since November 2019. It has been increasing since and we believe it will soon make another attempt at breaking out above the 35,000 satoshi resistance area.
Top crypto platforms in the US
Disclaimer
In line with the Trust Project guidelines, this price analysis article is for informational purposes only and should not be considered financial or investment advice. BeInCrypto is committed to accurate, unbiased reporting, but market conditions are subject to change without notice. Always conduct your own research and consult with a professional before making any financial decisions. Please note that our Terms and Conditions, Privacy Policy, and Disclaimers have been updated.

Valdrin Tahiri
Valdrin discovered cryptocurrencies while he was getting his MSc in Financial Markets from the Barcelona School of Economics. Shortly after graduating, he began writing for several different cryptocurrency related websites as a freelancer before eventually taking on the role of BeInCrypto's Senior Analyst.
(I do not have a discord and will not contact you first there. Beware of scammers)
READ FULL BIO
Sponsored
Sponsored