
Since the beginning of February, the relative balance between buying and selling pressure has kept XRP within a narrow price range. It has faced significant resistance at $2.76 and found bullish support at $2.30
However, technical indicators now suggest that this balance may soon tip in favor of the bears, setting the stage for a potential price breakdown.
XRP Struggles to Hold as Sell Pressure Mounts
BeInCrypto’s assessment of the XRP/USD one-day chart reveals that the token’s price has oscillated between $2.76 and $2.30 since February 3. When an asset trades within a range like this, its price moves between a set support and resistance level without breaking out in either direction, indicating a balance between buying and selling pressure.
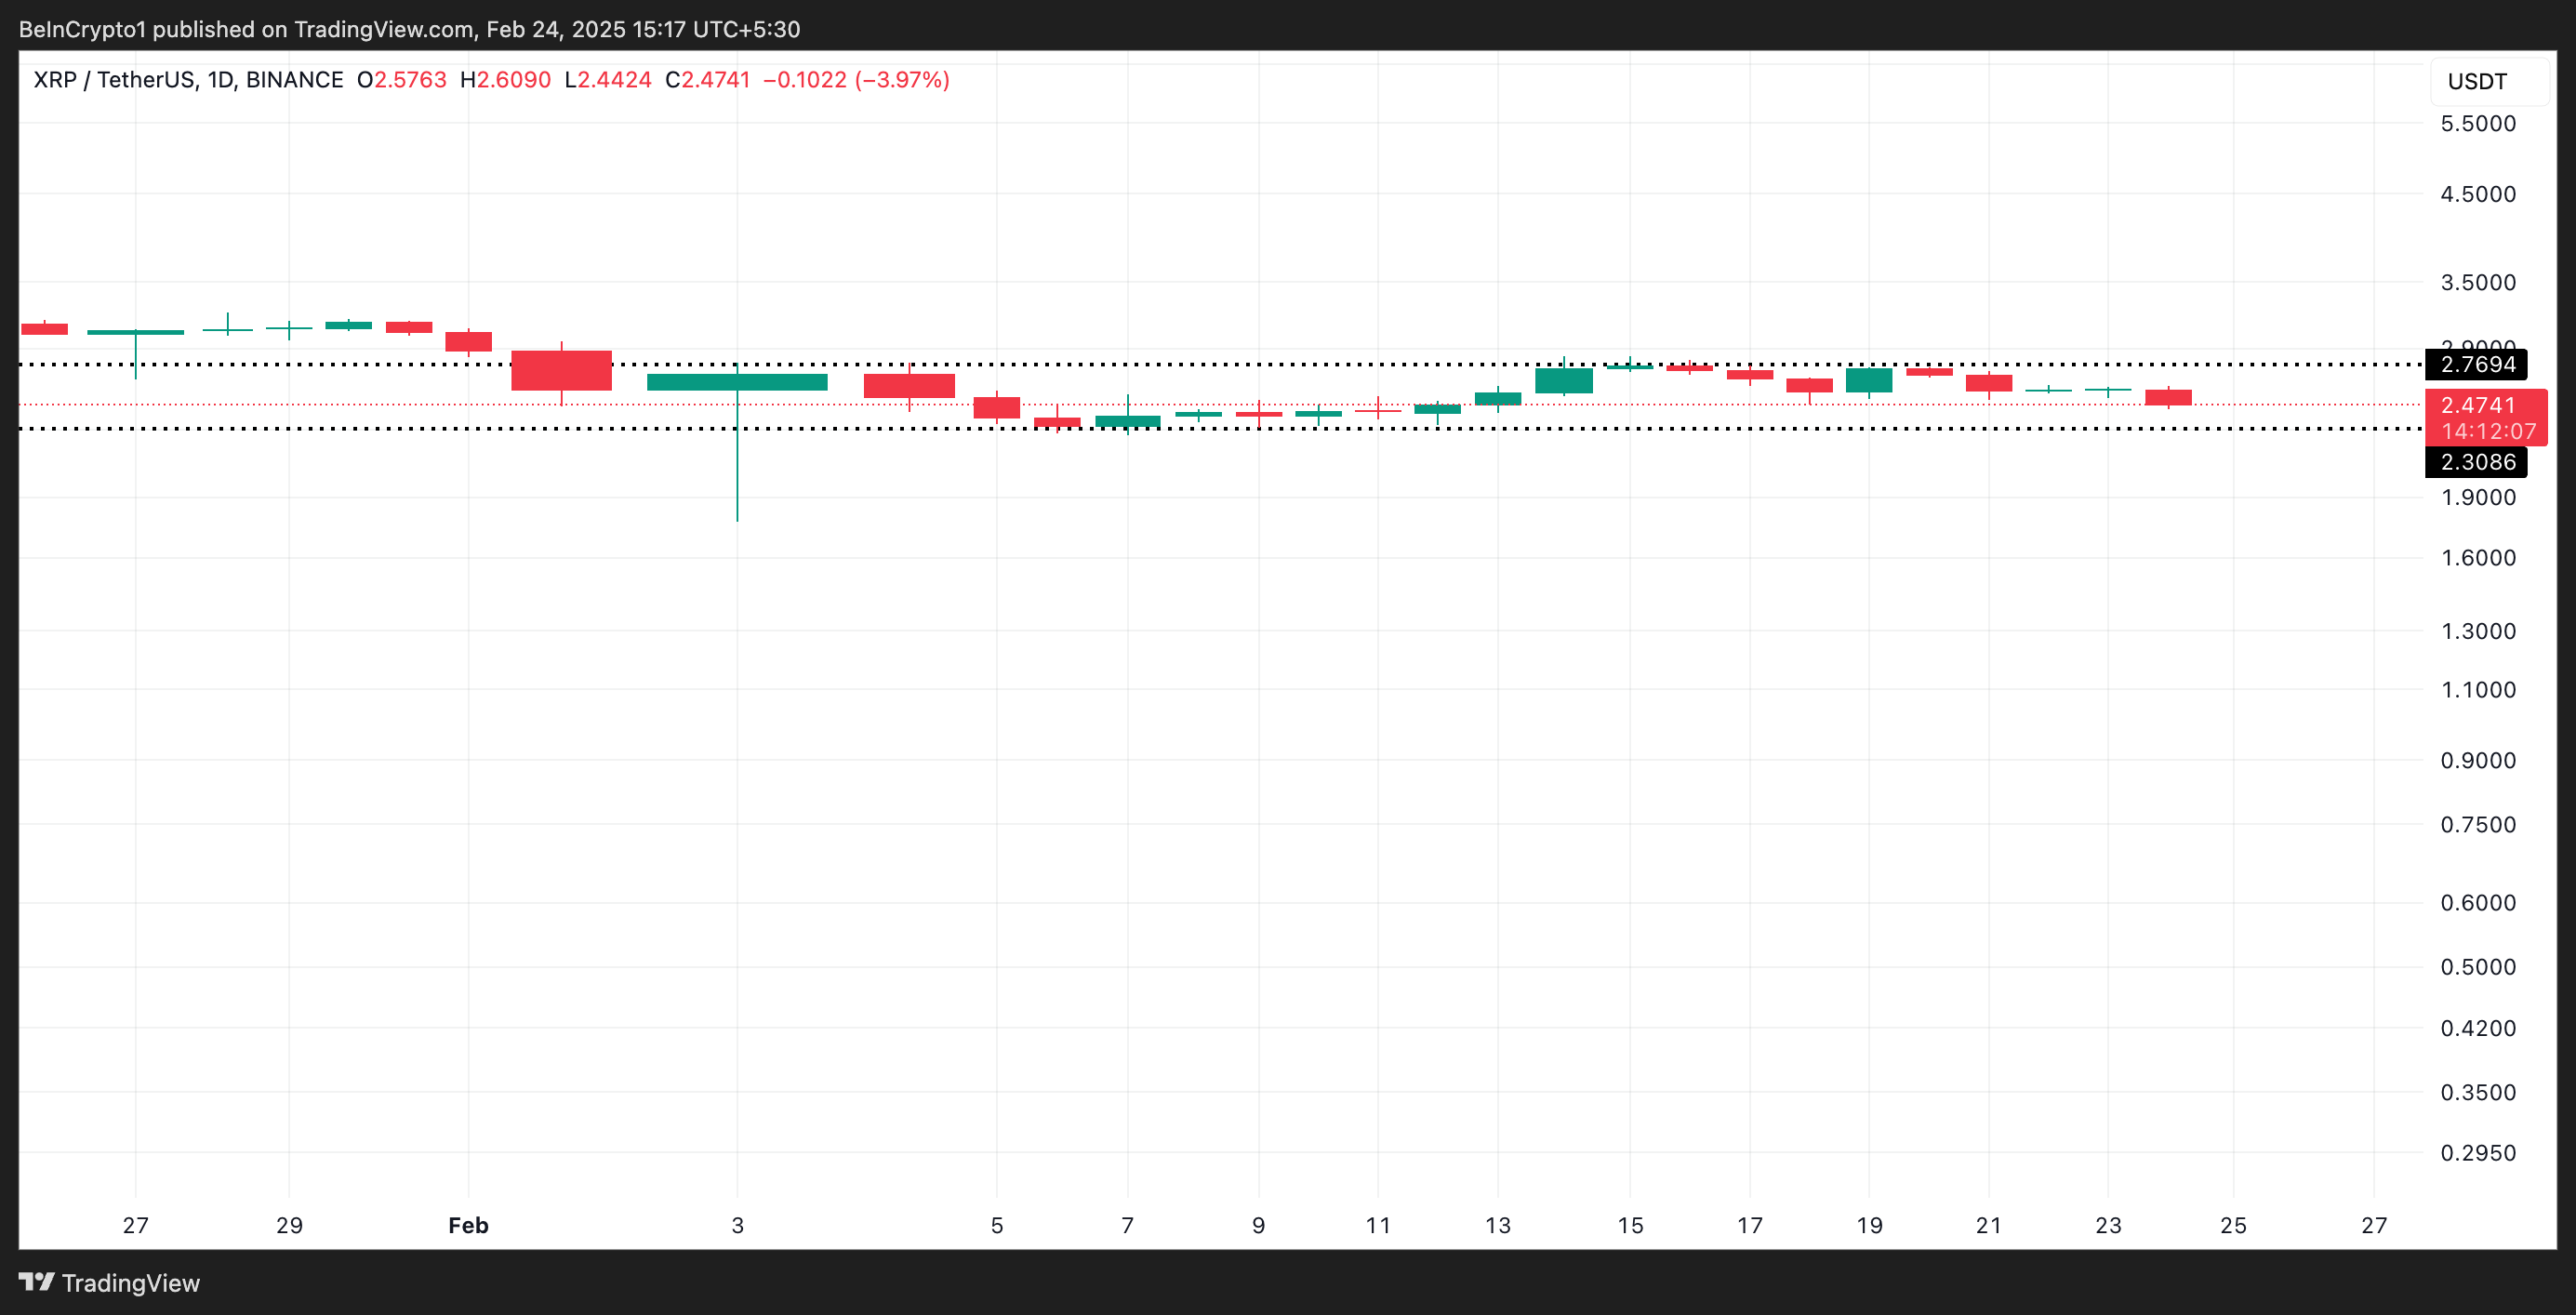
However, the growing bearish bias against XRP hints at a likely breach of the support at $2.30 in the near term. The strengthening selloffs, as highlighted by XRP’s Chaikin Money Flow (CMF), reflect this. At press time, the metric sits below the zero line at -0.04.
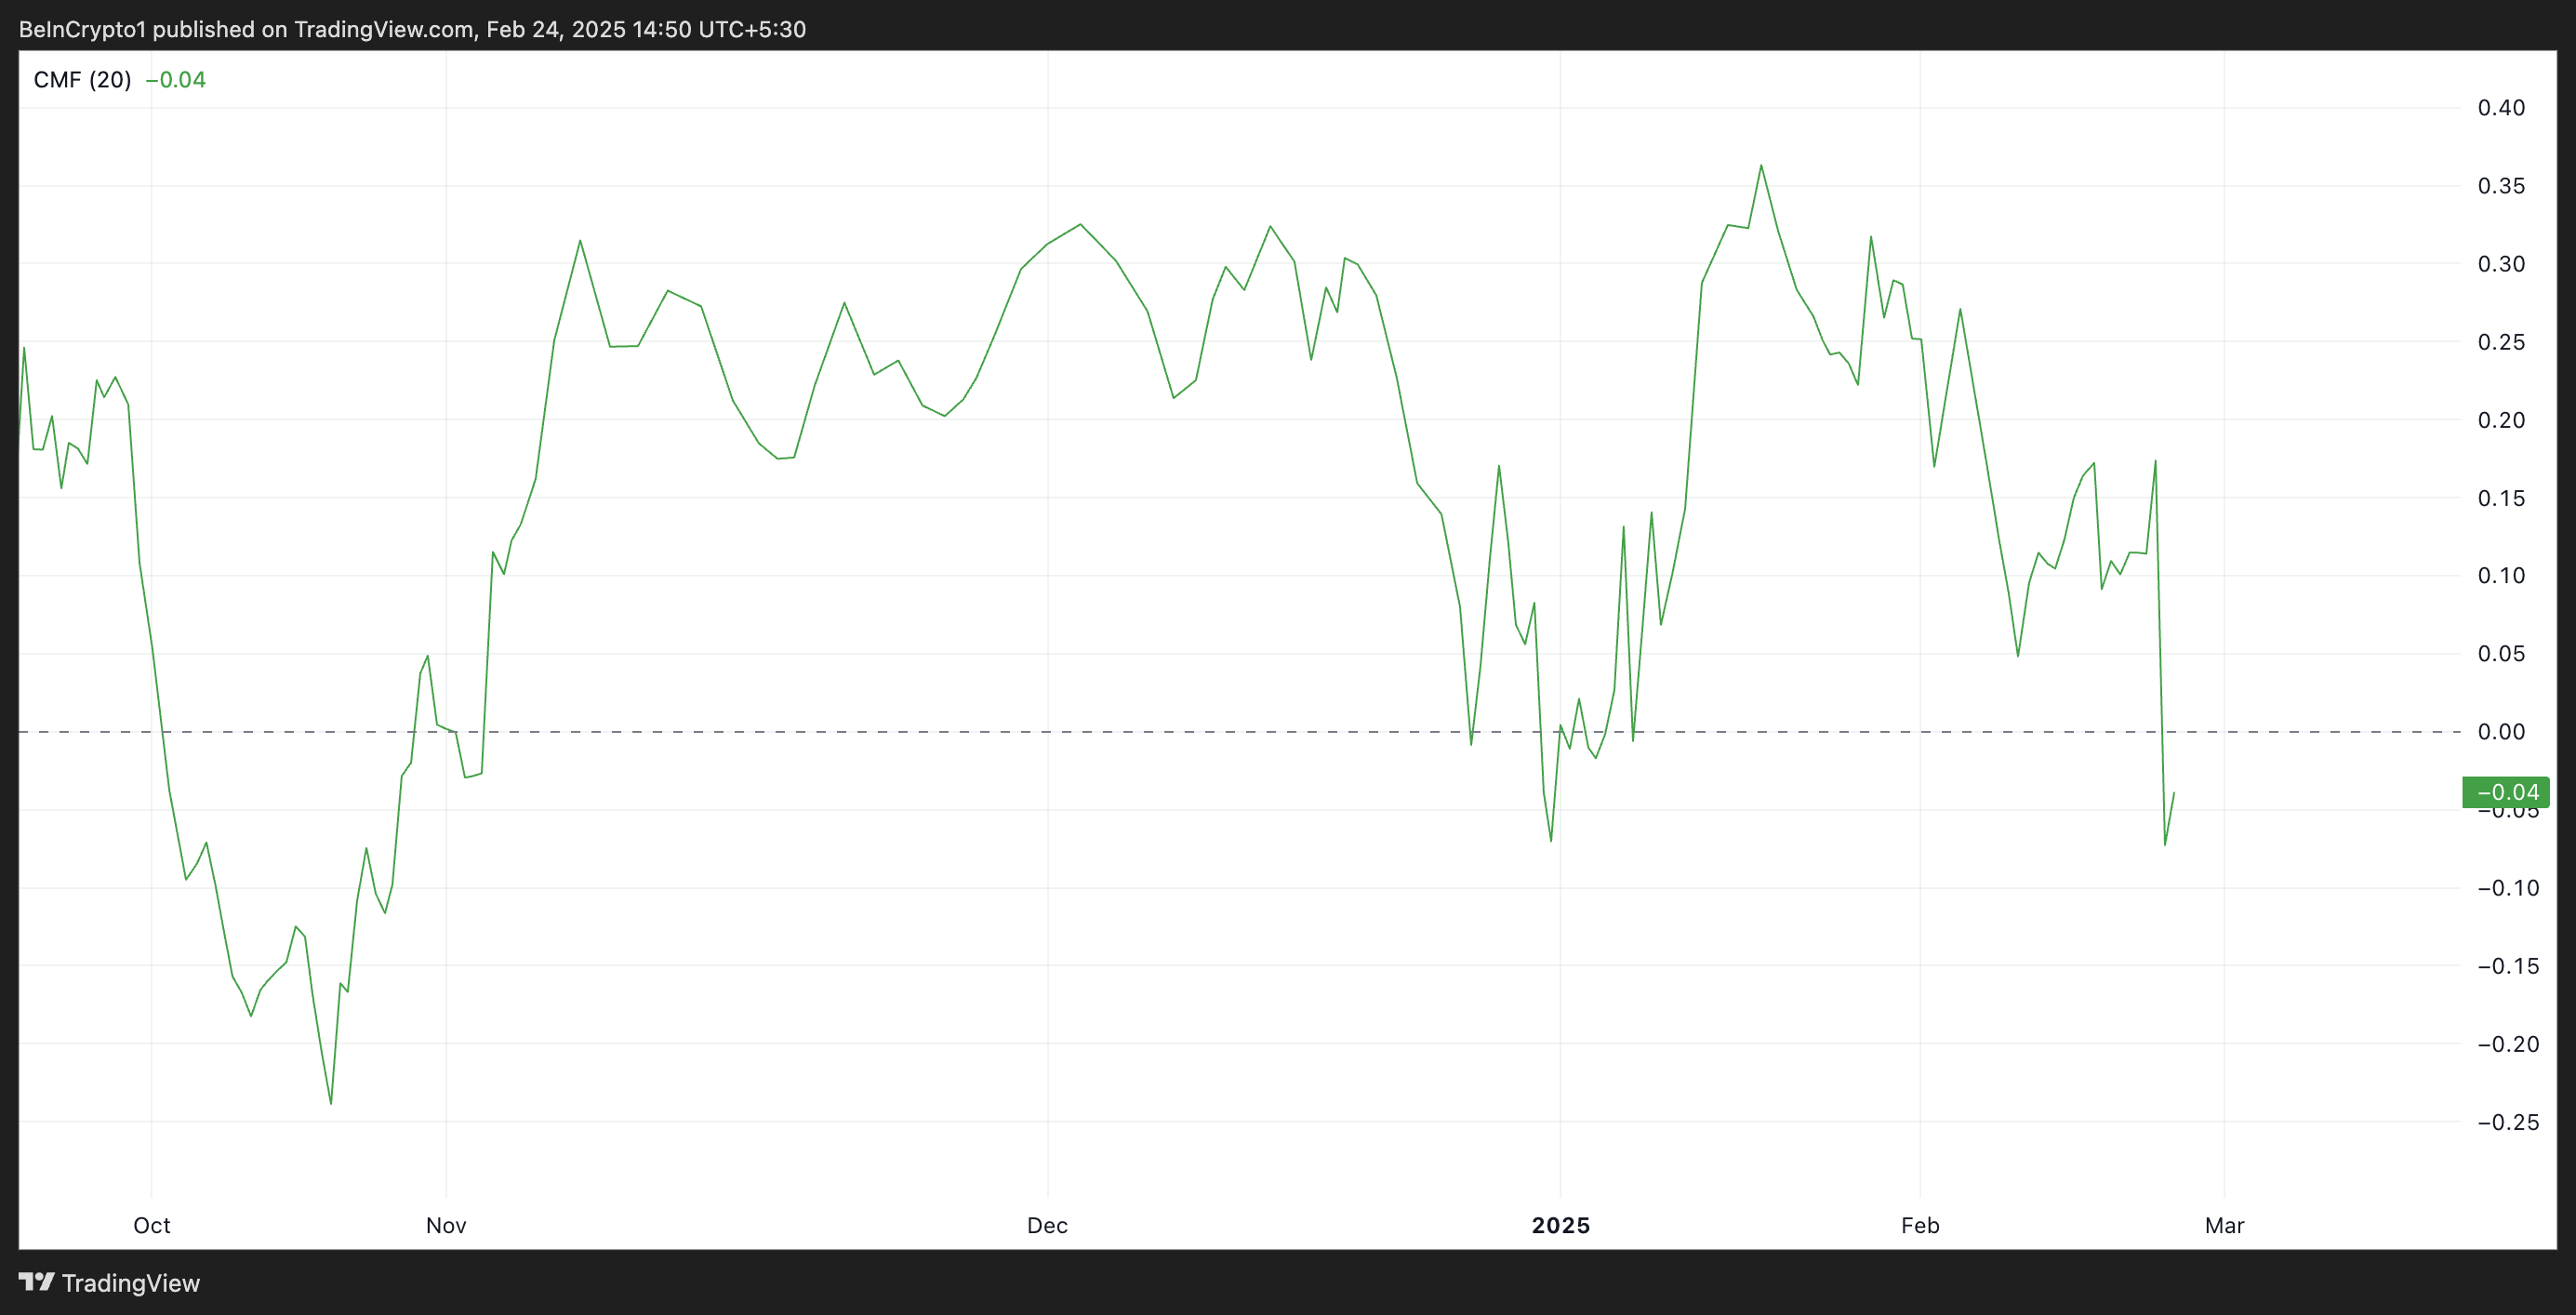
The CMF indicator measures how money flows into and out of an asset by analyzing volume and price movements over a set period. When CMF falls, it suggests that capital is flowing out of the asset as buying pressure weakens.
As with XRP, when an asset’s price consolidates within a range while its CMF is negative, it suggests that despite the sideways movement, selling pressure is dominant. This means traders are distributing the asset rather than accumulating it, even though the price has not yet broken down.
The setup signals a potential bearish breakout, as the lack of strong buying interest in XRP increases the likelihood of a downward move once consolidation ends.
Moreover, the altcoin currently trades below its 20-day exponential moving average (EMA), confirming the rising sell-offs in the XRP market.
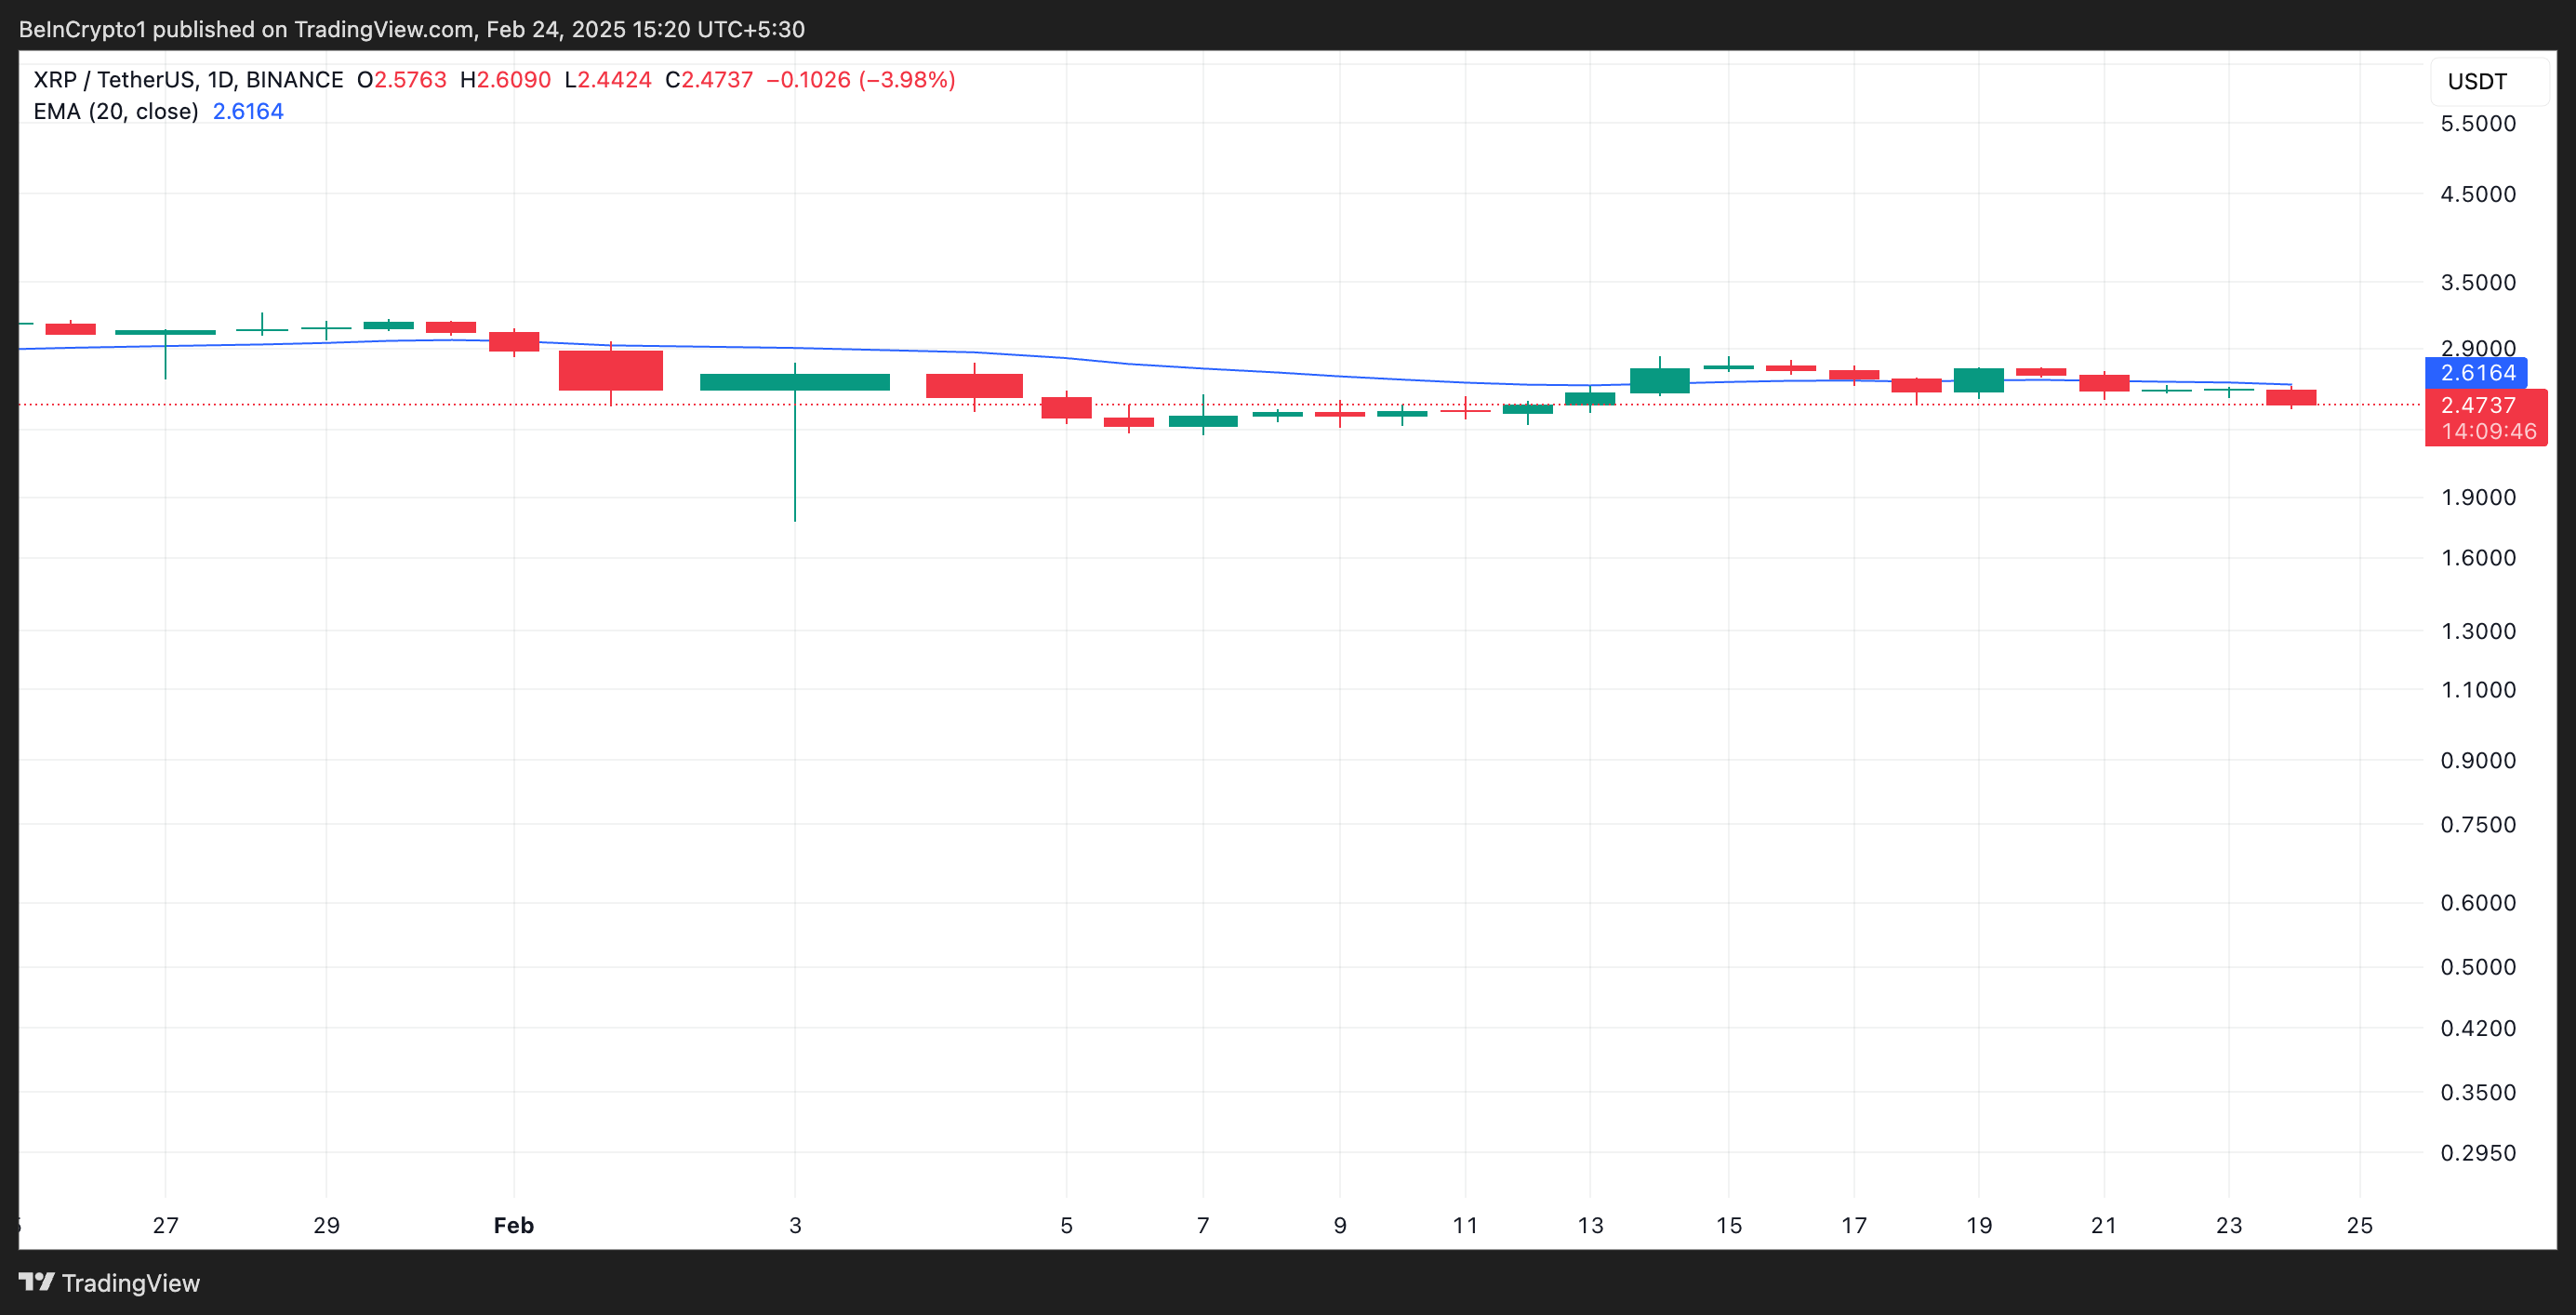
This key indicator measures an asset’s average price over the past 20 trading days by weighting recent price movements. When the price falls under the EMA, it indicates a shift toward a downtrend as selling pressure gains momentum. This hints at a further drop in XRP’s value.
XRP Bears Eye $1.48 as Selling Pressure Mounts
A break below the support at $2.30 could trigger a further decline in XRP’s value. If the bulls fail to defend this level, XRP’s value could plunge to $2.13. Should selloffs strengthen at this level, the decline could extend to $1.48.
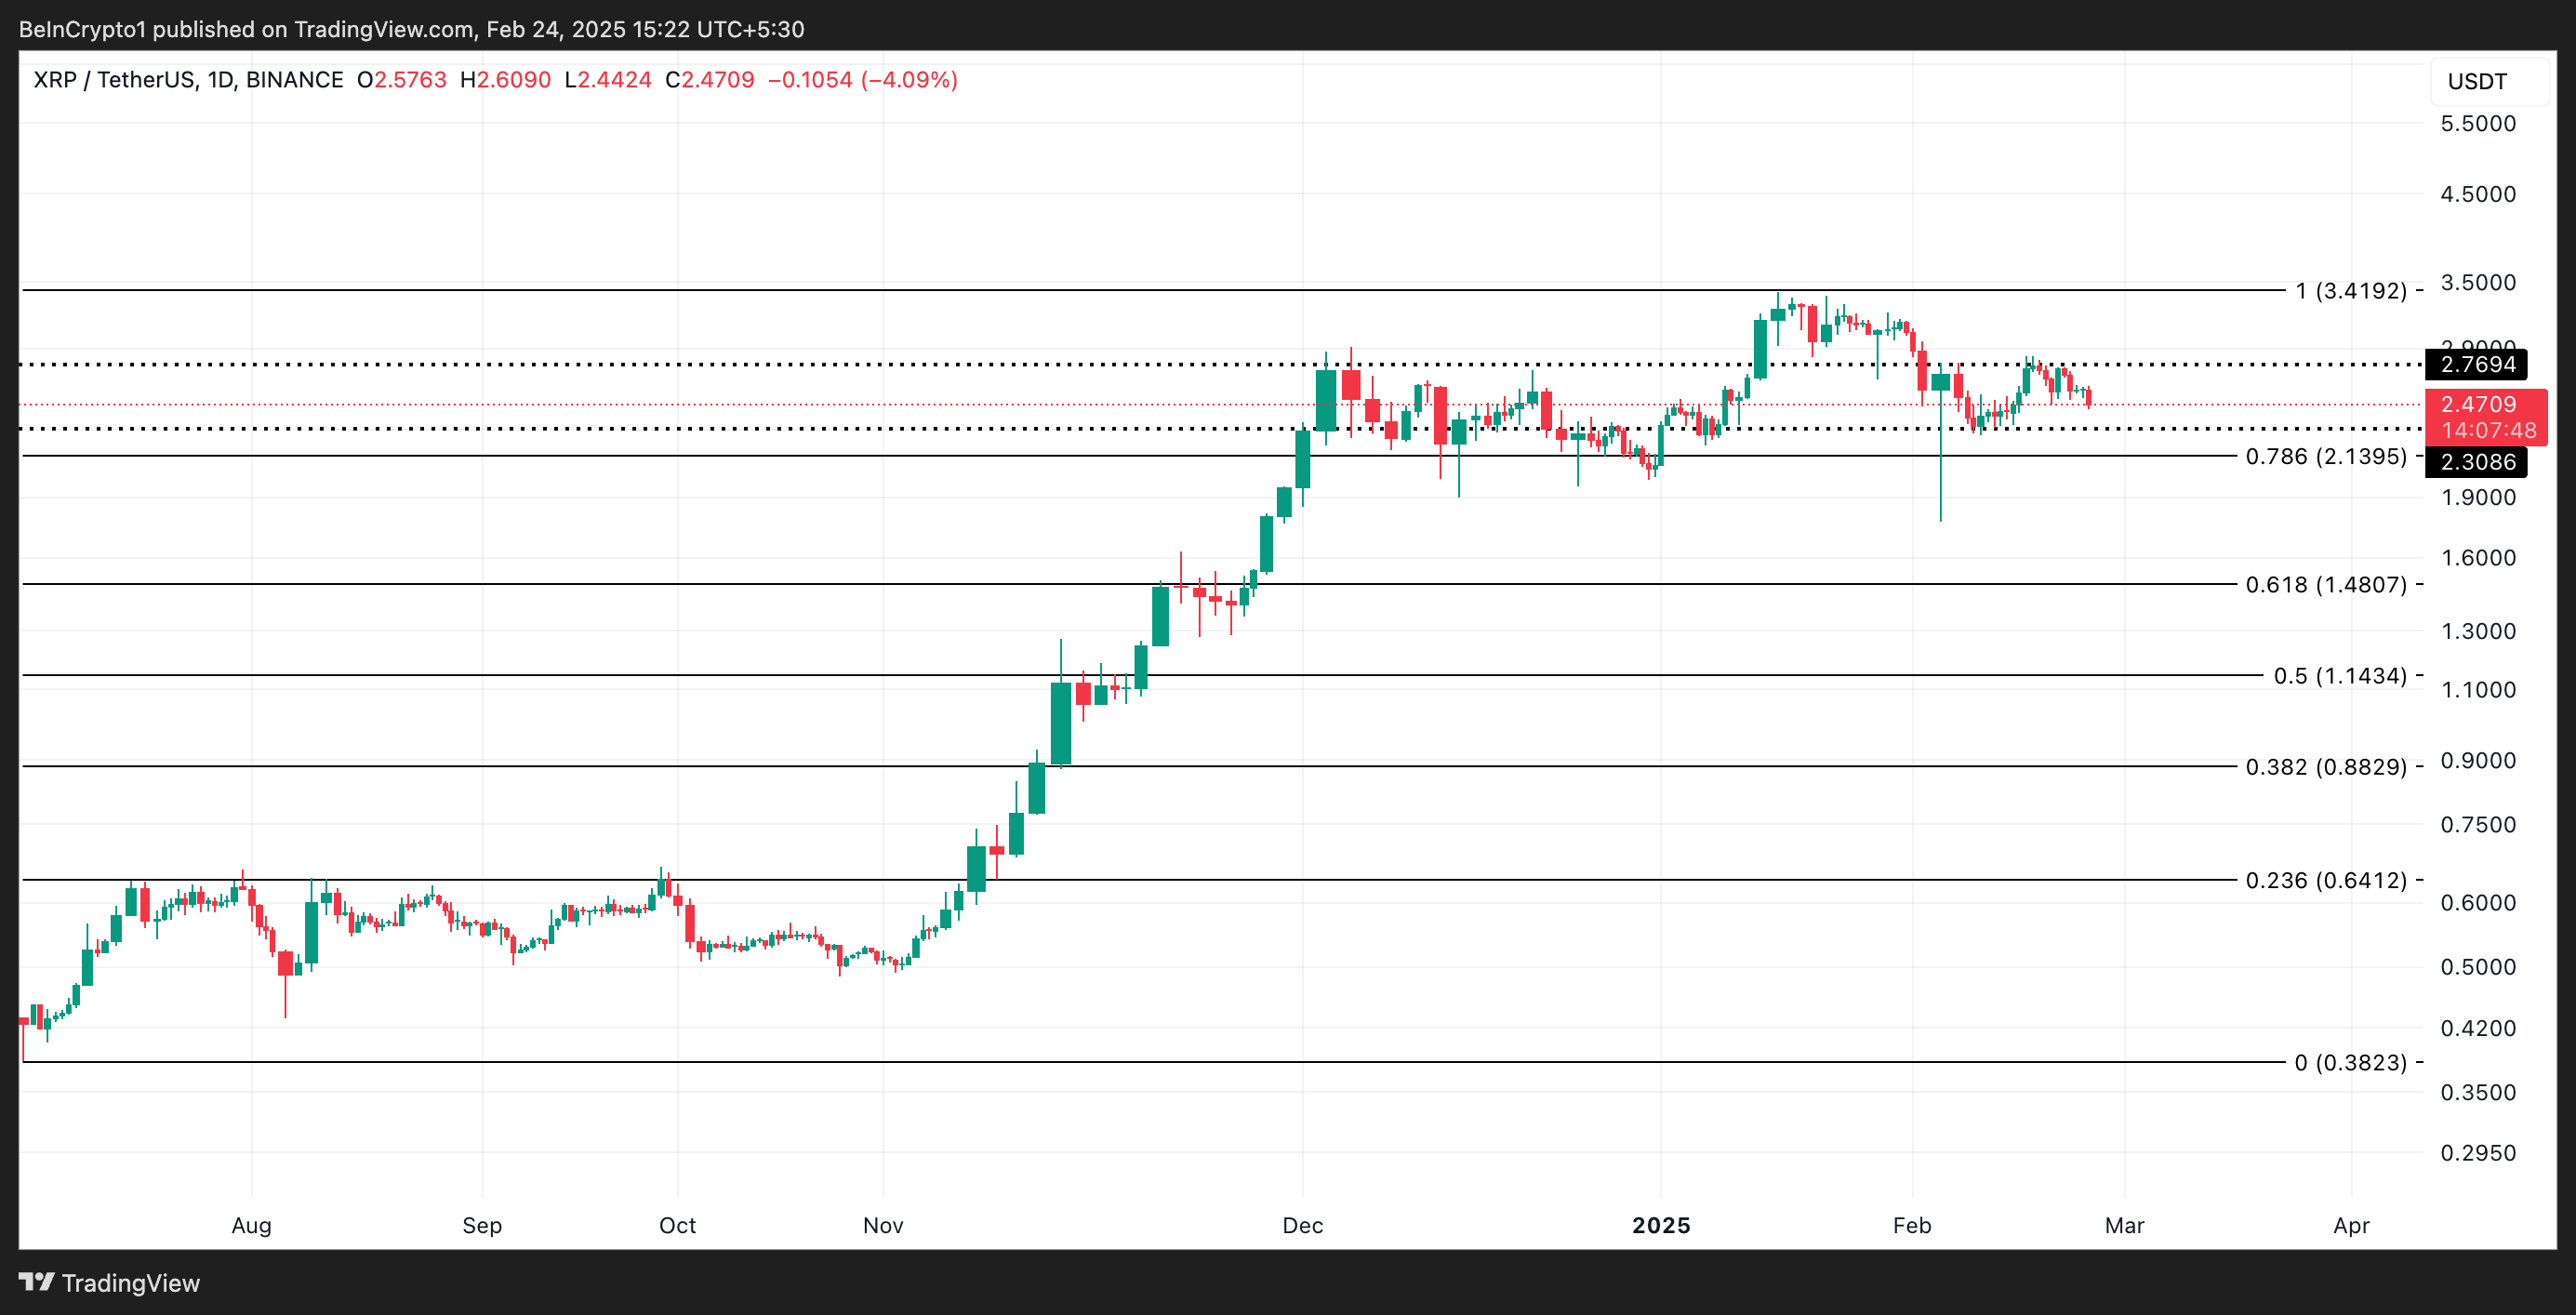
On the other hand, a strong resurgence in XRP demand could invalidate this bearish projection. In that scenario, the token could break above the $2.76 resistance and target its all-time high of $3.41.
Disclaimer
In line with the Trust Project guidelines, this price analysis article is for informational purposes only and should not be considered financial or investment advice. BeInCrypto is committed to accurate, unbiased reporting, but market conditions are subject to change without notice. Always conduct your own research and consult with a professional before making any financial decisions. Please note that our Terms and Conditions, Privacy Policy, and Disclaimers have been updated.