The popularity of DigiByte (DGB) appears to be growing. On Mar 5, 2019, It was the first coin listed on Coveting, a new cryptocurrency exchange. One day earlier, Vertbase was announced as a sponsor for the forthcoming DigiByte Blockchain Summit—scheduled for Apr 19.
These events may bode well for the price–if they can attract enough attention from investors and traders. However, Coveting is still a relatively obscure exchange while Vertbase does not appear to have a large following. It is still unknown whether or not the Blockchain Summit will have any effect on price.
Key Highlights for March 5
- The price of Digibyte (DGB) has been gradually increasing since Feb 7, 2019.
- It reached a top of $0.0126 on Feb 24 before a flash crass caused it rapid price drops. The flash crash affected the entire cryptoasset market.
- DGB is currently trading at $0.0114.
- Price is trading inside a symmetrical triangle.
- There is resistance at $0.012 and $0.0125.
- There is support at $0.01 and $0.009
Cassiopeia Services, official PR for @DigiByteCoin is pleased to announce @vertbase as key sponsor and partner at the first DigiByte Global Summit. https://t.co/7O7iAV3tZs pic.twitter.com/N9KmD4pcd0
— Cassiopeia PR (@Cassiopeia_ltd) March 4, 2019
The Beginning of The Upward Move
The price of DGB on Poloniex is analyzed on 2-hour intervals from Feb 7 to Mar 5.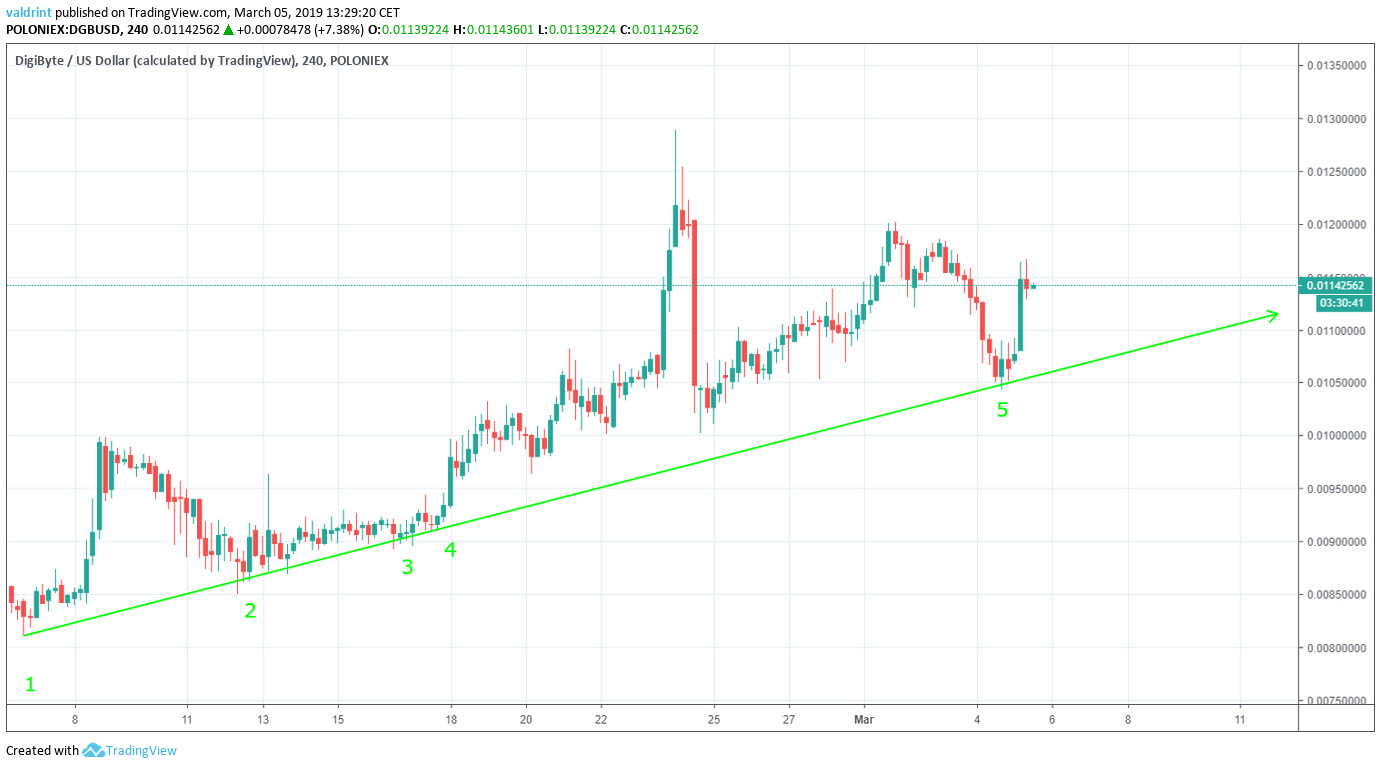
Tracing The Resistance
The descending resistance line is created by inverting the method used for the ascending support line. We trace the descending highs created by the price.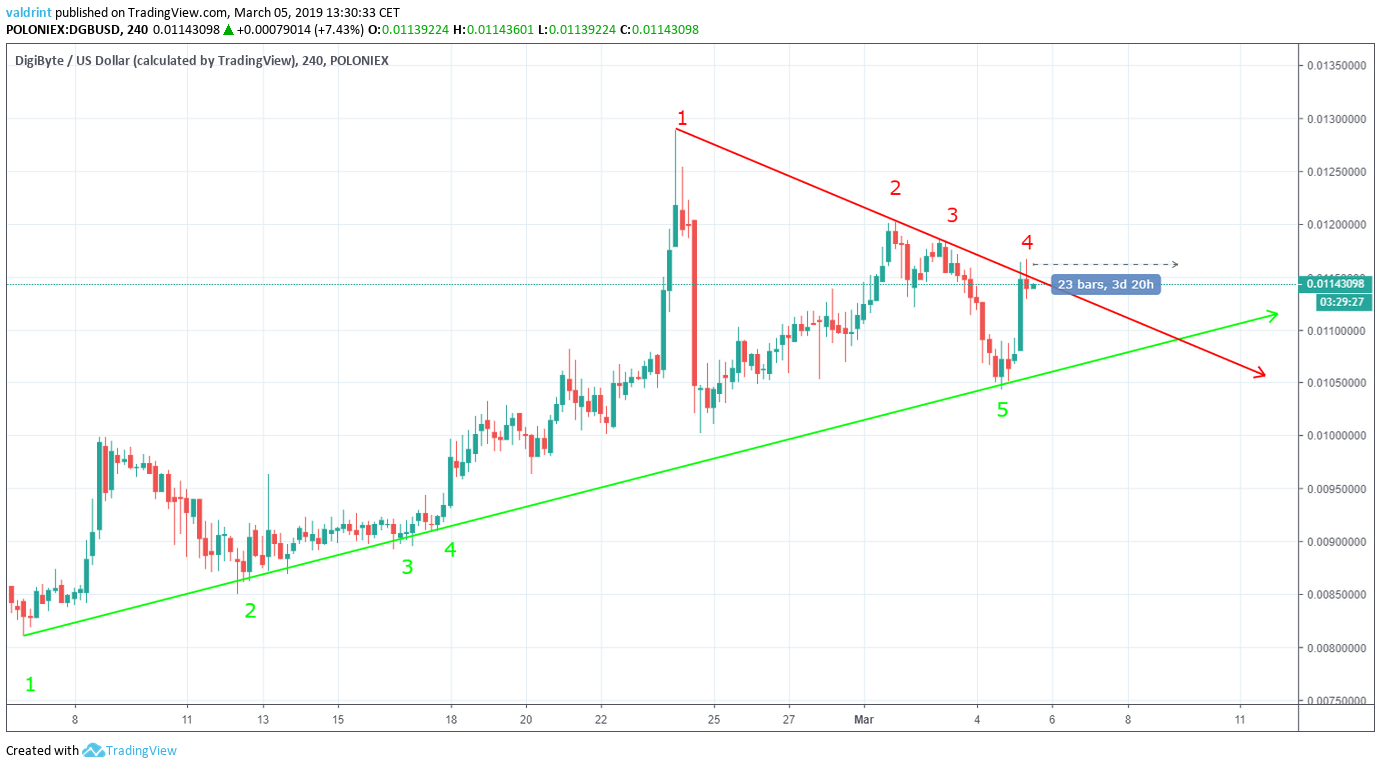
A Look at The Moving Averages
The Moving Average Convergence Divergence (MACD) is a trend indicator that shows the relationship between two moving averages (long and short-term) and the price. It is used to gauge the strength of a move. MACD is positive when the short-term average is above the long-term one and negative when the long-term average is above the short-term average.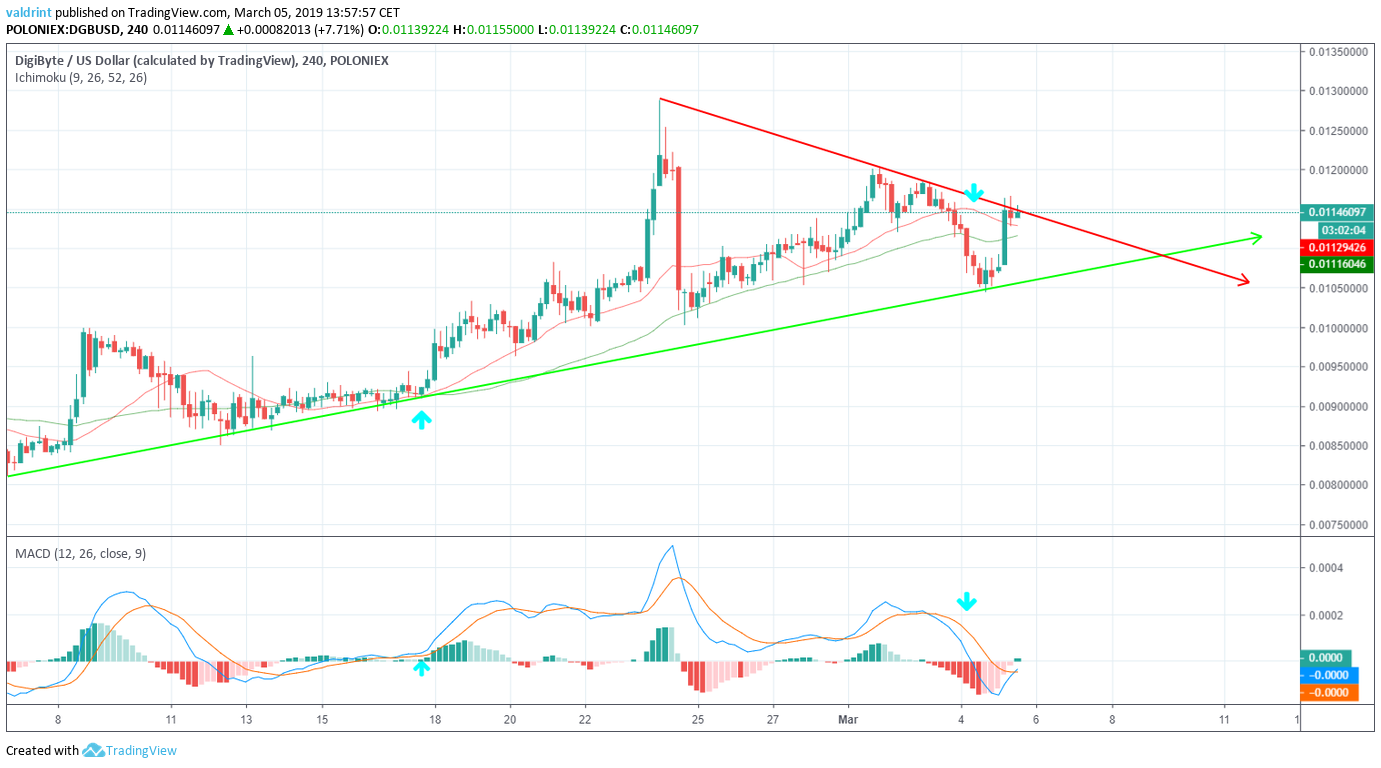
The End of The Symmetrical Triangle
Resistance and support areas are found when the price reaches a certain level several times. Resistance acts as a floor while support acts as the ceiling. Together they build a structure which is supposed to limit the scope of price movements.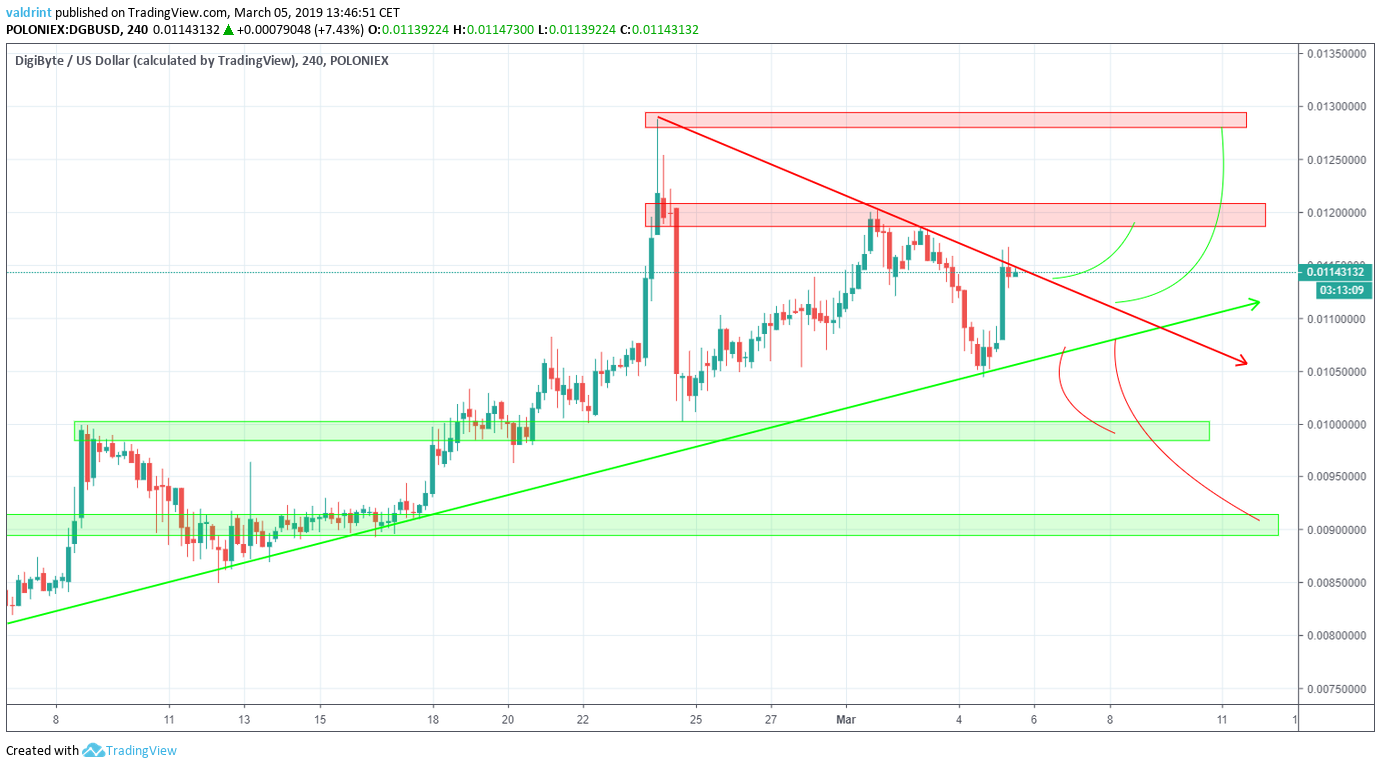
Top crypto platforms in the US
Disclaimer
In line with the Trust Project guidelines, this price analysis article is for informational purposes only and should not be considered financial or investment advice. BeInCrypto is committed to accurate, unbiased reporting, but market conditions are subject to change without notice. Always conduct your own research and consult with a professional before making any financial decisions. Please note that our Terms and Conditions, Privacy Policy, and Disclaimers have been updated.

Valdrin Tahiri
Valdrin discovered cryptocurrencies while he was getting his MSc in Financial Markets from the Barcelona School of Economics. Shortly after graduating, he began writing for several different cryptocurrency related websites as a freelancer before eventually taking on the role of BeInCrypto's Senior Analyst.
(I do not have a discord and will not contact you first there. Beware of scammers)
READ FULL BIO
Sponsored
Sponsored