

Render (RNDR) price has been struggling recently, with key metrics showing it’s falling behind compared to the top three AI-focused cryptocurrencies. Despite its position in the AI sector, RNDR has been unable to attract large holders, or whales, which are crucial for driving liquidity and price movement.
Since July 2024, the number of big RNDR holders has dropped significantly, indicating a loss of confidence from major players. However, some indications, like the recent shift in the BBTrend, suggest RNDR may still have a chance to recover if it can regain market interest.
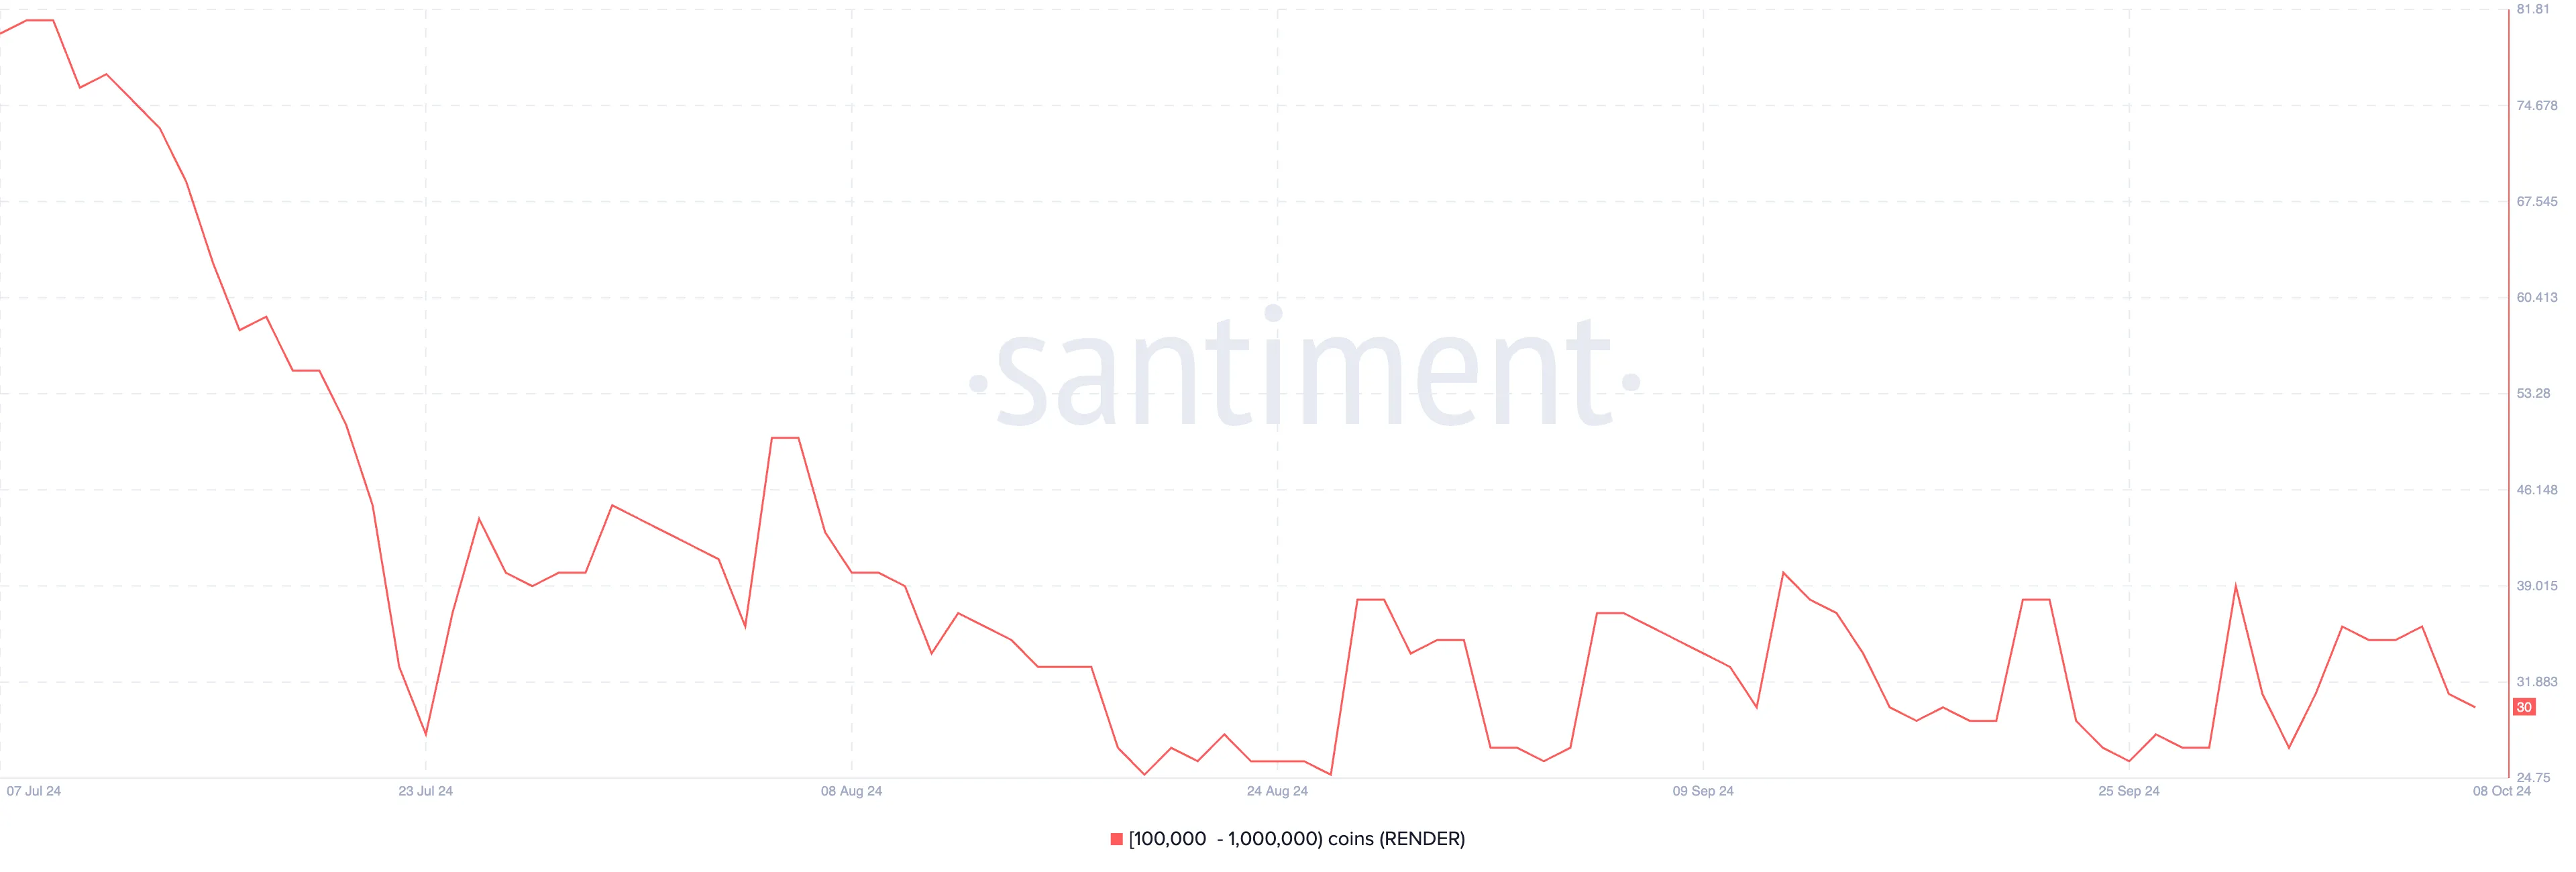
RNDR Whales Are Not Coming Back
RNDR is currently facing significant challenges in attracting and maintaining large holders, which are crucial for a project’s long-term success. Since July 2024, the number of users holding between 100,000 and 1,000,000 RNDR tokens has dropped from 80 to just 30, and since August 8, this number has remained at or below 40.
This sustained decline highlights a lack of interest from whales, who often play a key role in providing liquidity, driving price movements, and signaling confidence in a token’s potential. When large holders exit a project or fail to enter, it’s often a sign of reduced confidence in the asset’s future growth, creating a ripple effect that can discourage smaller investors as well.
Read More: How To Buy Render Token (RENDER) and Everything You Need To Know
Despite its presence in the artificial intelligence-focused cryptocurrency sector, RNDR has been unable to attract big players, which points to deeper issues with the project’s fundamentals or current market positioning.
Compared to its competitors, RNDR is falling behind in multiple key areas. Over the past week, RNDR posted the largest price decline among major AI tokens, with a drop of -5.32%, even worse than FET’s -4.23%. Meanwhile, WLD and TAO saw significant price surges, with gains of 12.22% and 12.13%, respectively.
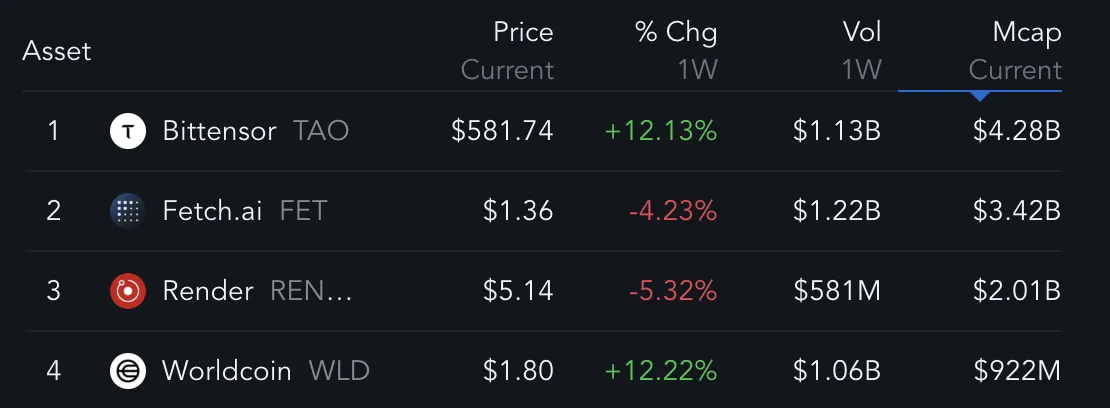
This performance gap shows the fact that RNDR is not capitalizing on the broader bullish trend seen in the AI crypto market. Additionally, RNDR’s 1-week trading volume is trailing far behind its competitors, being 45% lower than WLD, which ranks third in volume.
Trading volume is a critical indicator of market interest and liquidity, and RNDR’s lack of both suggests that it is losing investor attention.
Render BBTrend Good Bring A Good Sign
The latest development in the BBTrend for RNDR shows that although the indicator remains in negative territory, the current reading of -5.2457 is less bearish than in recent days. This suggests that while selling pressure persists, it may be starting to ease.
A less negative BBTrend could indicate a slowdown in the downward momentum, possibly hinting at some renewed interest in RNDR. However, it’s still early to make definitive conclusions, and this softening of the trend needs to be closely monitored over the next few days to see if it holds or reverses.
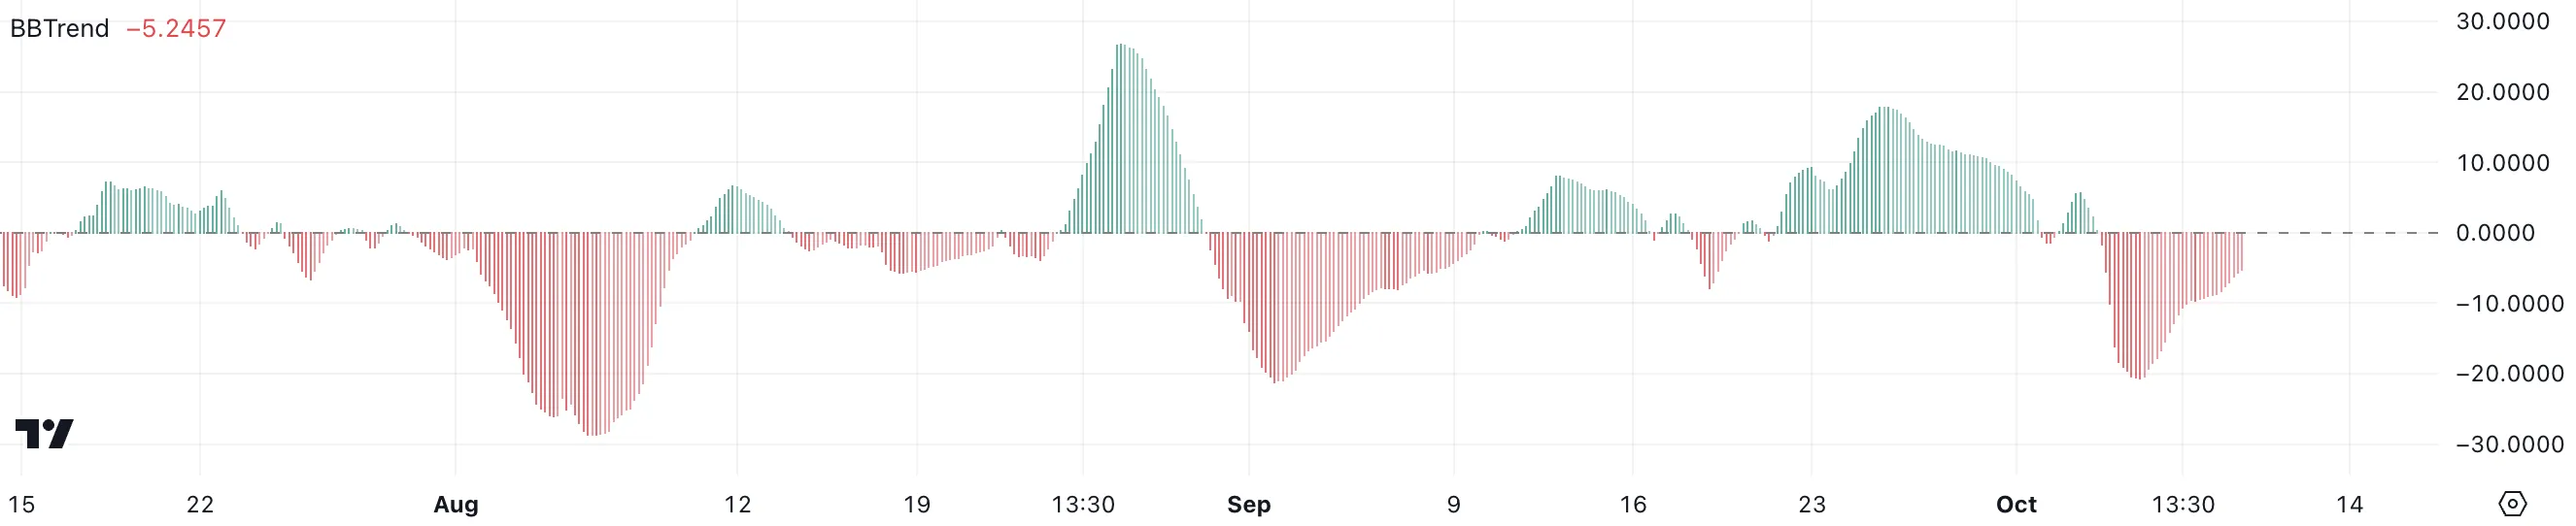
BBTrend is a momentum indicator derived from Bollinger Bands. It measures volatility to help gauge whether an asset is in a bullish or bearish trend. A negative BBTrend points to bearish momentum, while a positive one signals bullish momentum.
Despite still being in the red, the fact that the BBTrend is less negative than before might indicate that the market sentiment around RNDR could be stabilizing. If this trend continues and moves closer to neutral, it could suggest growing interest and a potential recovery.
RNDR Price Prediction: Can It Go Back To $7 In October?
On October 2, RNDR’s EMA lines formed a death cross, which occurs when the short-term EMA crosses below the long-term EMA, signaling a potential downtrend.
While this pattern often indicates bearish sentiment, the distance between the EMA lines is still relatively small, suggesting that the downtrend may not be fully established or strong yet. If the gap between the lines widens, it could confirm a more pronounced downward momentum.
EMA (Exponential Moving Average) lines are key technical indicators that smooth out price data to give more weight to recent movements. They help traders identify trends by comparing short-term and long-term averages.
Read more: Render Token (RNDR) Price Prediction 2024/2025/2030
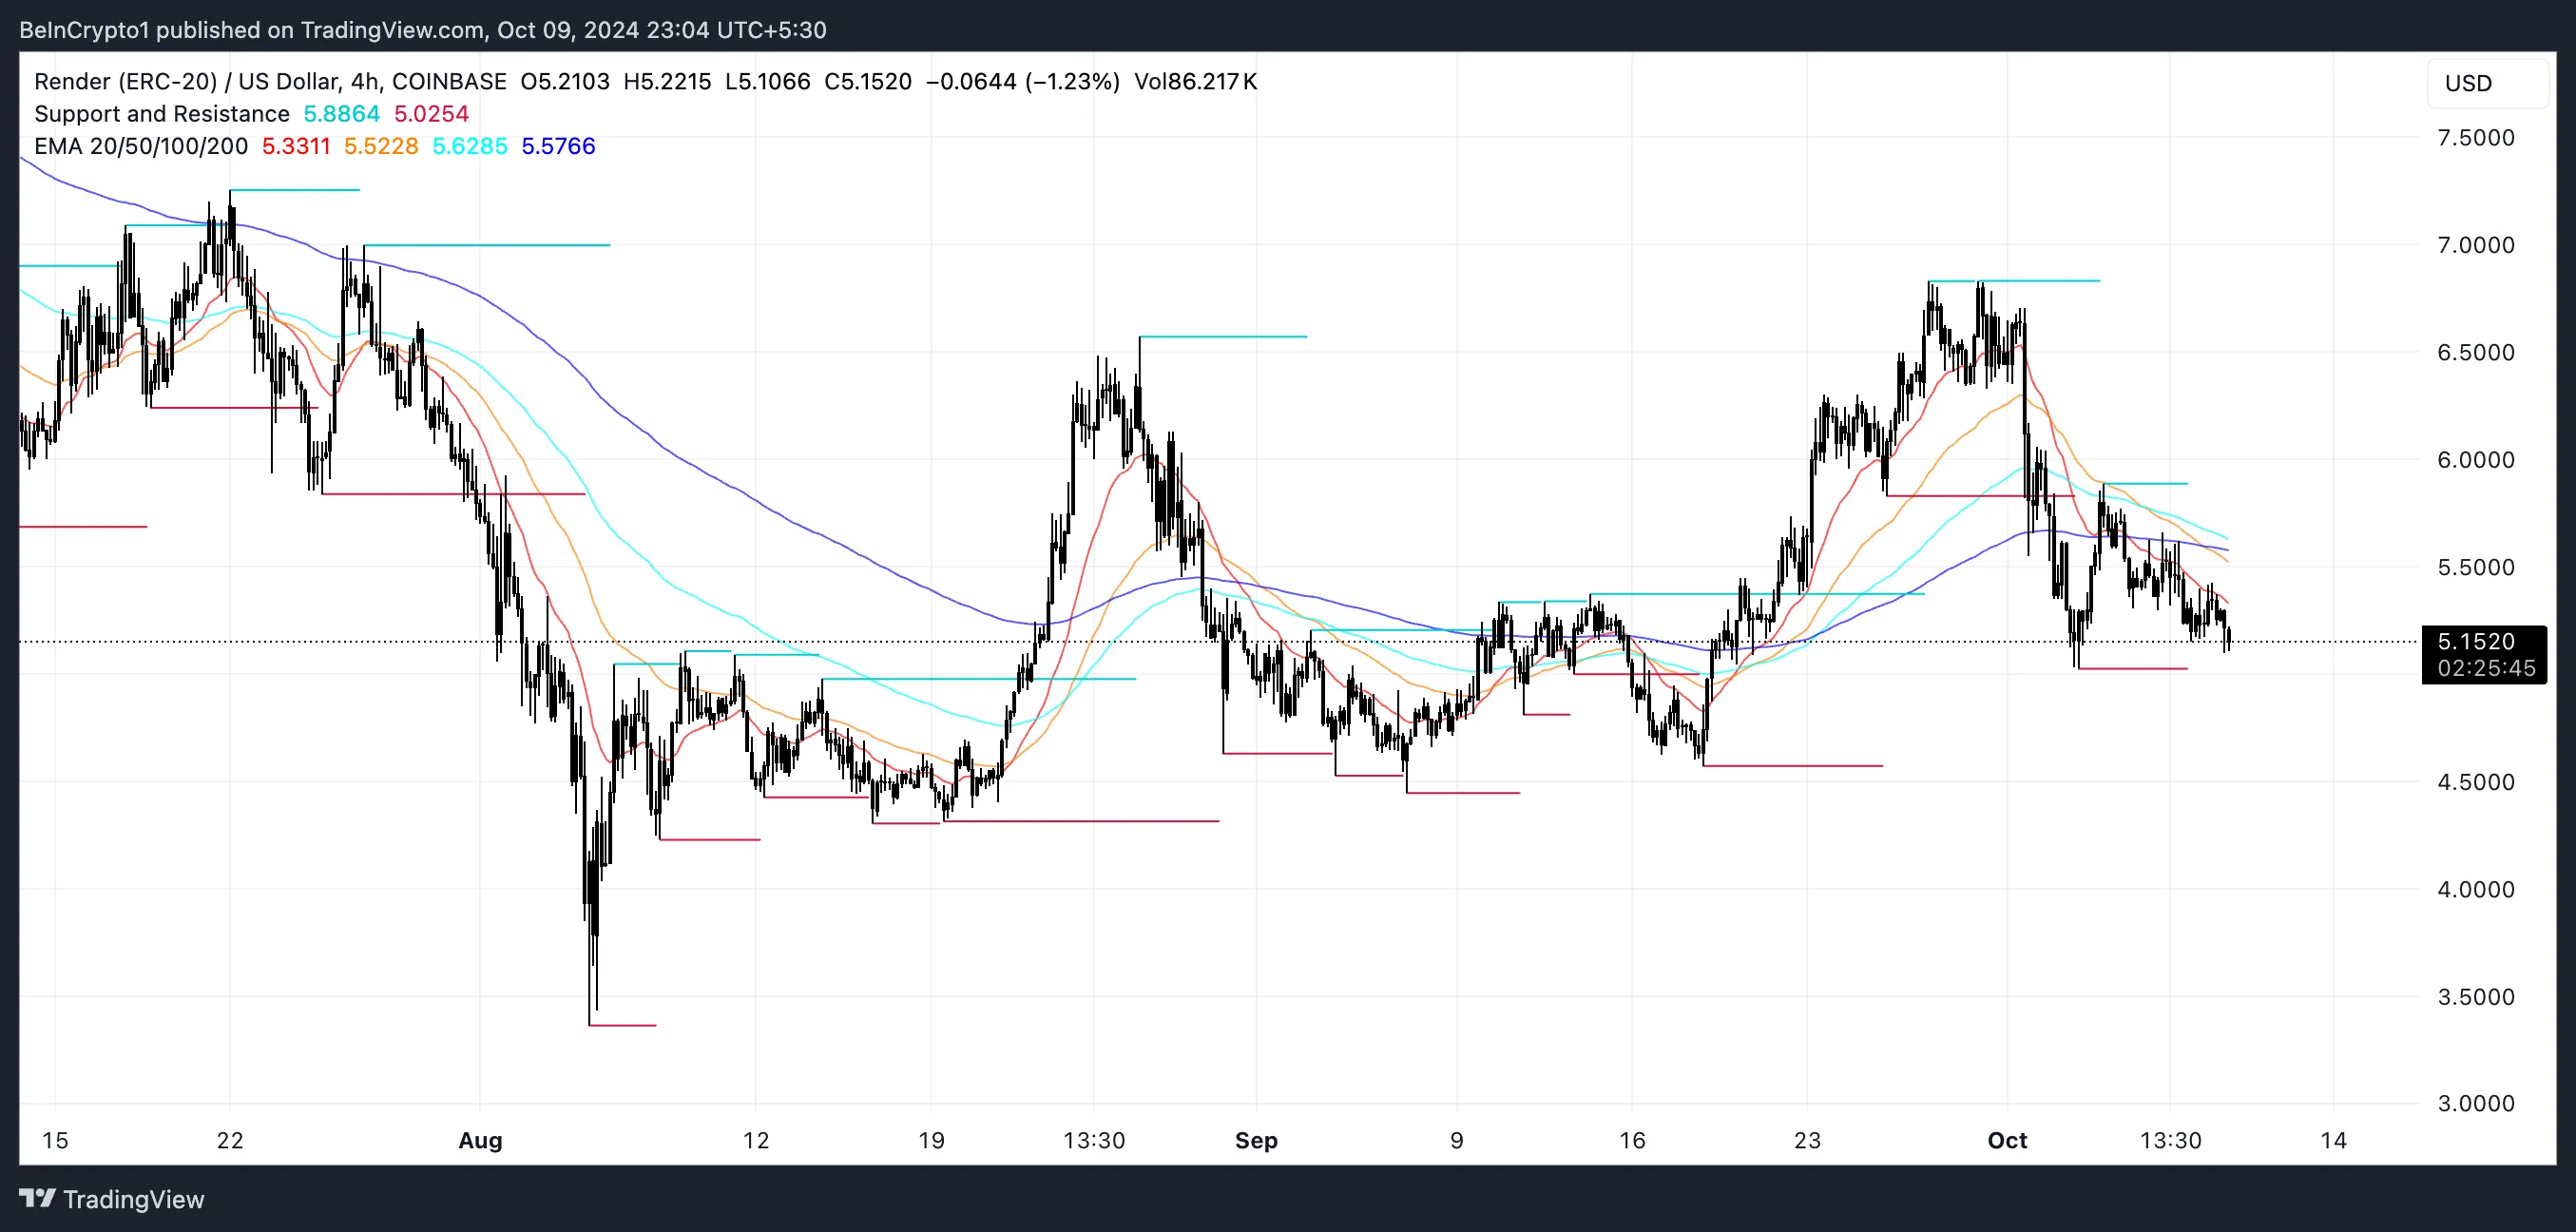
If RNDR’s current downtrend strengthens, the asset may test key support levels at $4.56 and even $4.32, which would imply a potential 15% price drop from current levels. However, if RNDR can regain momentum, as hinted by the cooling off in the BBTrend, it might reverse direction and test resistance levels around $6.57 or even $7.
A breakout above $7 would mark its highest price since July and could result in a potential 37% price gain, highlighting a significant upside if bullish sentiment returns.
Disclaimer
In line with the Trust Project guidelines, this price analysis article is for informational purposes only and should not be considered financial or investment advice. BeInCrypto is committed to accurate, unbiased reporting, but market conditions are subject to change without notice. Always conduct your own research and consult with a professional before making any financial decisions. Please note that our Terms and Conditions, Privacy Policy, and Disclaimers have been updated.