
Bitcoin’s (BTC) price has shown signs of recovery in recent days following a sharp decline at the beginning of October. After dipping below key support levels, BTC has rebounded, giving hope to investors that a significant rally could be on the horizon.
For Bitcoin to experience a 20% increase, it must flip a critical resistance level into support. The upcoming days will be crucial in determining whether the cryptocurrency can break through this barrier and sustain the momentum necessary for a potential surge.
Bitcoin Backers Are Back
Institutional interest in Bitcoin has resurged, marking a significant shift in market sentiment. On Monday, spot Bitcoin ETFs saw the largest inflows, with $235 million entering the market.
This came after several days of outflows, indicating a renewed appetite for the cryptocurrency among ETF investors. The influx of capital suggests that institutional and retail investors are once again viewing Bitcoin as a valuable asset, contributing to the bullish outlook.
This rise in interest is a positive indicator of Bitcoin’s price trajectory. When institutions start accumulating, it often signals confidence in the asset’s future. The increased inflows into spot BTC ETFs also reflect broader market interest, further supporting the possibility of Bitcoin achieving its target of a 20% rally in the near term.
Read more: What Happened at the Last Bitcoin Halving? Predictions for 2024
| IBIT | FBTC | BITB | ARKB | BTCO | EZBC | BRRR | HODL | BTCW | GBTC | BTC | ||
|---|---|---|---|---|---|---|---|---|---|---|---|---|
| 27 Sep 2024 | 110.8 | 123.6 | 12.9 | 203.1 | 3.3 | 0.0 | 3.3 | 11.2 | 0.0 | 26.2 | 0.0 | 494.4 |
| 30 Sep 2024 | 72.2 | 8.3 | (9.7) | (9.5) | 0.0 | 0.0 | 0.0 | 0.0 | 0.0 | 0.0 | 0.0 | 61.3 |
| 01 Oct 2024 | 40.8 | (144.7) | (32.7) | (84.3) | 0.0 | 0.0 | 0.0 | (15.8) | 0.0 | (5.9) | 0.0 | (242.6) |
| 02 Oct 2024 | (13.7) | 21.1 | (11.5) | (60.3) | 0.0 | 0.0 | 0.0 | 0.0 | 0.0 | 0.0 | 0.0 | (64.4) |
| 03 Oct 2024 | 36.0 | (37.2) | 2.6 | (58.0) | 2.4 | 0.0 | 0.0 | 0.0 | 0.0 | 0.0 | 0.0 | (54.2) |
| 04 Oct 2024 | 0.0 | 13.6 | 15.3 | 5.3 | 0.0 | 0.0 | 0.0 | 5.3 | 0.0 | (13.9) | 0.0 | 25.6 |
| 07 Oct 2024 | 97.9 | 103.7 | 13.1 | 12.6 | 2.5 | 0.0 | 0.0 | 5.4 | 0.0 | 0.0 | 0.0 | 235.2 |
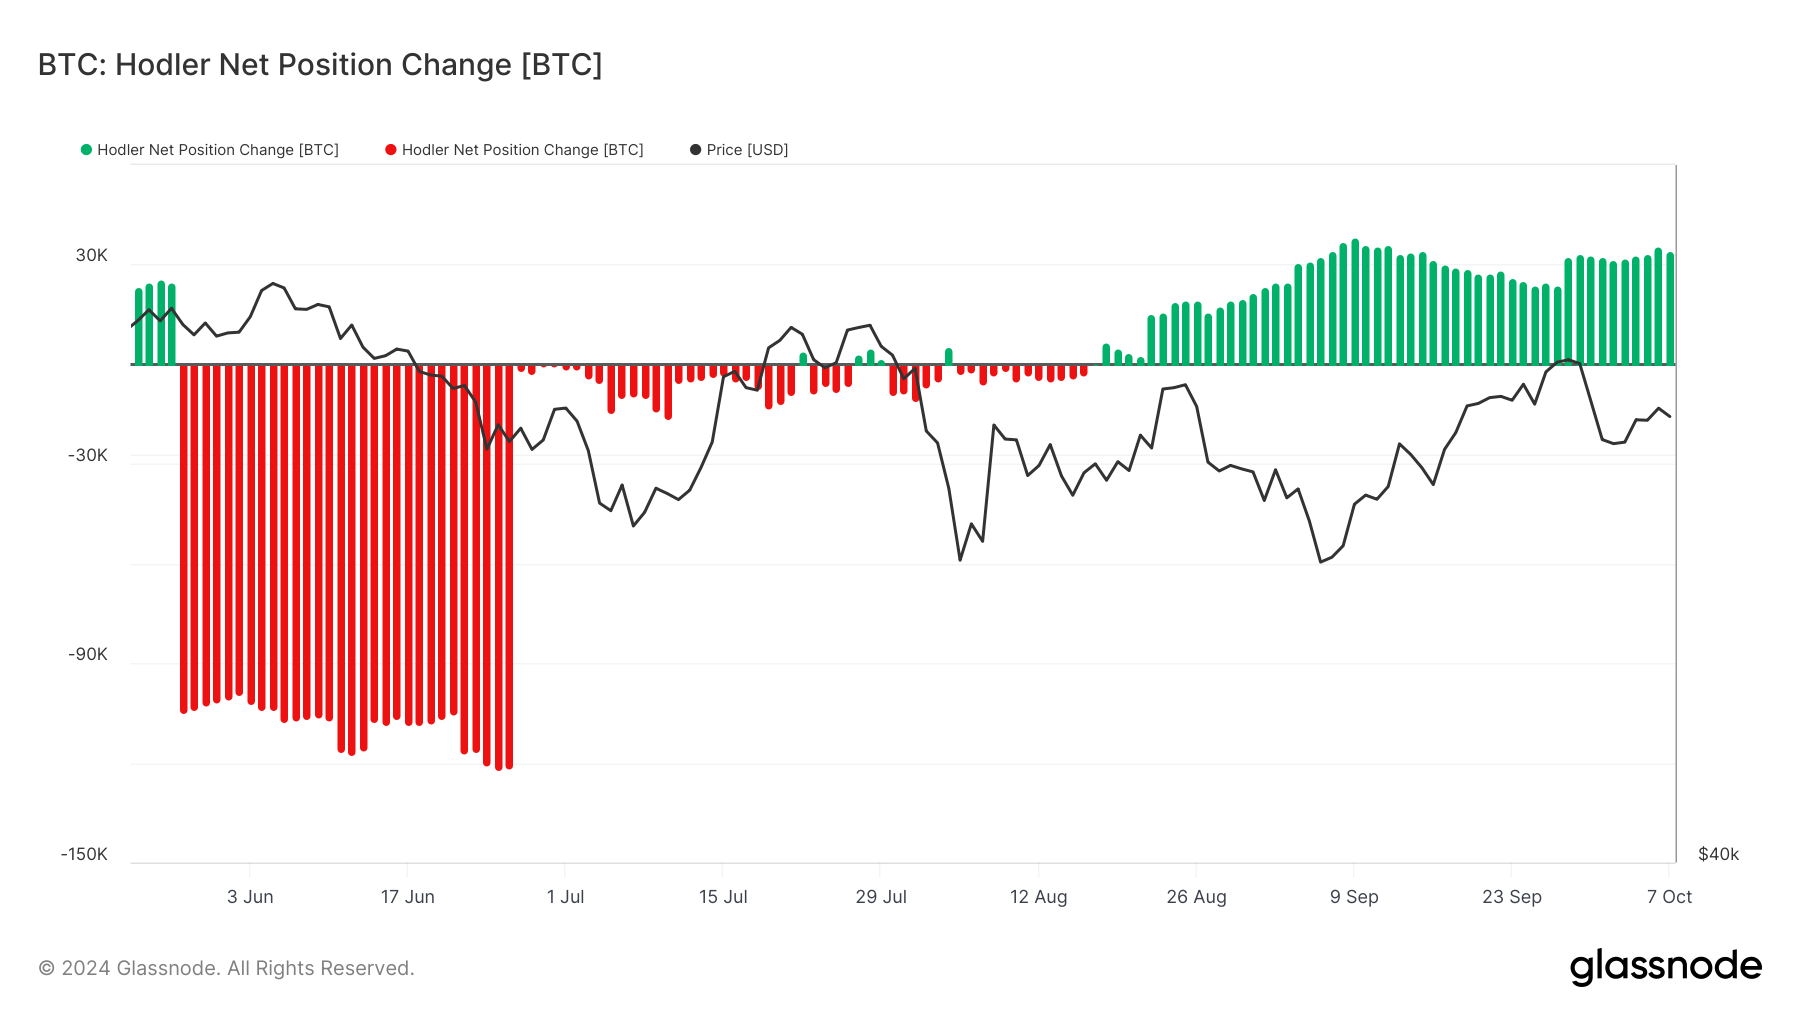
Additionally, long-term holders (LTHs) continue to exhibit strong conviction in Bitcoin, further boosting macro momentum. The Hodler Net Position Change indicator has shown positive figures since mid-August, demonstrating that LTHs have been in accumulation mode. This trend continues, as recent data indicates that LTHs are once again increasing their positions, adding to Bitcoin’s overall strength.
The sustained accumulation by long-term holders suggests that these key market participants believe in Bitcoin’s potential for further price appreciation. As LTHs hold onto their assets, the circulating supply reduces, creating a more favorable environment for a potential price surge. This macro momentum could help propel Bitcoin toward the much-anticipated 20% rally.
BTC Price Prediction: Reigniting Hope
Currently at $62,273, Bitcoin’s price has already broken out of a double-bottom pattern formed in September. However, the price is now once again trading below the neckline of the double-bottom pattern.
It has not yet gained enough momentum to realize the 20% rally predicted by the pattern. The target price remains $75,979, which would surpass Bitcoin’s previous all-time high of $73,787.
At the moment, the factors driving institutional interest and long-term holder accumulation point to Bitcoin possibly making another attempt at the rally. This will be confirmed if BTC breaks the $63,068 resistance and flips $65,000 into support. Such a move could trigger the next leg up, reinforcing the bullish thesis.
Read more: Bitcoin Halving History: Everything You Need To Know
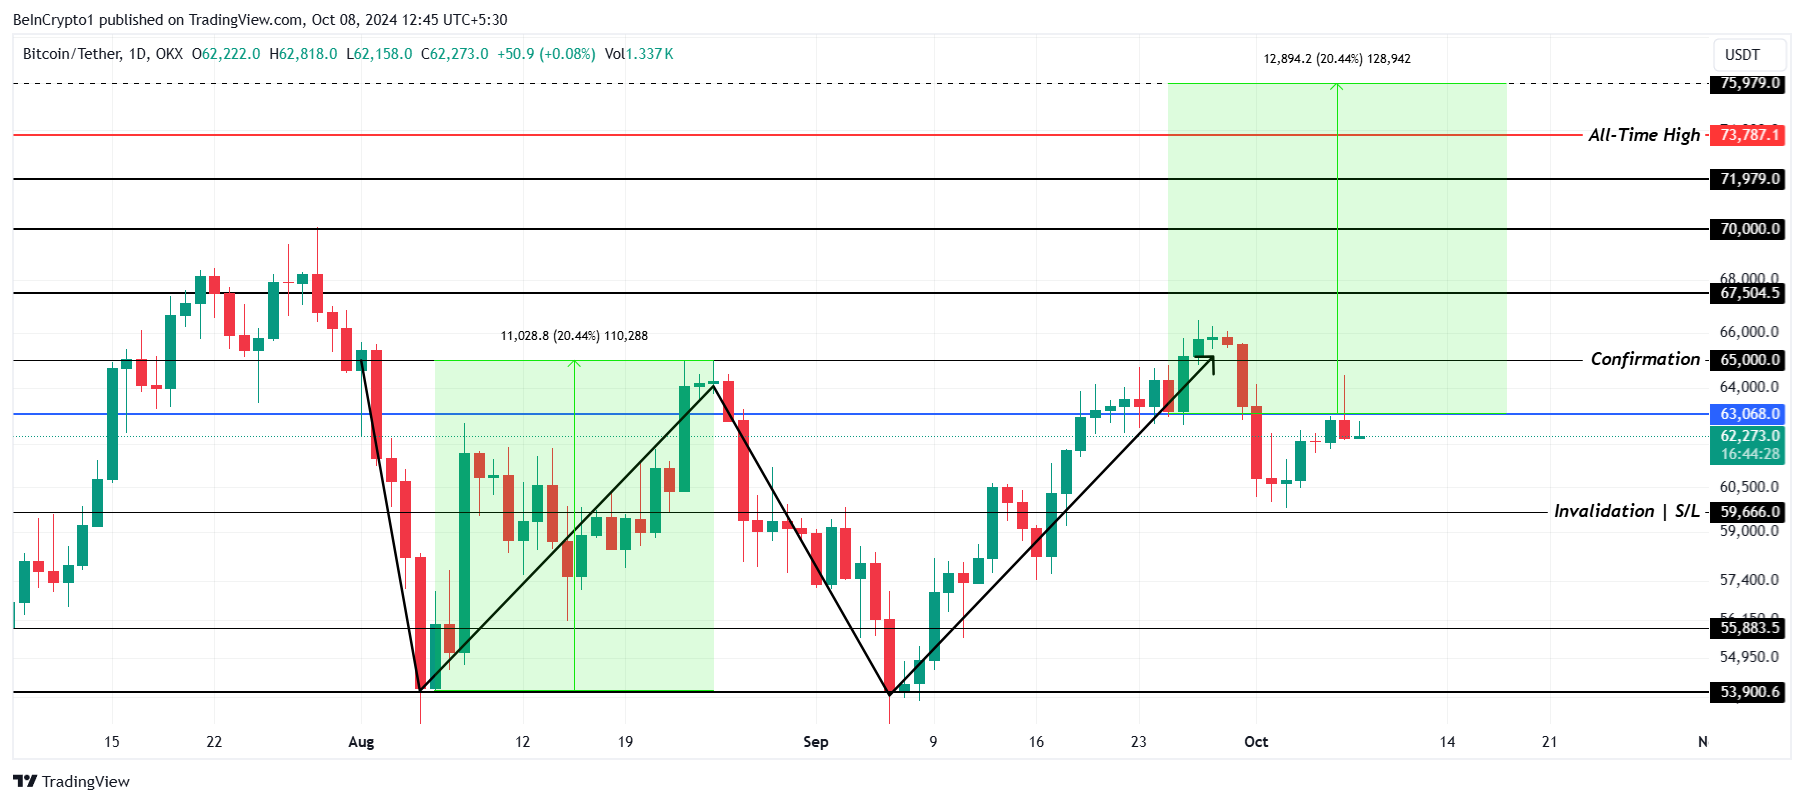
However, if Bitcoin fails to breach $63,068, the price may return to $59,666. Losing this support would invalidate the double-bottom pattern and also undermine the bullish outlook, potentially leading to a deeper correction.
Disclaimer
In line with the Trust Project guidelines, this price analysis article is for informational purposes only and should not be considered financial or investment advice. BeInCrypto is committed to accurate, unbiased reporting, but market conditions are subject to change without notice. Always conduct your own research and consult with a professional before making any financial decisions. Please note that our Terms and Conditions, Privacy Policy, and Disclaimers have been updated.