
Last week, Render (RNDR) was one of the AI-themed tokens that registered a notable price increase. However, the price has since fallen from a ceiling of $8.33 and currently trades at $7.17.
Will the token recover from the losses, or is there a further decline in the works? On-chain data answers this question, and you will find some here.
More Selling Pressure May Hit Render
According to Santiment, RNDR’s volume has jumped by a mouth-watering 105% in the last 24 hours. On June 23, the token’s volume was $78.17 million. At press time, it is $160.72 million.
The volume provides insights into the level of market activity around a cryptocurrency. Heavy movements signify rising interest, while low volume indicates a drop in the number of tokens traded.
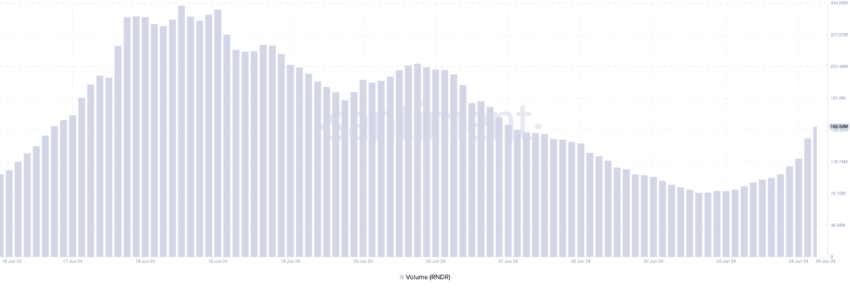
However, an increase in volume is not always a bullish sign. It mostly depends on the price trend. When volume rises with the price, an uptrend is likely to continue as it strengthens the price direction.
Furthermore, RNDR’s price fell by 4.69% in the last 24 hours. This suggests that there has been more selling than buying. As such, the increase may give credence to a further price decline.
Read More: Render Token (RNDR) Price Prediction 2024/2025/2030
Another indicator that shares a similar sentiment is the In/Out of Money Around Price (IOMAP). It identifies specific buying and selling areas that can act as support or resistance. To do this, it groups addresses based on those making money at the breakeven point and addresses out of the money.
If a high concentration of addresses is in the money, the IOMAP provides support for the price. On the other hand, a large cluster of addresses out of the money will act as resistance.
As of this writing, 2,760 addresses who purchased 11.35 million RNDR between $7.19 and $7.40 are out of the money. Also, 1,040 addresses who are in the money bought 6.84 million tokens between $6.97 and $7.18.
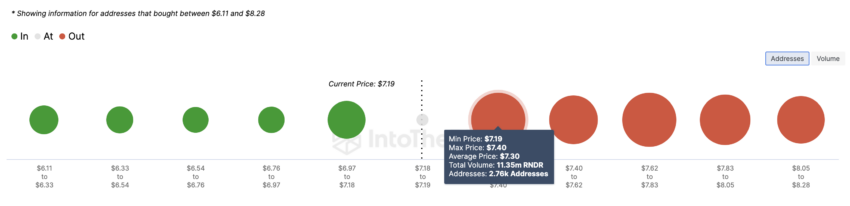
Considering the difference in tokens and addresses, RNDR may experience resistance at $7.19. Should some token holders decide to sell at this point, the price may fall to $6.86.
RNDR Price Prediction: Another Nosedive?
From a technical perspective, BeInCrypto analyzes Render’s price on the daily chart. Two indicators that help in this regard are the Chaikin Money Flow (CMF) and Parabolic SAR.
The Parabolic SAR captures prime entry and exit positions. When the dotted line exceeds the price, it is time to sell, as prices may continue to fall. Conversely, if the lines are below the price, it is a buy signal.
As of this writing, the indicator is above RNDR’s value. Thus, the token’s price may decrease and lose its hold on the $7 region.
CMF distinguishes between accumulation and distribution periods. When the CMF rises, it implies a rise in accumulation. On the other hand, a decline, especially in the negative territory, implies distribution.
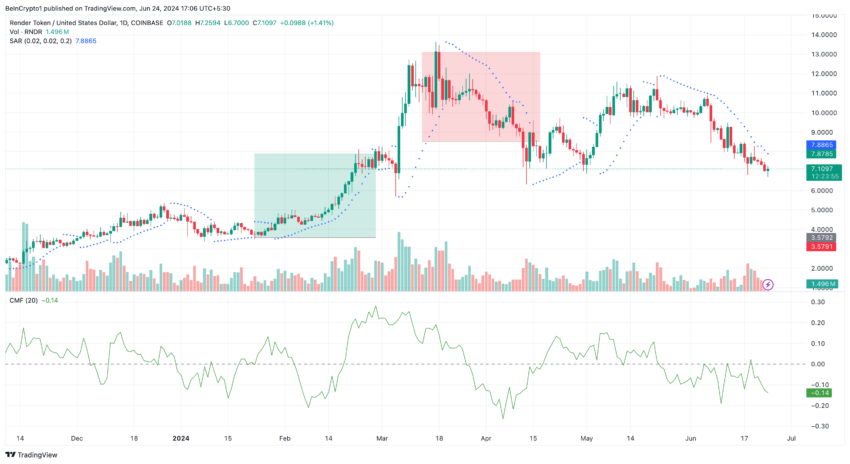
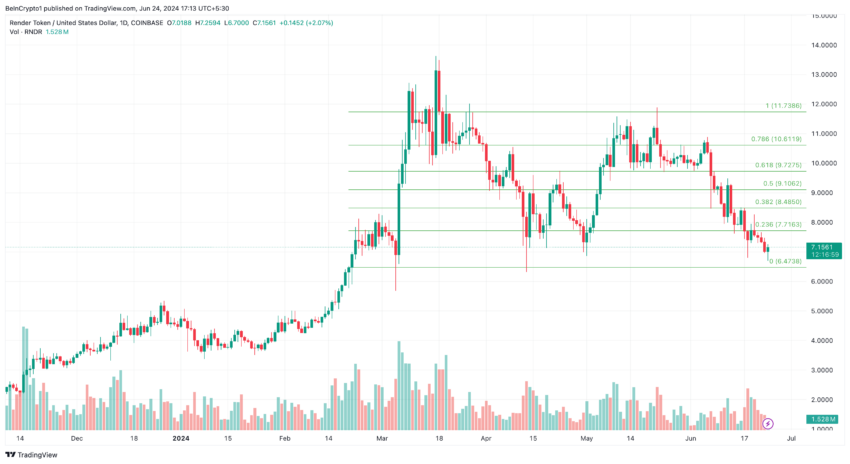
At press time, the CMF on the RNDR/USD chart is -0.14, which confirms the distribution. We also looked at the Fibonacci Retracement tool, which spots supports and resistance zones.
As seen below, further distribution may send RNDR’s price to $6.47. However, if bulls can defend the price at $6.86, the price can rebound to $7.71.
Read More: 5 Best Render Token (RNDR) Wallets for 2024
Besides this, the Render token strongly correlates with Ethereum (ETH). Should ETH’s price bounce, RNDR may follow, which could invalidate the bearish bias.
Disclaimer
In line with the Trust Project guidelines, this price analysis article is for informational purposes only and should not be considered financial or investment advice. BeInCrypto is committed to accurate, unbiased reporting, but market conditions are subject to change without notice. Always conduct your own research and consult with a professional before making any financial decisions. Please note that our Terms and Conditions, Privacy Policy, and Disclaimers have been updated.