
Dogecoin (DOGE), a popular meme coin, has displayed recurring price patterns that often precede substantial bull runs.
Indeed, Dogecoin’s recent price correction suggests a potential for a bullish reversal, aligning with its historical trends.
Understanding Descending Triangles
A descending triangle is an important pattern in technical analysis, often signaling bullish reversals. It forms with a flat support level and a descending resistance line, indicating decreasing selling pressure and consistent buying interest.
- Flat Support Level: This horizontal line represents a strong support level where the price finds consistent buying interest.
- Descending Resistance Line: This downward-sloping trendline connects lower highs, showing decreasing selling pressure.
- Formation: Sellers gradually lose control as the price makes lower highs. The strong support indicates buyers are accumulating positions.
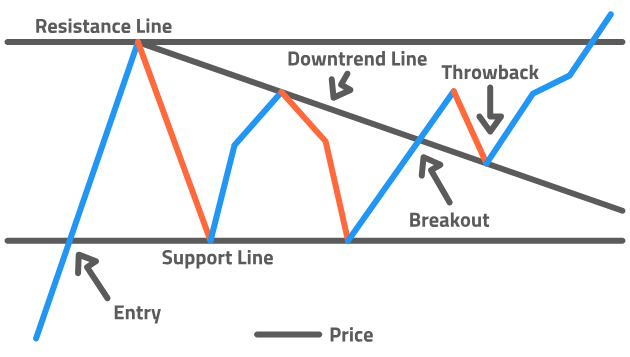
When the price breaks above the descending resistance line with significant volume, it signals a potential bullish reversal.
Dogecoin’s Historical Price Precedents
Interestingly, historical data supports the pattern’s effectiveness for Dogecoin. In previous cycles, after DOGE has reached a market top, it tends to consolidate in a descending triangle before a new bull market starts.
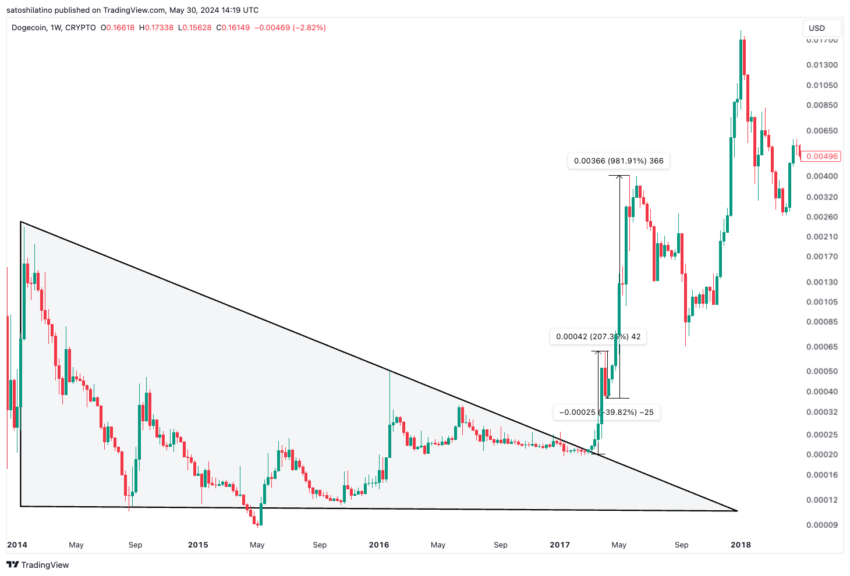
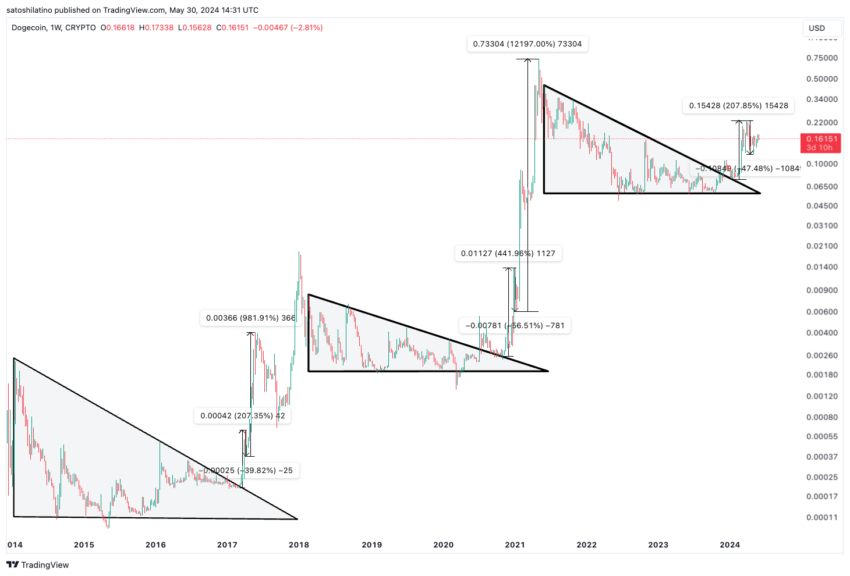
For instance, Dogecoin reached a market peak of $0.00232 in January 2014. After this high, DOGE’s price declined, forming a series of lower highs while maintaining a flat support level at $0.00010.
In March 2017, Dogecoin broke out of this descending triangle pattern, resulting in a 207.35% surge. Following this upswing, DOGE experienced a 39.82% retracement before skyrocketing by an impressive 981.91%.
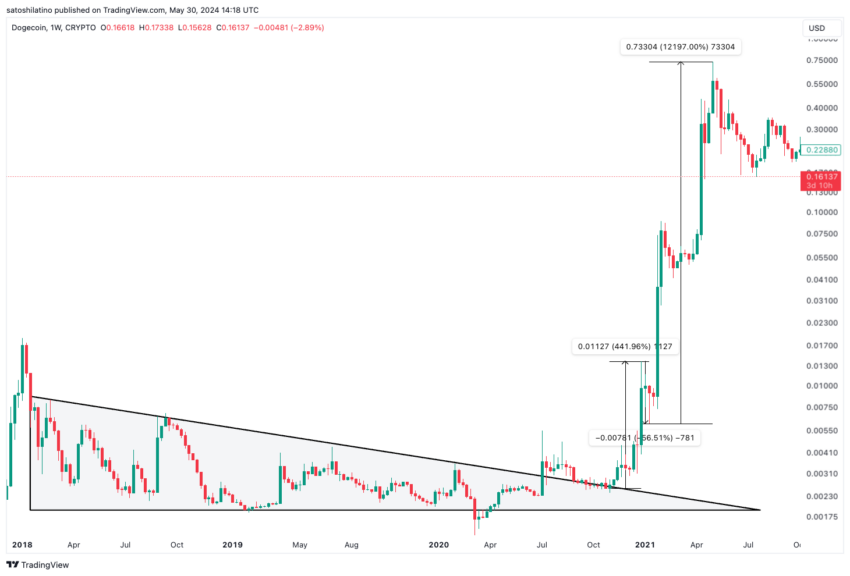
Similarly, in January 2018, Dogecoin reached an all-time high of $0.01877, marking the start of a downward trend. As DOGE’s price formed a series of lower highs, it developed a descending triangle pattern, with a strong support level at $0.00191.
In November 2020, Dogecoin broke through the triangle’s resistance line, triggering a 441.96% bull rally. This was followed by a 56.31% correction, after which DOGE’s price skyrocketed by an astounding 12,197%.
These patterns reflect Dogecoin’s potential for significant gains following a descending triangle breakout.
DOGE’s Current Governing Pattern
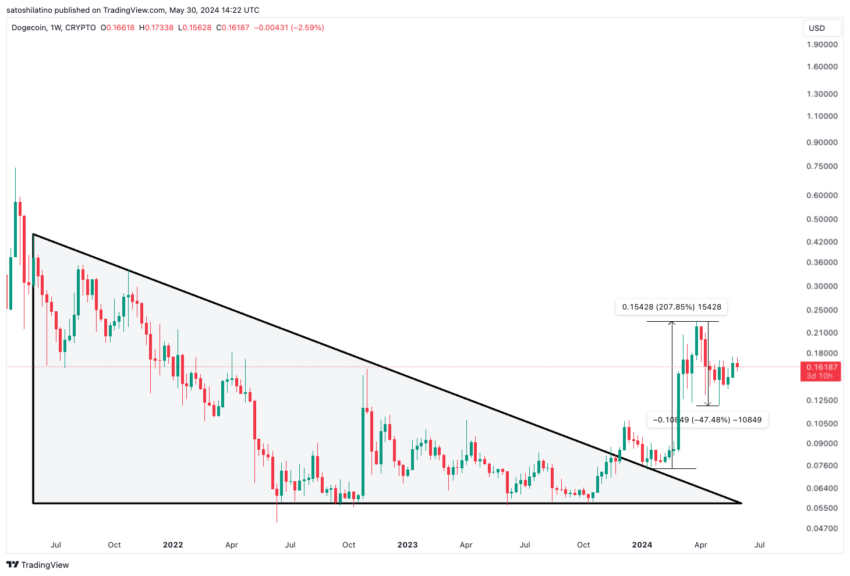
Following the all-time high of $0.73905 in May 2021, Dogecoin entered a bear market, forming a descending triangle pattern. In January 2024, Dogecoin broke out of this pattern, experiencing a 207.85% price increase. As seen in previous cycles, DOGE’s price retraced by 47.48%.
If history repeats itself, Dogecoin may be on the verge of entering a new bull market.
The descending triangle’s implications are profound. Initial selling pressure gives way to strong support, indicating buyer accumulation. A breakout above the descending resistance line can lead to significant upward price movement as bearish pressure dissipates.
Dogecoin’s consistent historical behavior of breaking out of descending triangles and entering bull runs highlights the importance of patience and strategic analysis. While past performance does not guarantee future results, the pattern provides a compelling case for optimism.
Read more: Dogecoin (DOGE) Price Prediction 2024/2025/2030
Summary and Conclusion
Dogecoin’s recent price action aligns with historical patterns, suggesting a potential bullish reversal. Historical data from 2017 and 2021 shows that Dogecoin often follows descending triangle breakouts with substantial gains.
For traders, the descending triangle pattern offers a strategic framework for entering positions. With a well-placed stop-loss and target price, traders can manage risk while positioning for potential gains.
The current market phase, marked by a 47.48% correction, could be the precursor to another significant bull run for Dogecoin. Patience and strategic analysis, informed by historical patterns, could yield substantial rewards for Dogecoin investors.
Read more: How To Buy Dogecoin (DOGE) and Everything You Need To Know
Overall, understanding the descending triangle pattern and its implications provides valuable insights into Dogecoin’s price action. This knowledge, combined with strategic trading approaches, can help investors navigate the cryptocurrency market and capitalize on potential upward trends.
Disclaimer
In line with the Trust Project guidelines, this price analysis article is for informational purposes only and should not be considered financial or investment advice. BeInCrypto is committed to accurate, unbiased reporting, but market conditions are subject to change without notice. Always conduct your own research and consult with a professional before making any financial decisions. Please note that our Terms and Conditions, Privacy Policy, and Disclaimers have been updated.