

Since reaching lows near $110 on May 11, 2019, the price of DASH (DASH) has been increasing. The increase has been relatively gradual. On June 26, the DASH price reached highs near $200.
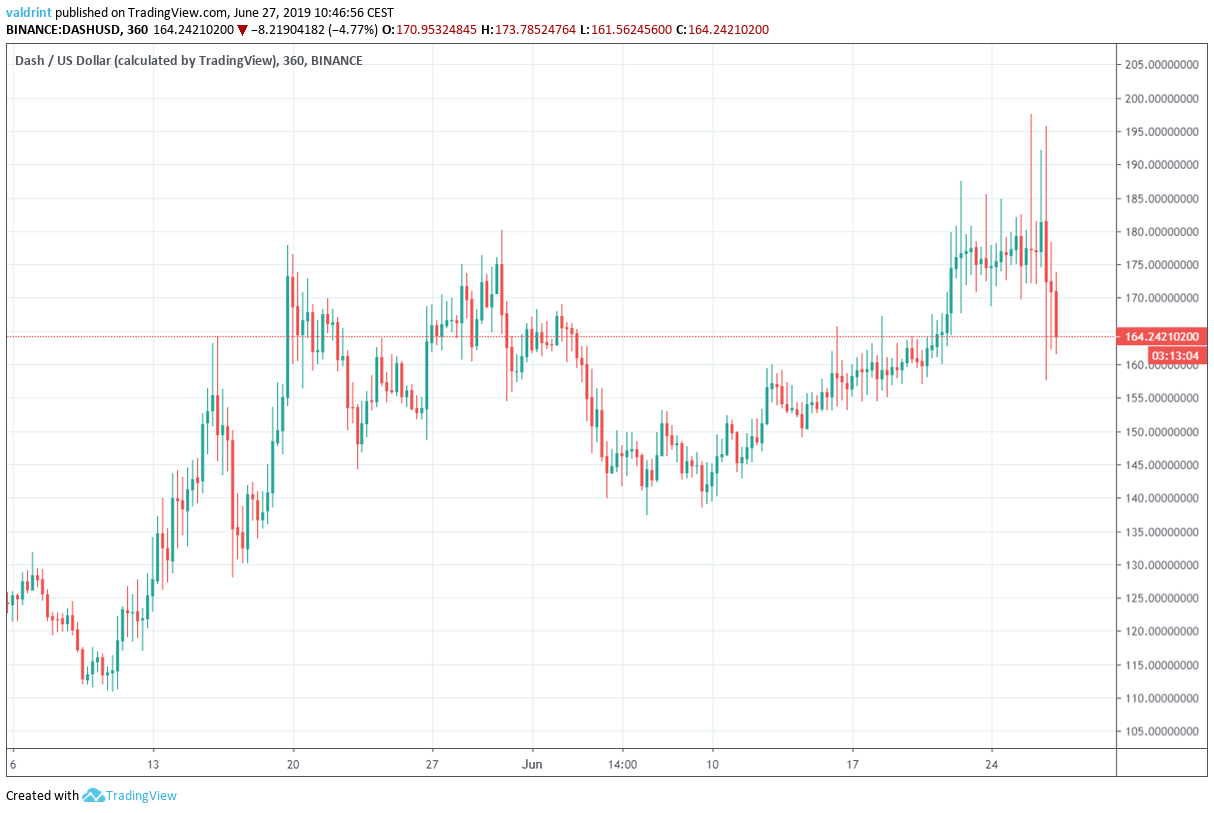 However, a swift reversal ensued that took the DASH price close to $160.
Where will the price go to next? Below we will analyze the price of the altcoin in different time-frames alongside technical indicators in order to provide an answer.
For video analysis, please click below.
https://www.youtube.com/watch?v=xGlwdvXEDJs
However, a swift reversal ensued that took the DASH price close to $160.
Where will the price go to next? Below we will analyze the price of the altcoin in different time-frames alongside technical indicators in order to provide an answer.
For video analysis, please click below.
https://www.youtube.com/watch?v=xGlwdvXEDJs
DASH Price: Trends and Highlights for June 27
- DASH/USD is trading inside an ascending channel
- A rapid decrease began on June 26.
- The decrease was preceded by short-term bearish divergence in the RSI.
- The RSI has also developed long-term bearish divergence.
- Short-term moving averages (MA) are bearish.
- Long-term MAs are undecided.
DASH Price in an Ascending Channel
DASH/USD has been trading inside an ascending channel since reaching lows of $128 on May 16. Both the resistance and support lines have been touched three times. After touching the resistance line of the channel on June 26, the DASH price has been decreasing.
Below, we will take a look at some technical indicators and try to predict future price movement.
After touching the resistance line of the channel on June 26, the DASH price has been decreasing.
Below, we will take a look at some technical indicators and try to predict future price movement.
Technical Indicators
The price of DASH is analyzed alongside the RSI and the 10- and 20-period moving averages (MA) at six-hour intervals (first graph) and daily intervals (second graph).
The recent price decrease was preceded by bearish divergence in the RSI.
The divergence began to occur during the initial highs of June 22.
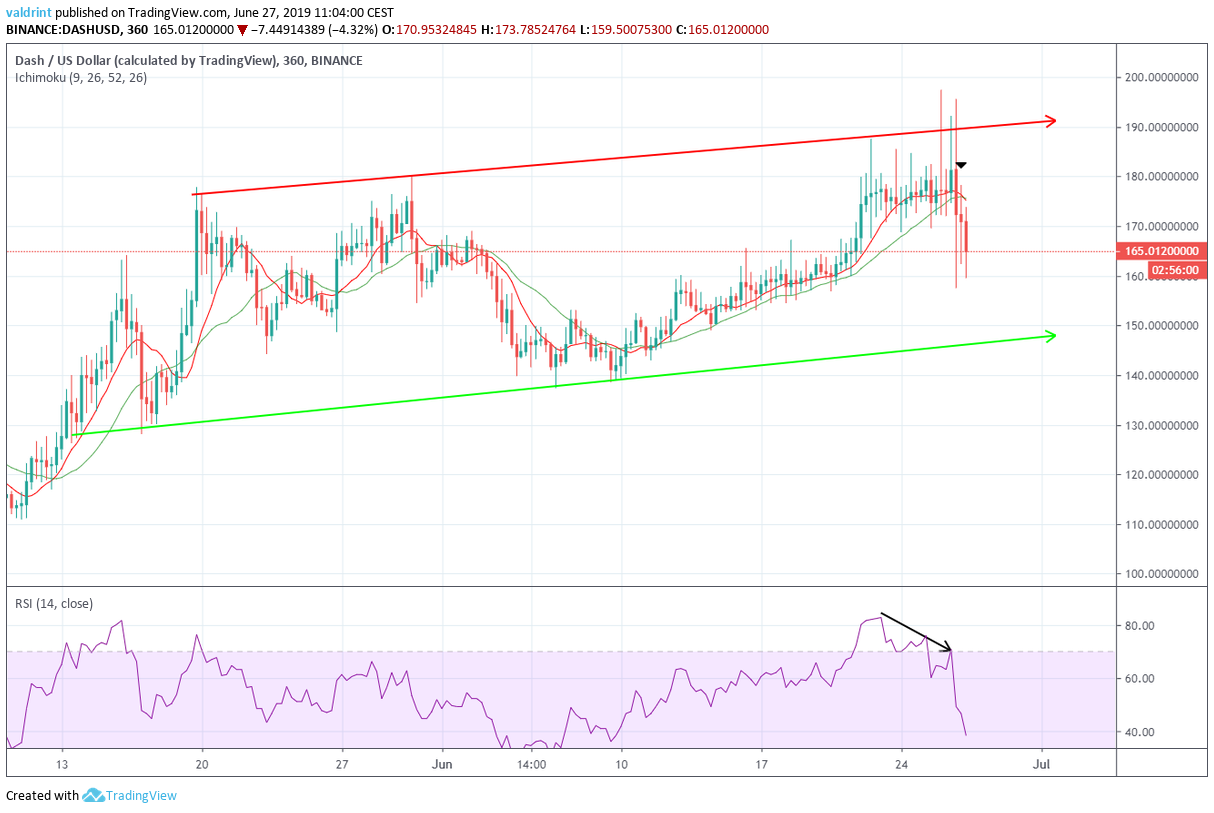 At the time of writing, the DASH price was trading below both the 10- and 20- period moving averages — which have just made a bearish cross.
Both MAs are currently providing resistance to the price.
These short-term indicators support continued price decreases towards the support line of the channel.
However, longer-term indicators are still undecided.
In a daily time-frame, the price has similarly generated bearish divergence. This divergence, however, is more gradual and less significant in value.
At the time of writing, the DASH price was trading below both the 10- and 20- period moving averages — which have just made a bearish cross.
Both MAs are currently providing resistance to the price.
These short-term indicators support continued price decreases towards the support line of the channel.
However, longer-term indicators are still undecided.
In a daily time-frame, the price has similarly generated bearish divergence. This divergence, however, is more gradual and less significant in value.
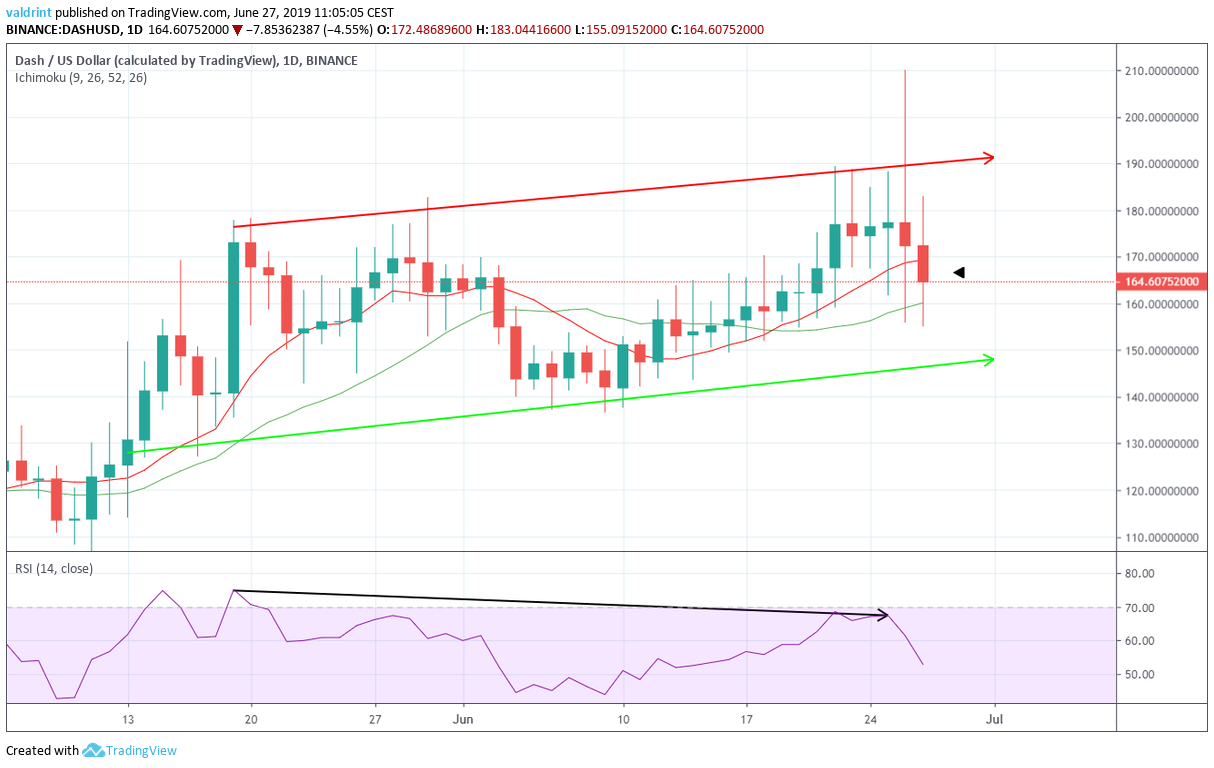 Finally, the DASH price is currently trading between the 10- and 20-period MAs.
While the 10-day MA has slowly begun to decrease, the 20-day MA is still increasing and offering support to the price. However, a continued price decrease would likely cause long-term indicators to decrease and act in a similar manner to the short-term ones.
Finally, the DASH price is currently trading between the 10- and 20-period MAs.
While the 10-day MA has slowly begun to decrease, the 20-day MA is still increasing and offering support to the price. However, a continued price decrease would likely cause long-term indicators to decrease and act in a similar manner to the short-term ones.
Support Levels
Since the massive decrease began in November 2018, the price of DASH has fully retraced to pre-crash levels.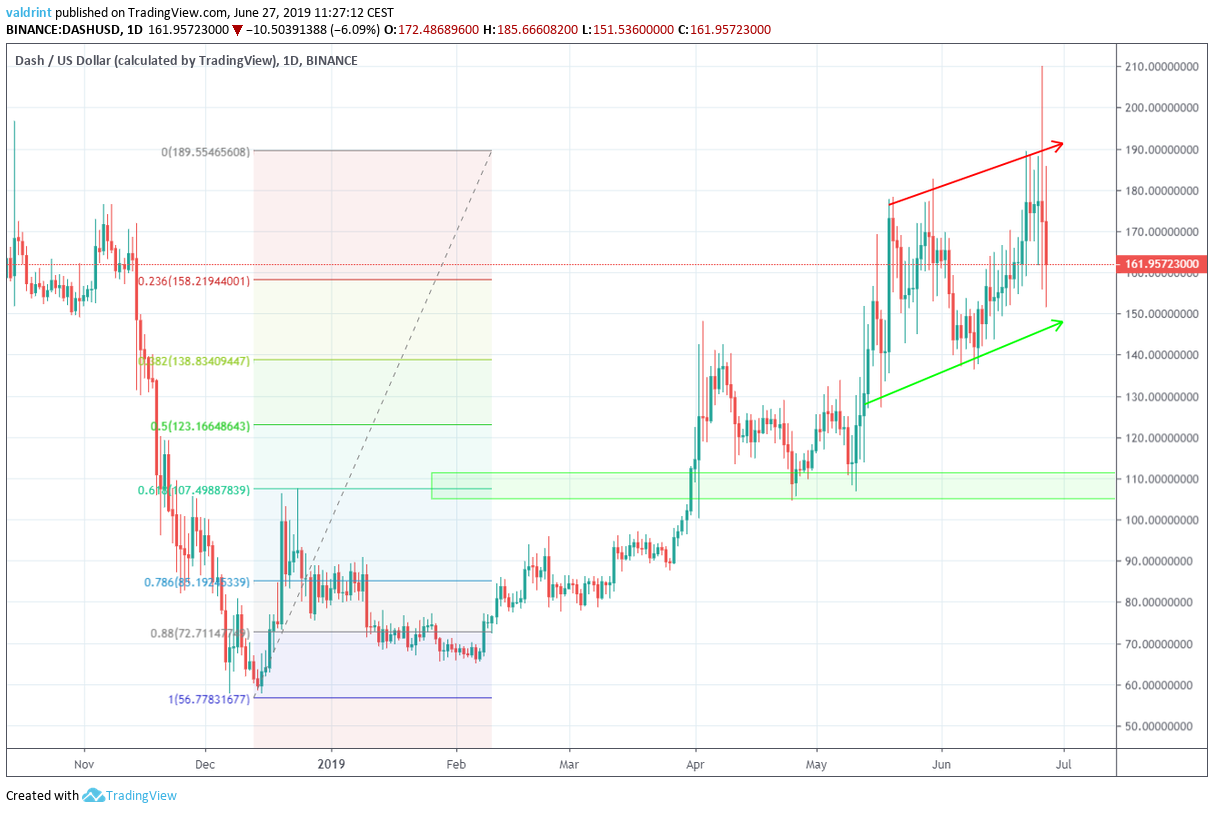 However, it met resistance near $200 and began to decrease.
If the price eventually breaks down from the channel, a support level to keep an eye on will be found near $110.
This level is created by the lows at the end of April/beginning of May and the 0.618 Fibonacci level of the entire drop.
However, it met resistance near $200 and began to decrease.
If the price eventually breaks down from the channel, a support level to keep an eye on will be found near $110.
This level is created by the lows at the end of April/beginning of May and the 0.618 Fibonacci level of the entire drop.
Summary
The price of DASH reached highs of nearly $200 before beginning to decrease. It is currently trading inside an ascending channel. The short-term technical indicators give a bearish outlook. The long-term ones are undecided but are leaning towards turning bearish. If the DASH price breaks down from the channel, it is likely to find support near $110. Do you think the price of DASH will break down from the wedge? Let us know in the comments below.Disclaimer: This article is not trading advice and should not be construed as such. Always consult a trained financial professional before investing in cryptocurrencies, as the market is particularly volatile. Images are courtesy of Shutterstock, TradingView.
Top crypto platforms in the US

 eToro
Explore
Explore
Explore
Explore
eToro
Explore
Explore
Explore
Explore
Don’t invest unless you’re prepared to lose all
the money you invest.
This is a high-risk investment and you should not expect to be protected if something goes wrong.
Take 2 mins to learn more
Don’t invest unless you’re prepared to lose all
the money you invest.
This is a high-risk investment and you should not expect to be protected if something goes wrong.
Take 2 mins to learn more
Don’t invest unless you’re prepared to lose all
the money you invest.
This is a high-risk investment and you should not expect to be protected if something goes wrong.
Take 2 mins to learn more
Don’t invest unless you’re prepared to lose all
the money you invest.
This is a high-risk investment and you should not expect to be protected if something goes wrong.
Take 2 mins to learn more
Don’t invest unless you’re prepared to lose all
the money you invest.
This is a high-risk investment and you should not expect to be protected if something goes wrong.
Take 2 mins to learn more
Don’t invest unless you’re prepared to lose all
the money you invest.
This is a high-risk investment and you should not expect to be protected if something goes wrong.
Take 2 mins to learn more
Top crypto platforms in the US
Uphold
Coinbase
eToro
eToro
eToro
eToro
Moonacy
Chain GPT
Don’t invest unless you’re prepared to lose all
the money you invest.
This is a high-risk investment and you should not expect to be protected if something goes wrong.
Take 2 mins to learn more
Don’t invest unless you’re prepared to lose all
the money you invest.
This is a high-risk investment and you should not expect to be protected if something goes wrong.
Take 2 mins to learn more
Don’t invest unless you’re prepared to lose all
the money you invest.
This is a high-risk investment and you should not expect to be protected if something goes wrong.
Take 2 mins to learn more
Disclaimer
In line with the Trust Project guidelines, this price analysis article is for informational purposes only and should not be considered financial or investment advice. BeInCrypto is committed to accurate, unbiased reporting, but market conditions are subject to change without notice. Always conduct your own research and consult with a professional before making any financial decisions. Please note that our Terms and Conditions, Privacy Policy, and Disclaimers have been updated.

Valdrin Tahiri
Valdrin discovered cryptocurrencies while he was getting his MSc in Financial Markets from the Barcelona School of Economics. Shortly after graduating, he began writing for several different cryptocurrency related websites as a freelancer before eventually taking on the role of BeInCrypto's Senior Analyst.
(I do not have a discord and will not contact you first there. Beware of scammers)
READ FULL BIO
Sponsored
Sponsored