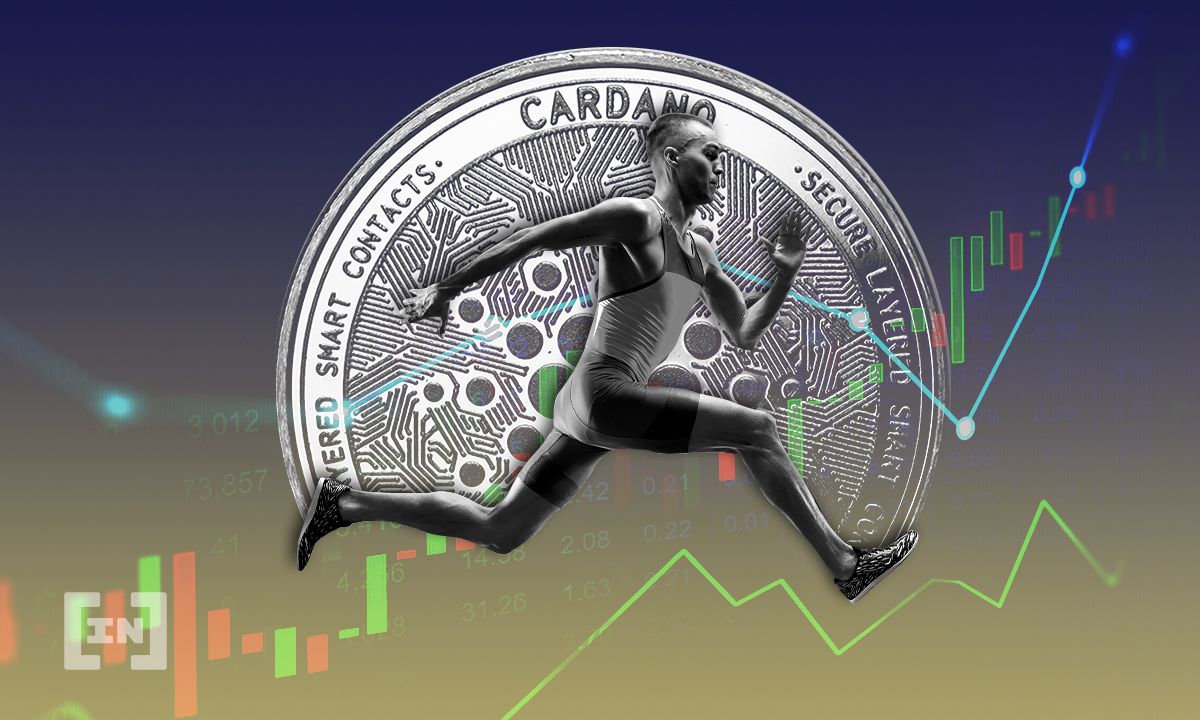
ADA has broken out from a descending resistance line.
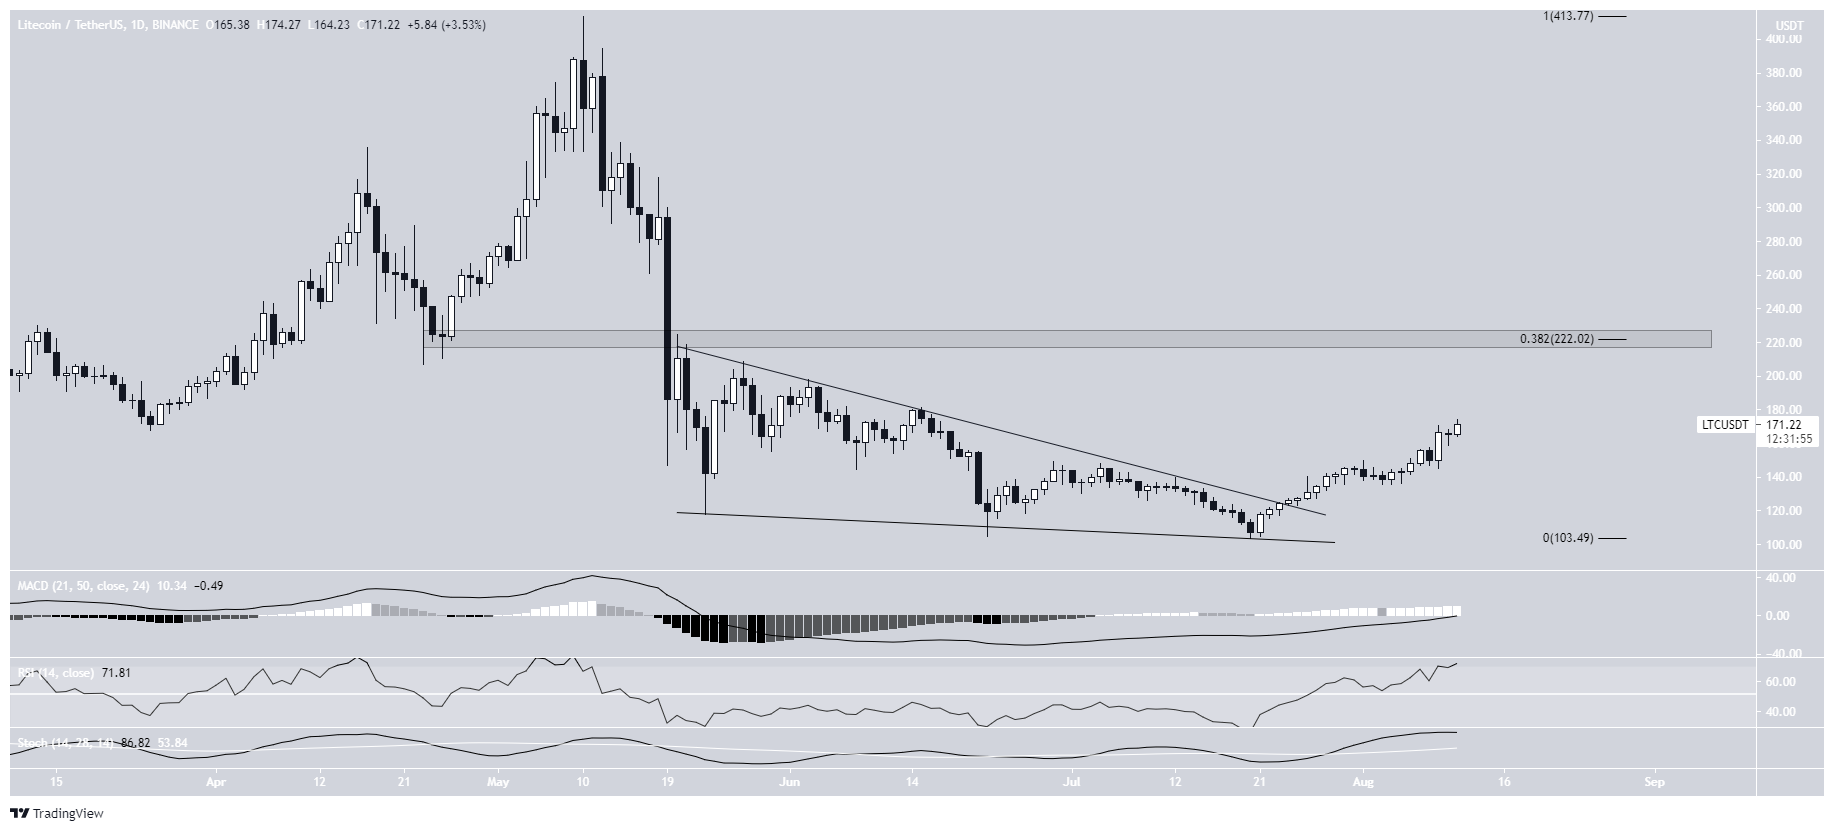
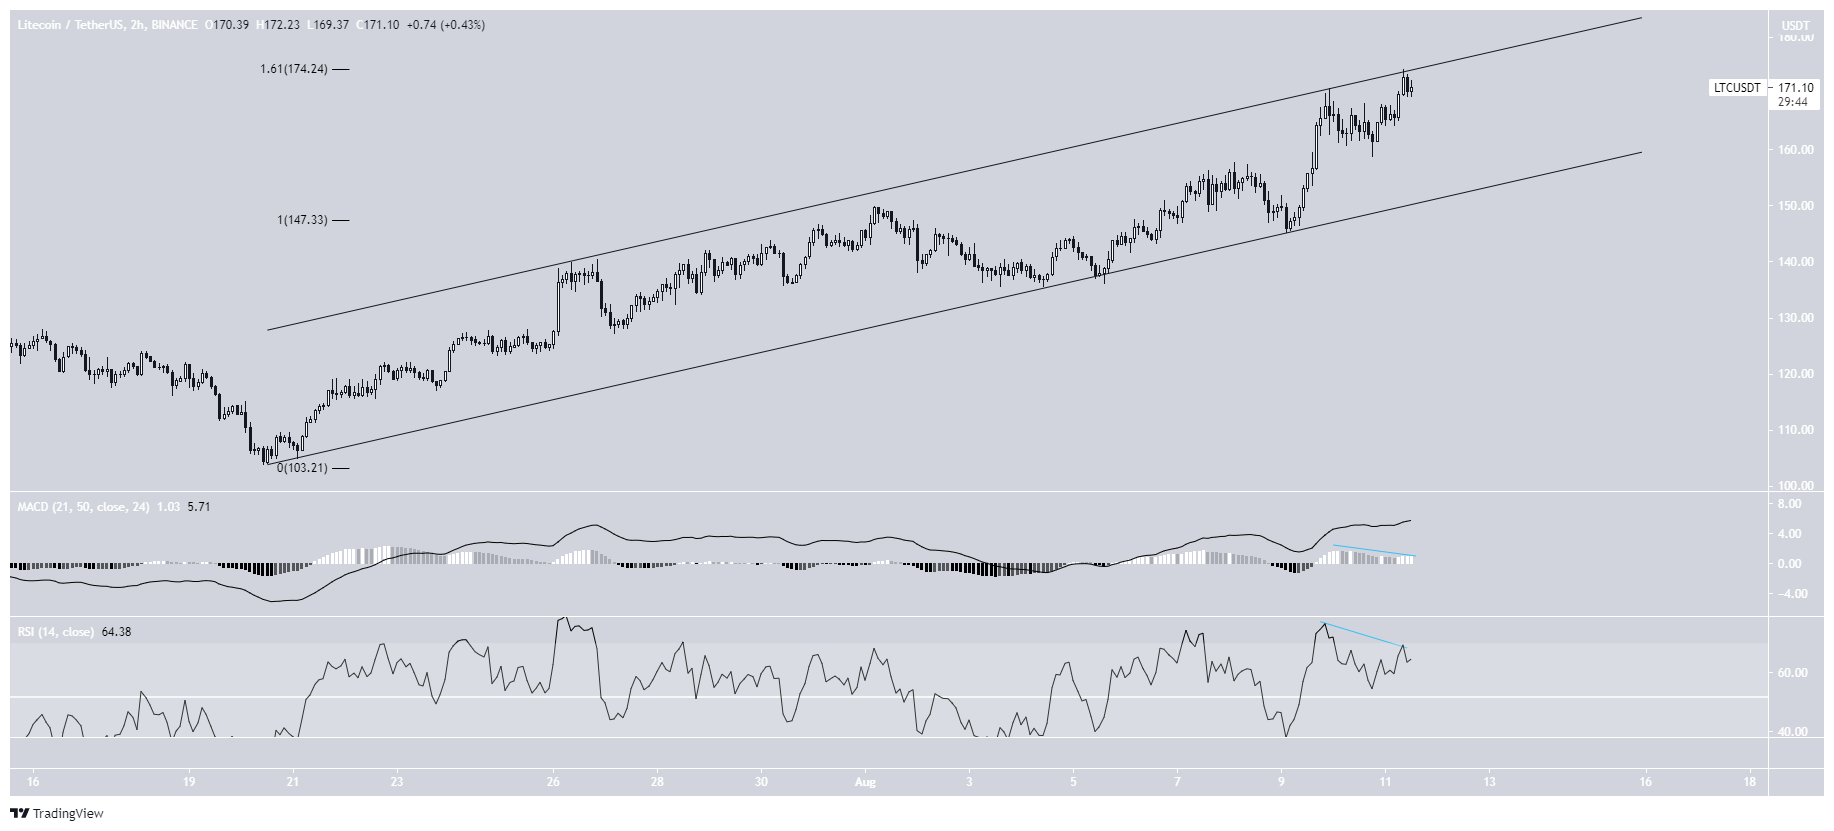
LTC has broken out from a descending wedge.
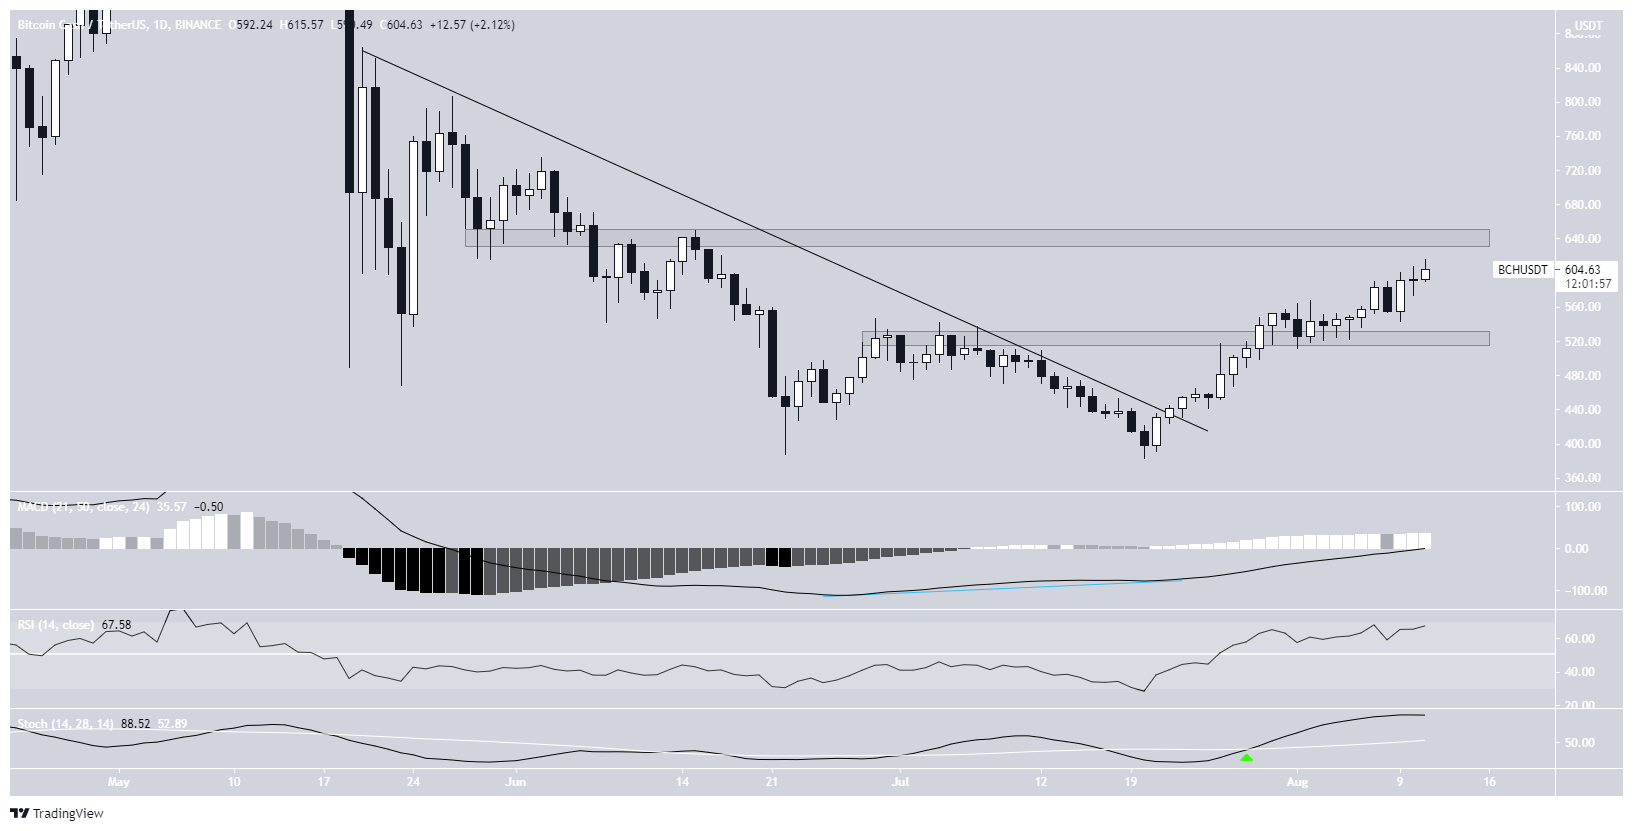
BCH is trading between support and resistance at $525 and $630.
promo
Cardano (ADA) has broken out from a descending resistance line and is trying to move above the $1.75-$1.83 resistance area.
Litecoin (LTC) has broken out from a descending wedge and is trading inside a short-term parallel channel.
Bitcoin Cash (BCH) has broken out from a descending resistance line and reclaimed the $525 horizontal area.
ADA
ADA has been increasing since it reached a low of $1.02 on July 20. While the rally initially stalled on Aug. 9, the token managed to resume its upward movement. This caused a breakout from both the $1.45 horizontal resistance area and a descending resistance line that had been in place since May 20. If a rejection occurs, the $1.45 area is now expected to act as support.
ADA is now approaching the main horizontal resistance area at $1.83. It has now traded above this level since May 19.
Technical indicators are bullish, supporting the continuation of the upward movement. The RSI has crossed above 70, the Stochastic oscillator is increasing and the MACD is positive.
Chart By TradingViewThe six-hour chart further solidifies the $1.83 area as resistance. Firstly, the 0.5 Fib retracement level is at $1.75 (white). Secondly, if the movement is an A-B-C structure, the 1.61 length of A would be at $1.81. Therefore, the entire $1.75-$1.83 area is likely to act as strong resistance. However, while the RSI is overbought, there are no clear signs of weakness yet. Chart By TradingView
Highlights
ADA has broken out from a descending resistance line.
There is resistance between $1.75-$1.83.
LTC
In the period from May 19 to July 24, LTC had been trading inside a descending wedge. After breaking out, it moved upwards with strength and has so far reached a high of $174.27 on Aug. 11.
The breakout was preceded by bullish divergence in the MACD and RSI. Since then, the MACD has crossed over into positive territory while the RSI has moved above 70. In addition to this, the Stochastic oscillator has made a bullish cross.
The main resistance area is at $222. This is a horizontal level that has previously acted as support and the 0.382 Fib retracement resistance level.
Chart By TradingView
However, the shorter-term two-hour chart casts some doubt in the possibility that LTC will get to the $222 resistance area.
Firstly, it is trading inside an ascending parallel channel, which is usually a corrective pattern. Secondly, it is trading at exactly the 1.61 Fib retracement level of the previous portion of the upward movement, which coincides with the resistance line of the channel.
In addition to this, both the RSI and MACD have generated bearish divergences. Therefore, until LTC manages to break out from this channel, we cannot consider the trend bullish.
Chart By TradingView
Highlights
LTC has broken out from a descending wedge.
It is trading inside a short-term ascending parallel channel.
BCH
On June 22 and July 20, BCH created a double bottom pattern, which was combined with bullish divergence in the MACD.
Afterwards, it managed to break out from a descending resistance line on, and reclaimed the $525 horizontal area afterwards.
Technical indicators are bullish, supporting the continuation of the upward movement.
The closest resistance area is at $635. A breakout above this level could trigger a sharp upward movement.
At the current time, we cannot accurately determine if BCH will break out.
Chart By TradingView
Highlights
BCH has broken out from a descending resistance line.
There is support and resistance at $525 and $630, respectively.
In line with the Trust Project guidelines, this price analysis article is for informational purposes only and should not be considered financial or investment advice. BeInCrypto is committed to accurate, unbiased reporting, but market conditions are subject to change without notice. Always conduct your own research and consult with a professional before making any financial decisions. Please note that our Terms and Conditions, Privacy Policy, and Disclaimers have been updated.
Valdrin discovered cryptocurrencies while he was getting his MSc in Financial Markets from the Barcelona School of Economics. Shortly after graduating, he began writing for several different cryptocurrency related websites as a freelancer before eventually taking on the role of BeInCrypto's Senior Analyst.
(I do not have a discord and will not contact you first there. Beware of scammers)