

The Ethereum (ETH) price reached a high of $289.42 on May 30. A rapid decrease was followed by an increase. A high near $272 was reached on Jun 2. The price has been decreasing since.
Ethereum Price (ETH): Trends and Highlights for June 5
- The Ethereum price reached a high of $289 on May 30.
- It is trading inside a descending wedge.
- In the long-term, it has made a double top.
- There is bearish divergence developing in the RSI.
- The price is trading below the 10- and 20-day moving averages.
- There is support near $230.
ETH Price: Descending Wedge
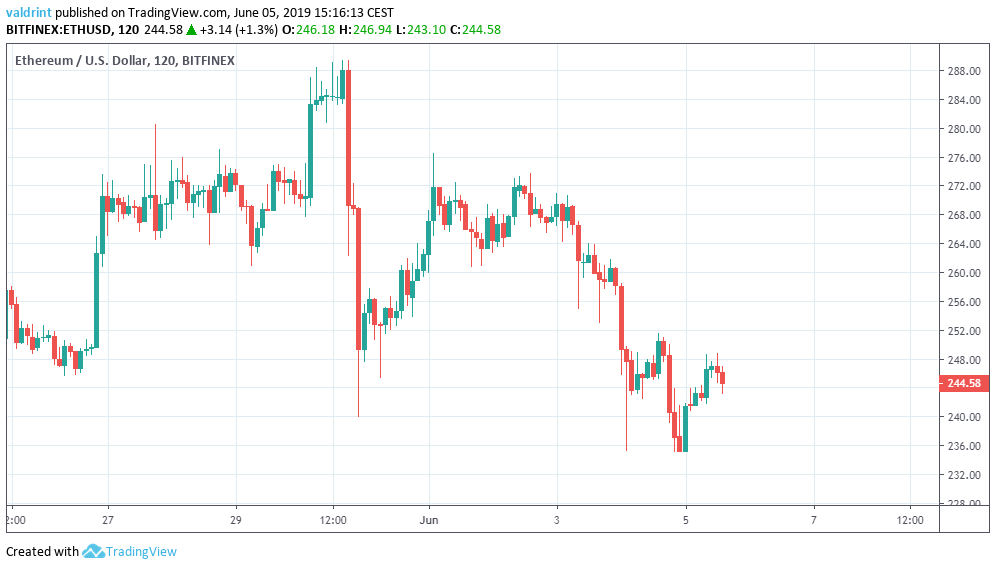
The price of Ethereum is analyzed at two-hour intervals from May 26 to June 5 in order to analyze its current pattern.
On May 26, ETH/USD reached a low of $245.55. A gradual upward move ensued, which took it to a high of $289.42 on May 30. A rapid decrease ensued.
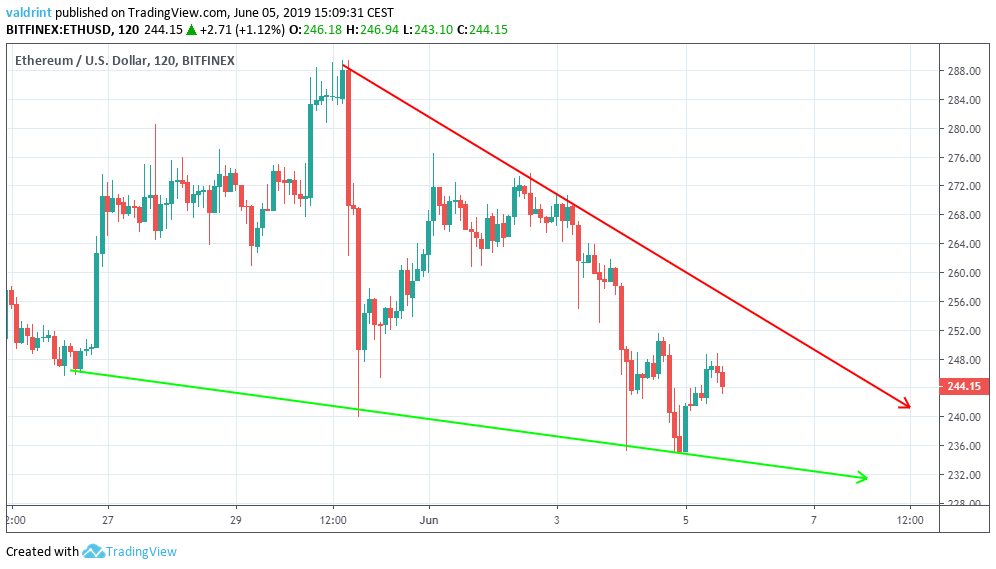
Since then, the price has been creating lower highs and lows. Tracing them gives us a descending wedge:
Ethereum Price: Bearish Divergence
The Ethereum price is analyzed alongside the RSI below: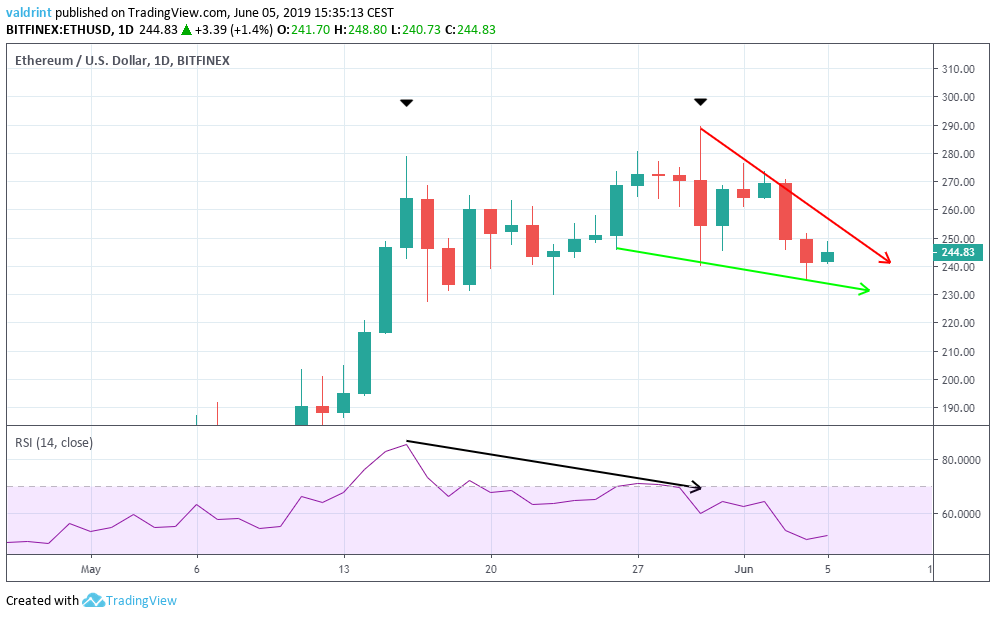 The ETH price reached higher highs on May 16 and 30. The candlesticks were characterized with long upper wicks. This indicates that there is selling pressure in the market.
During this period, the RSI generated lower highs. This is known as bearish divergence and often precedes price decreases. In the case of ETH, it preceded the downward move beginning from the May 30 high of $289.42.
The ETH price reached higher highs on May 16 and 30. The candlesticks were characterized with long upper wicks. This indicates that there is selling pressure in the market.
During this period, the RSI generated lower highs. This is known as bearish divergence and often precedes price decreases. In the case of ETH, it preceded the downward move beginning from the May 30 high of $289.42.
Moving Averages
The Ethereum (ETH) price is analyzed at daily intervals alongside the 10-day and 20-day moving averages (MA).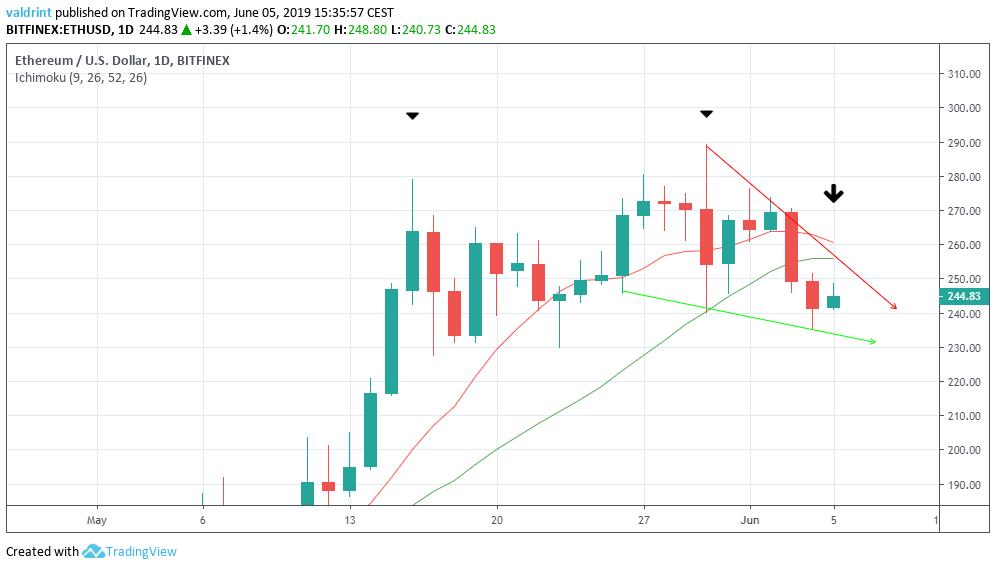 On Jun 3, the Ethereum price (ETH) began a rapid downward move. It created a bearish engulfing candle which dropped it below both MAs.
Furthermore, they are very close to making a bearish cross.
This combined with the bearish divergence in the previous section makes it likely that the price will continue to decrease. A breakout from the wedge is unlikely.
On Jun 3, the Ethereum price (ETH) began a rapid downward move. It created a bearish engulfing candle which dropped it below both MAs.
Furthermore, they are very close to making a bearish cross.
This combined with the bearish divergence in the previous section makes it likely that the price will continue to decrease. A breakout from the wedge is unlikely.
Reversal Areas
One support area is traced for ETH/USD below: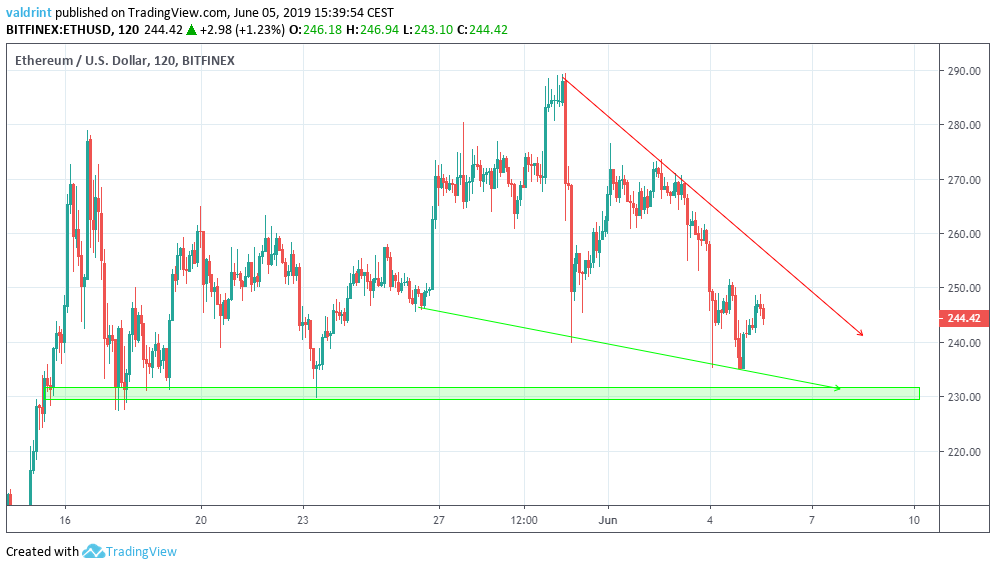 The closest support area is found near $230. If the ETH price decreases at the rate predicted by the wedge, it should reach this area on Jun 8-10. A breakdown below this area could trigger a rapid decrease and complete the double top pattern. The analysis of technical indicators supports this scenario.
Summary
To conclude, the Ethereum price (ETH) has recently experienced significant decreases. Furthermore, the technical indicators paint a bearish picture. However, a breakdown from the current pattern has yet to occur. According to the technical indicators, it is likely that it will do so in the future. What do you think about the future Ethereum (ETH) price? Let us know your thoughts in the comments below! Disclaimer: This article is not trading advice and should not be construed as such. Always consult a trained financial professional before investing in cryptocurrencies, as the market is particularly volatile.
Top crypto platforms in the US

 eToro
Explore
Explore
Explore
Explore
eToro
Explore
Explore
Explore
Explore
Don’t invest unless you’re prepared to lose all
the money you invest.
This is a high-risk investment and you should not expect to be protected if something goes wrong.
Take 2 mins to learn more
Don’t invest unless you’re prepared to lose all
the money you invest.
This is a high-risk investment and you should not expect to be protected if something goes wrong.
Take 2 mins to learn more
Don’t invest unless you’re prepared to lose all
the money you invest.
This is a high-risk investment and you should not expect to be protected if something goes wrong.
Take 2 mins to learn more
Don’t invest unless you’re prepared to lose all
the money you invest.
This is a high-risk investment and you should not expect to be protected if something goes wrong.
Take 2 mins to learn more
Don’t invest unless you’re prepared to lose all
the money you invest.
This is a high-risk investment and you should not expect to be protected if something goes wrong.
Take 2 mins to learn more
Don’t invest unless you’re prepared to lose all
the money you invest.
This is a high-risk investment and you should not expect to be protected if something goes wrong.
Take 2 mins to learn more
Top crypto platforms in the US
Coinbase
eToro
eToro
eToro
eToro
COCA wallet
UpHold
Moonacy
Don’t invest unless you’re prepared to lose all
the money you invest.
This is a high-risk investment and you should not expect to be protected if something goes wrong.
Take 2 mins to learn more
Don’t invest unless you’re prepared to lose all
the money you invest.
This is a high-risk investment and you should not expect to be protected if something goes wrong.
Take 2 mins to learn more
Don’t invest unless you’re prepared to lose all
the money you invest.
This is a high-risk investment and you should not expect to be protected if something goes wrong.
Take 2 mins to learn more
Disclaimer
In adherence to the Trust Project guidelines, BeInCrypto is committed to unbiased, transparent reporting. This news article aims to provide accurate, timely information. However, readers are advised to verify facts independently and consult with a professional before making any decisions based on this content. Please note that our Terms and Conditions, Privacy Policy, and Disclaimers have been updated.

Advertorial
Advertorial is the universal author name for all the sponsored content provided by BeInCrypto partners. Therefore, these articles, created by third parties for promotional purposes, may not align with BeInCrypto views or opinion. Although we make efforts to verify the credibility of featured projects, these pieces are intended for advertising and should not be regarded as financial advice. Readers are encouraged to conduct independent research (DYOR) and exercise caution. Decisions based on...
Advertorial is the universal author name for all the sponsored content provided by BeInCrypto partners. Therefore, these articles, created by third parties for promotional purposes, may not align with BeInCrypto views or opinion. Although we make efforts to verify the credibility of featured projects, these pieces are intended for advertising and should not be regarded as financial advice. Readers are encouraged to conduct independent research (DYOR) and exercise caution. Decisions based on...
READ FULL BIO
Sponsored
Sponsored