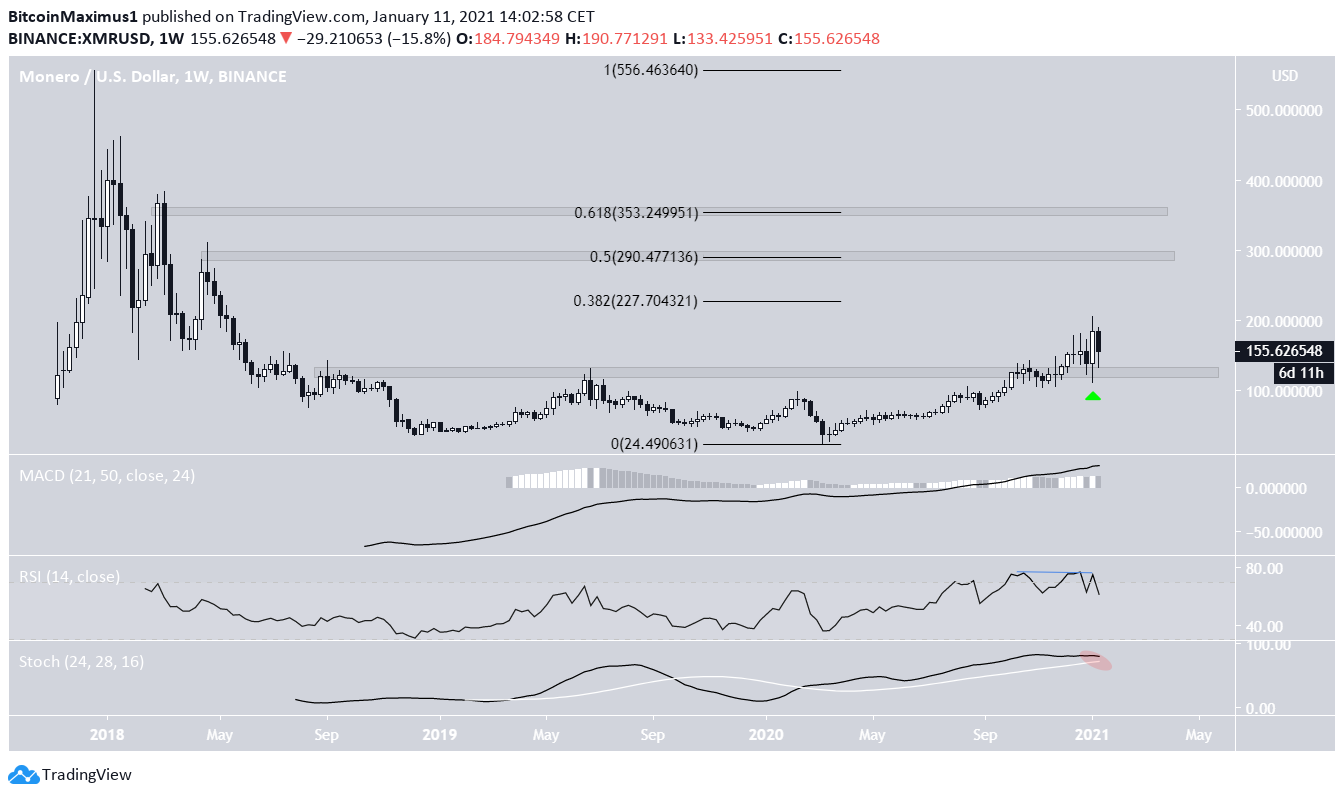
The Monero (XMR) price has reclaimed a long-term resistance level at $125 and validated it as support afterward. As long as XMR is trading above this level, the trend is bullish.
Long-Term Resistance
At the end of Nov., XMR moved above the $125 area, which had been acting as resistance since Sept. 2018. It validated the level as support afterward and has been moving upwards since.
The closest resistance areas are at $227, $290, and $353, the 0.382, 0.5, and 0.618 Fib retracement levels of the entire downward move. Besides being Fib levels, the latter two also provide horizontal resistance.
However, technical indicators are relatively bearish. While the MACD is moving upwards, the RSI has formed bearish divergence, and the Stochastic Oscillator is close to making a bearish cross.
Despite this, the trend is bullish as long as the price is trading above the $125 area.
XMR’s Future Movement
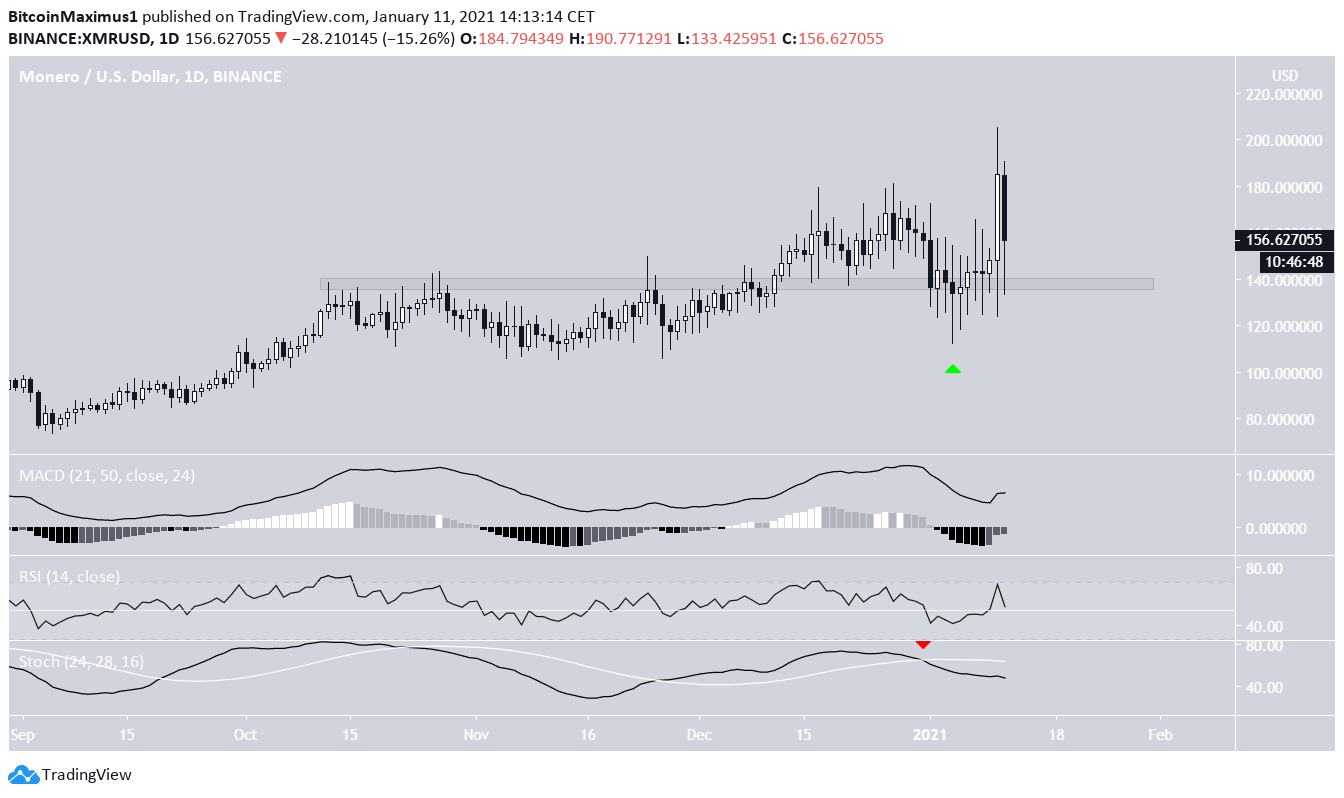
The daily chart provides another support area, this one at $138. XMR initially deviated below this level but has reclaimed it since and is currently validating it as support.
However, similar to the weekly time-frame, technical indicators are ambiguous. While the MACD is above 0 and the RSI is above 50, the Stochastic Oscillator has made a bearish cross.
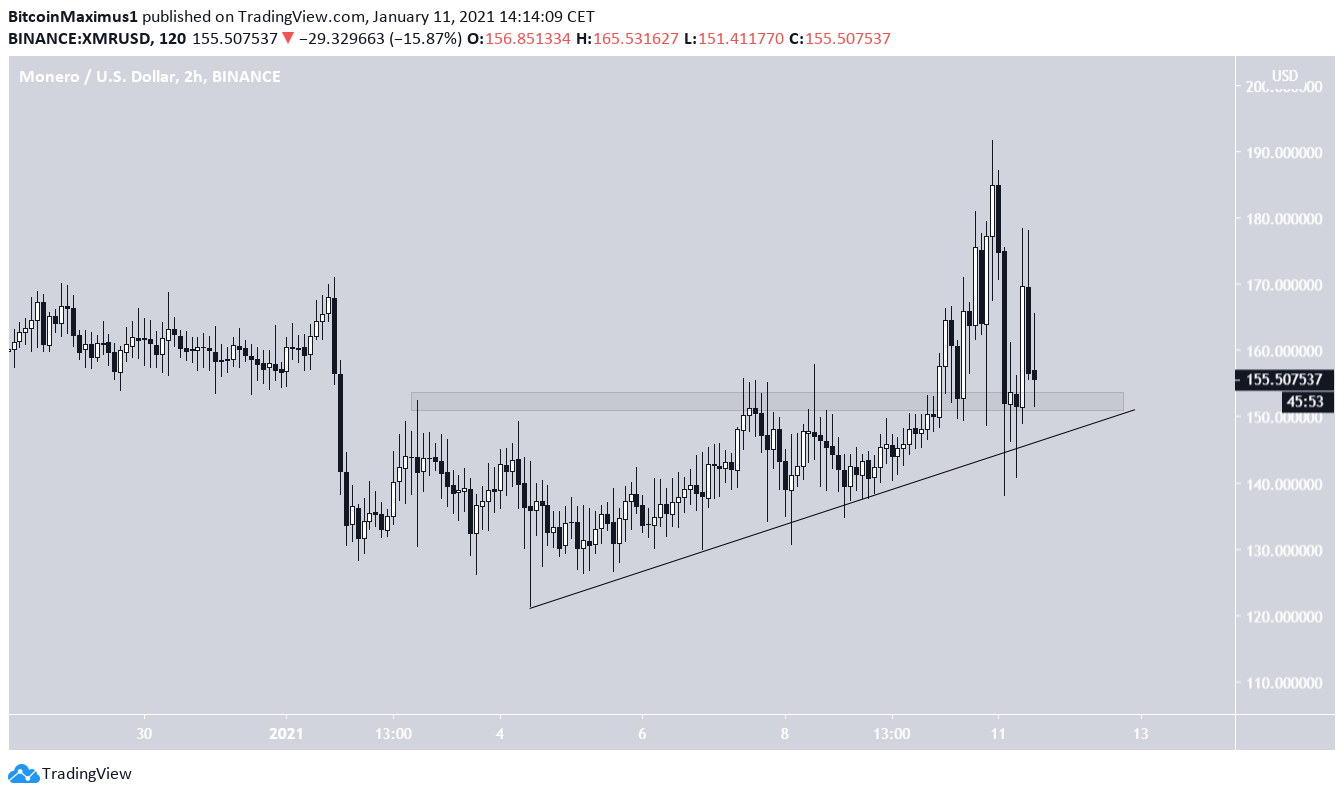
Nevertheless, the two-hour chart shows an ascending support line and another re-test of the previous resistance area at $152.
Therefore, it’s more likely that the price will move higher.
Wave Count
In our previous article, we stated that:
“XMR has completed waves 1 and 2 (shown in white) of a bullish impulse that began in March. It has now likely begun wave 3.
A preliminary target for the top of wave 3 is found at $305, which would give waves 1:3 a 1:1.61 ratio — a common pattern in bullish impulses.”
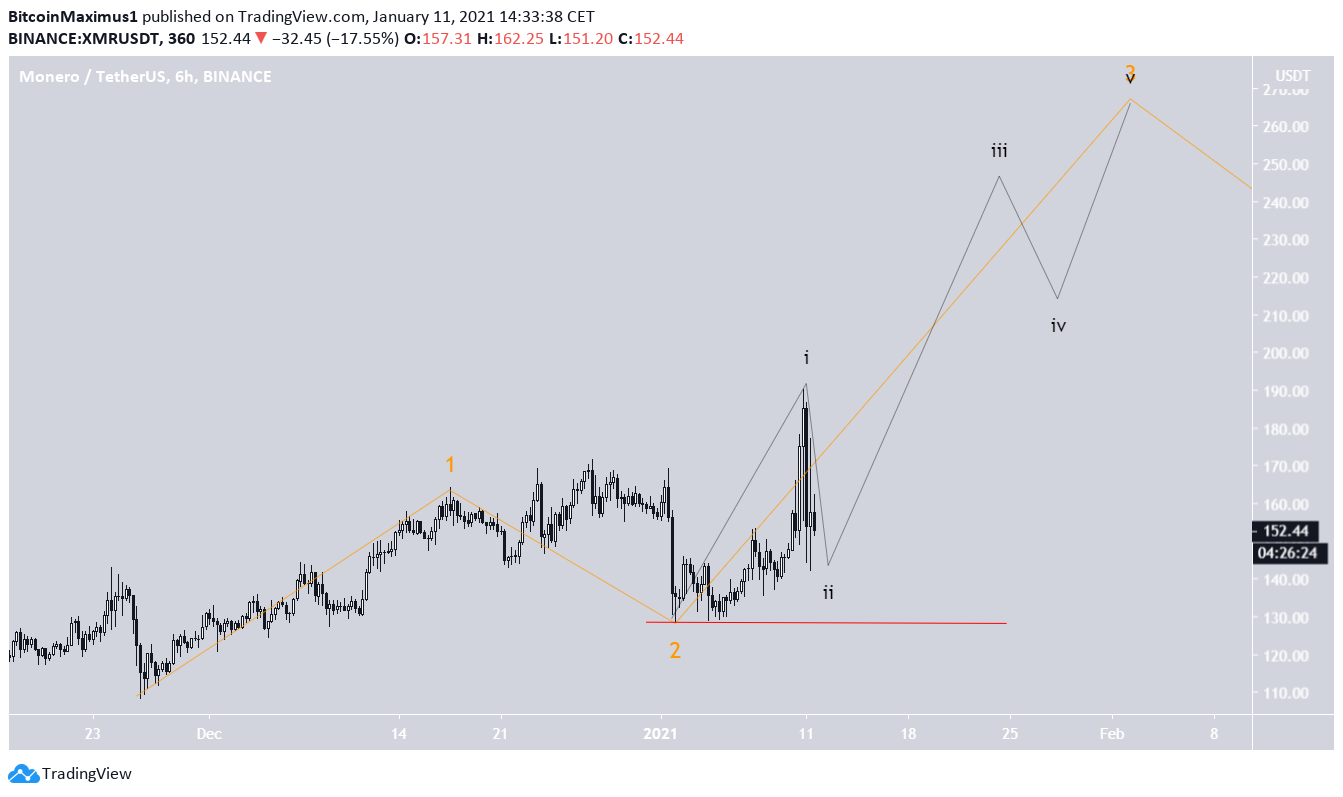
The sub-wave count is given in orange.
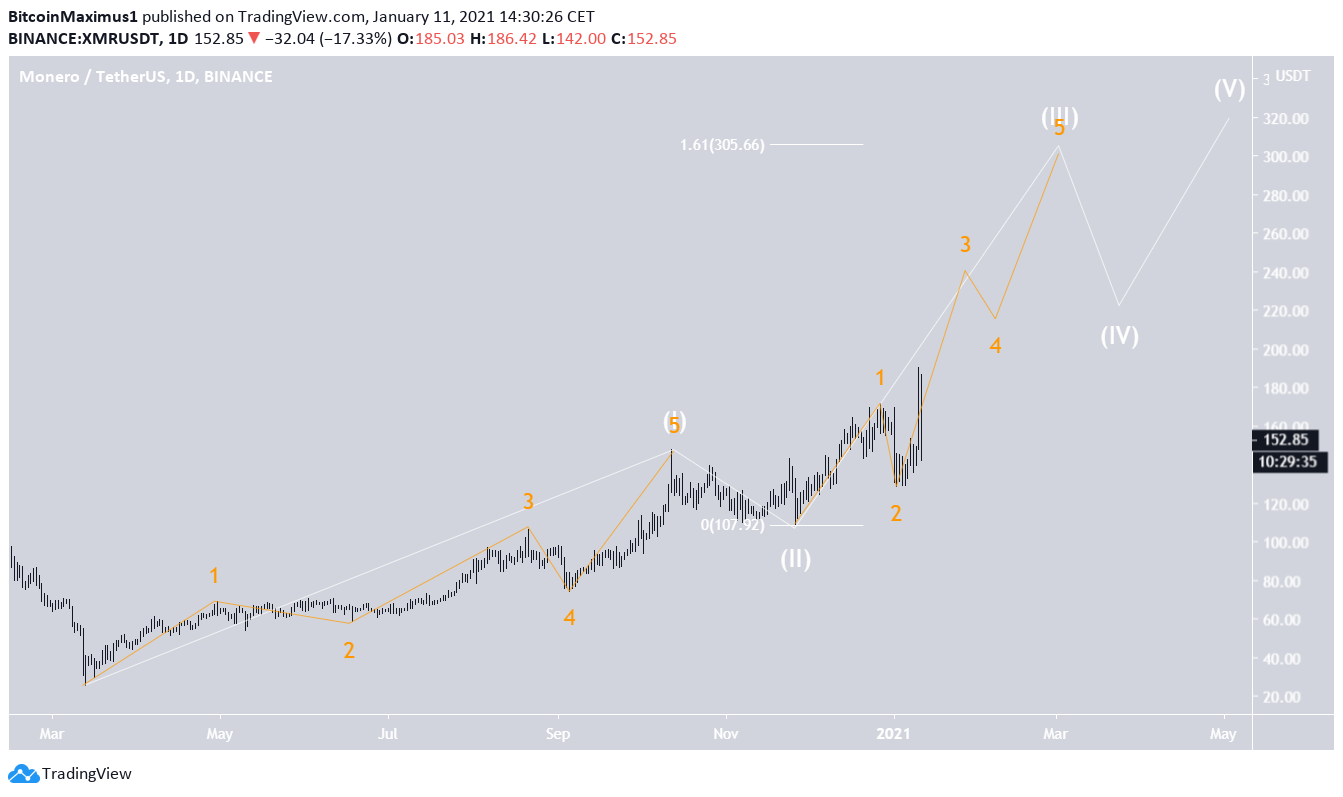
If the count is correct, XMR has just begun an extended sub-wave 3, with the minor sub-wave count given in black.
A decline below the sub-wave 2 low at $128 would invalidate this particular wave count.
XMR/BTC
Cryptocurrency trader @Lucidarque outlined an XMR/BTC chart, stating that it has approached a significant support area and could bounce from the current level.
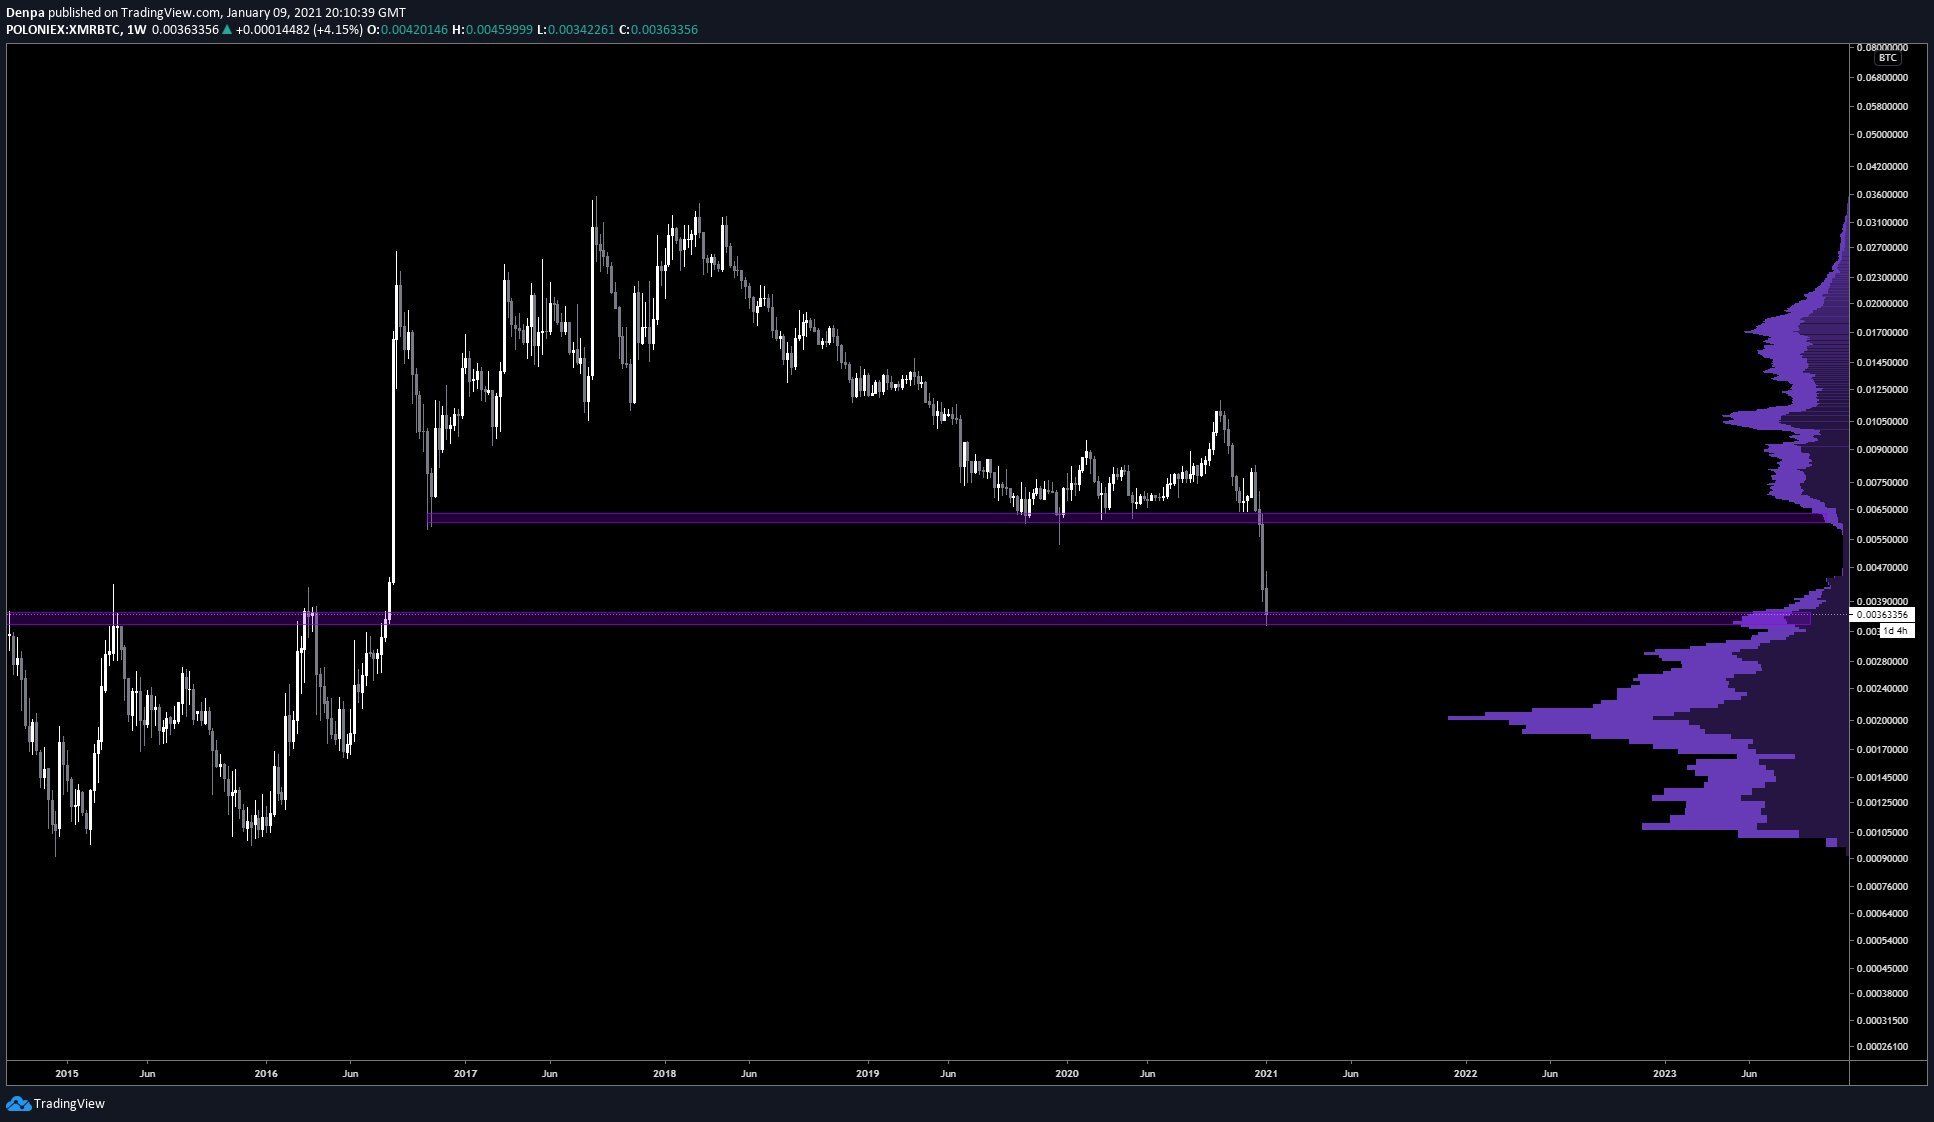
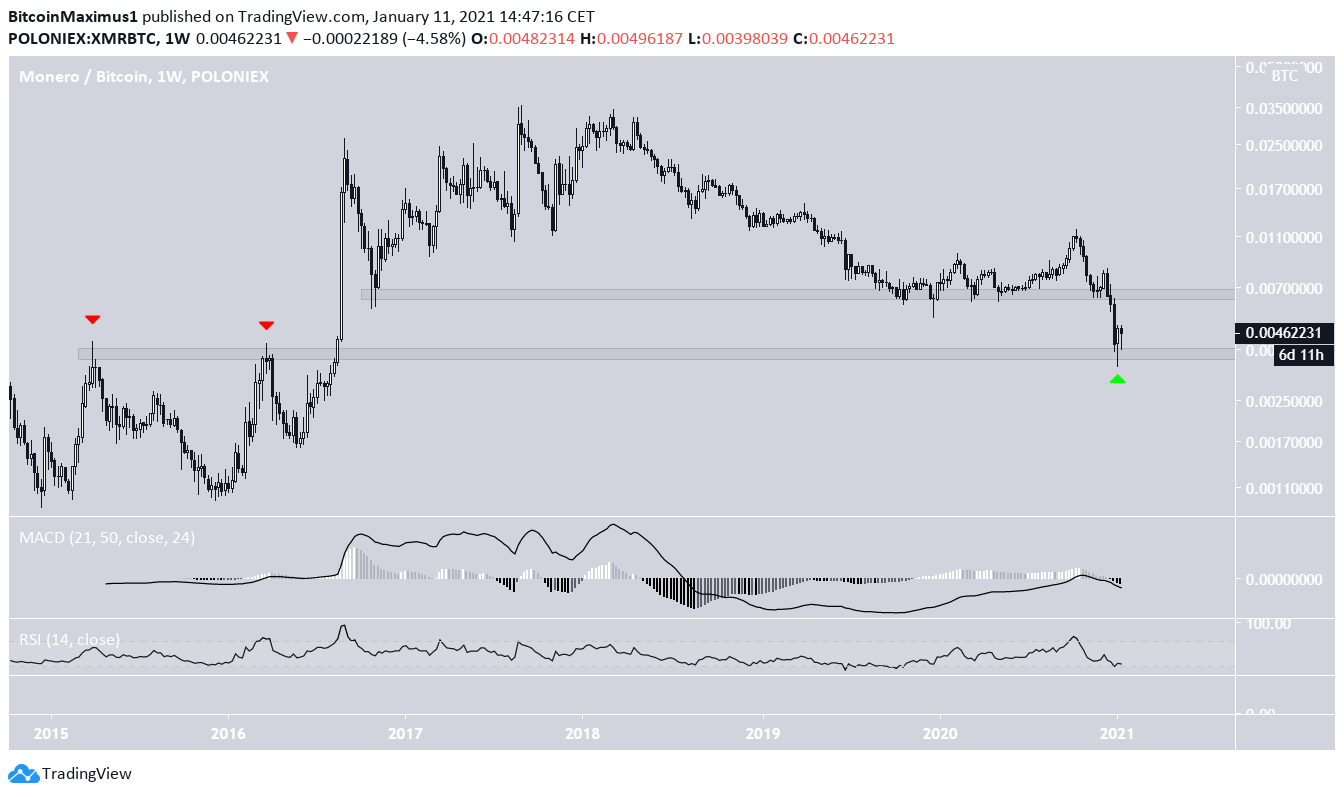
XMR has reached the support area at ₿0.0038, a level that has not been touched since it initially broke out in March 2016.
Nevertheless, there are no bullish reversal signs yet. Until XMR reclaims the breakdown level at ₿0.0065, the trend is bearish.
Conclusion
To conclude, the XMR/USD price movement looks bullish as long as XMR is trading above the support levels at $138 and $125.
Despite falling to its lowest level in nearly five years, there are no bullish reversal signs yet for the XMR/BTC pair, which would signal a trend reversal.
For BeInCrypto’s latest Bitcoin (BTC) analysis, click here!
Disclaimer: Cryptocurrency trading carries a high level of risk and may not be suitable for all investors. The views expressed in this article do not reflect those of BeInCrypto.
Disclaimer
In line with the Trust Project guidelines, this price analysis article is for informational purposes only and should not be considered financial or investment advice. BeInCrypto is committed to accurate, unbiased reporting, but market conditions are subject to change without notice. Always conduct your own research and consult with a professional before making any financial decisions. Please note that our Terms and Conditions, Privacy Policy, and Disclaimers have been updated.


