


Injective (INJ) is in the process of breaking out from a descending resistance line. Aptos (APT) and Sun (SUN) could soon break out from long-term resistance lines. Maker (MKR) and Quant (QNT) have already broken out.
Even though the month of May was mostly bearish for the cryptocurrency market, several altcoins posted significant gains, bucking the bearish trend in the process. The five altcoins below could do the same in June.
Injective (INJ) Altcoin Price Can Move to Double Digits
Since the beginning of the year, the INJ price has been mired in a five-wave upward movement. If so, it is currently in the fifth and final wave of this increase.
By studying recurring long-term price patterns and investor psychology, technical analysts utilize the Elliott Wave theory to ascertain the trend’s direction.
The INJ price will soon break out from its ascending parallel channel if the count is correct Then, it could increase to the next resistance at either or $11 or $14.30.
The former is found by the 0.618 length of waves one and three, while their 1:1 length finds the latter. Since the latter also coincides with a horizontal resistance area, it is more likely to act as the top.
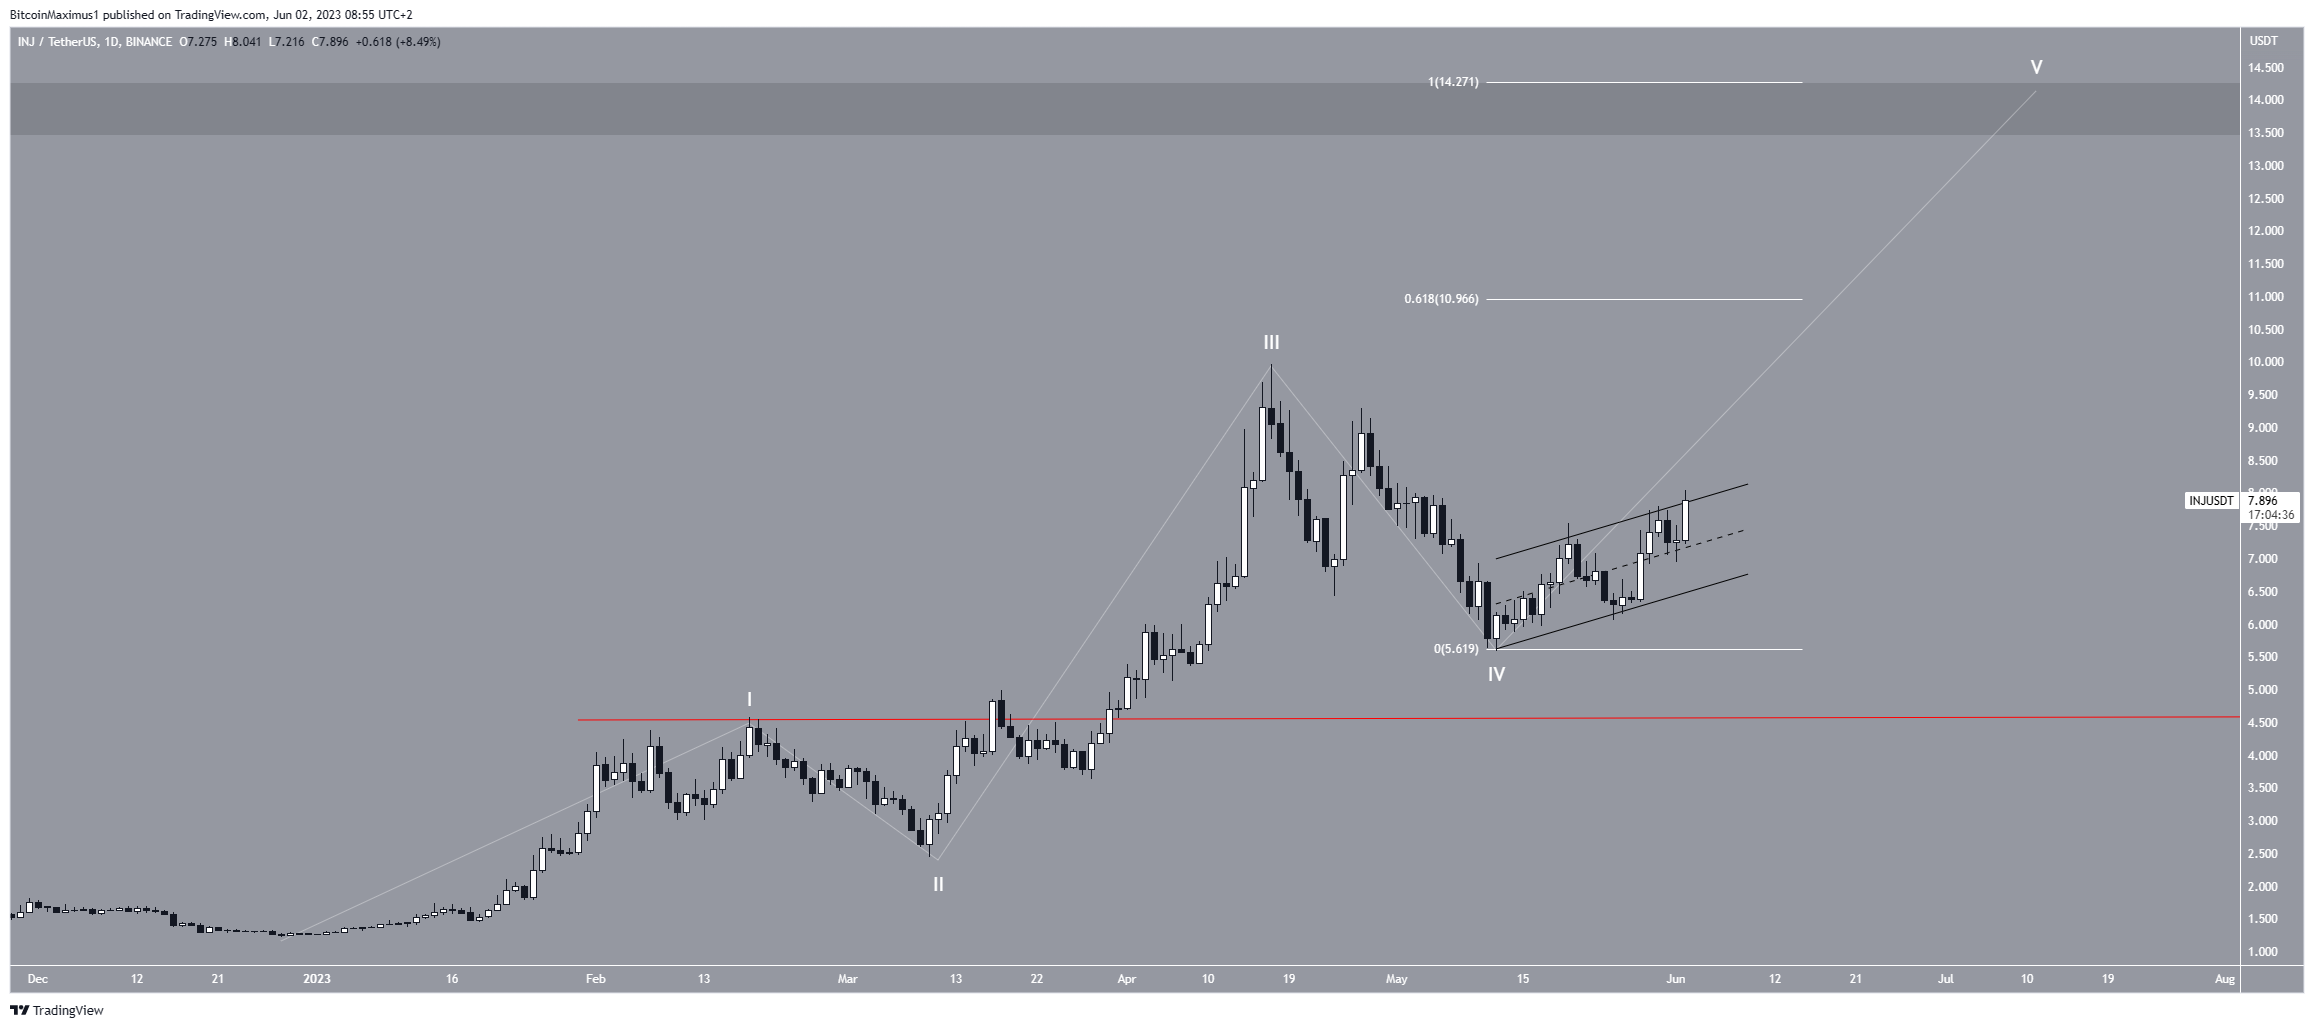
Despite this bullish INJ price prediction, a decrease below the wave one high at $4.53 will mean that the trend is still bearish.
In that case, INJ could fall to the next closest support at $3.
Will Aptos (APT) Break Out From 127-Day Resistance?
The APT price has fallen under a descending resistance line since the beginning of the year. However, the price created a double bottom pattern inside the $8 horizontal support area. Currently, APT is in the process of breaking out from the line, which has been in place for 127 days. Breakouts from such long-term structures usually lead to significant upward movements.
If APT does clear the line, it could increase to the next resistance at $14. The daily RSI supports the ongoing increase. Market traders use the RSI as a momentum indicator to identify overbought or oversold conditions, and to decide whether to accumulate or sell an asset. Readings above 50 and an upward trend indicate that bulls still have an advantage, whereas readings below 50 suggest the opposite. The indicator is above 50 and increasing, a sign of a bullish trend.
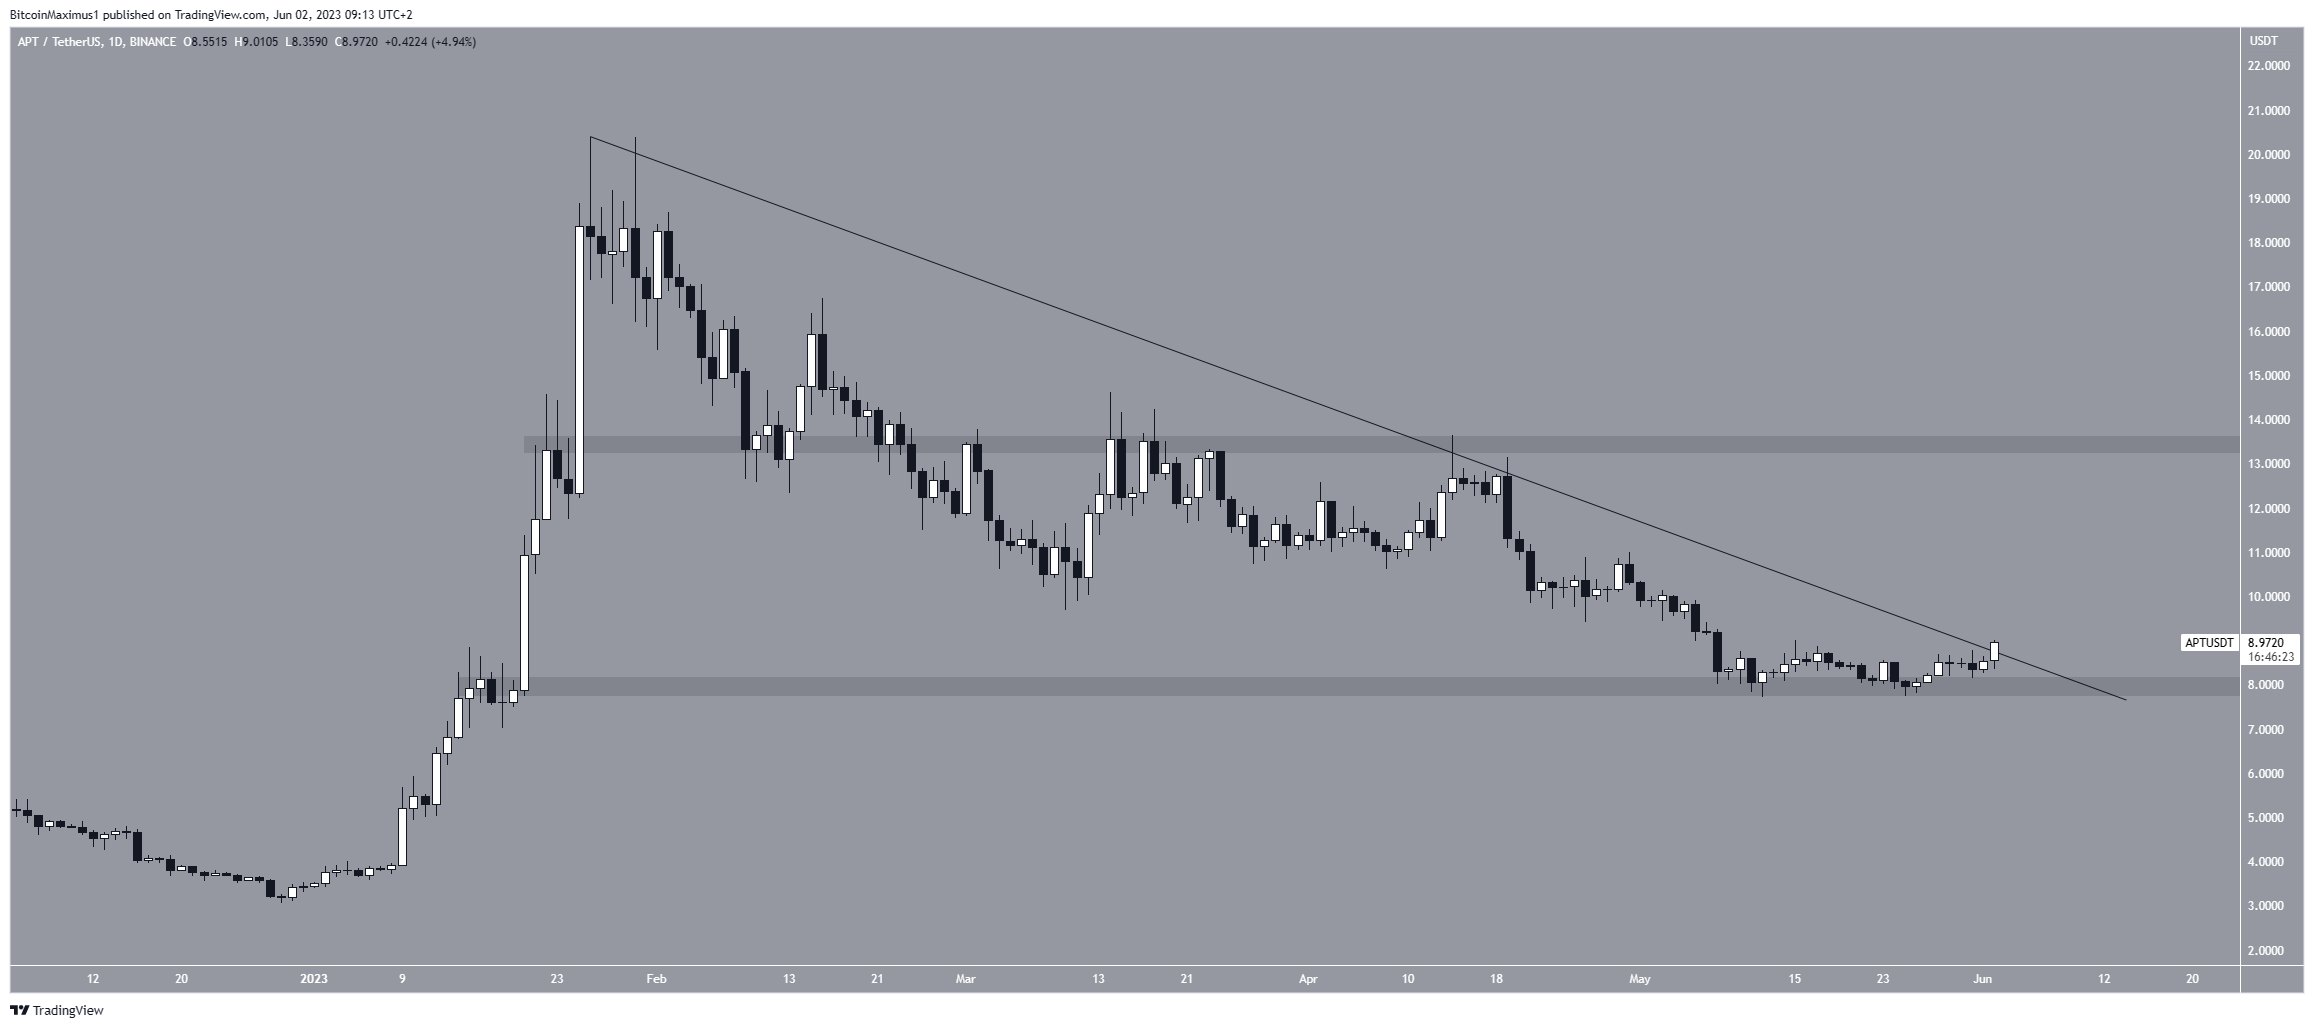
However, this bullish APT price prediction will be invalidated with a close below $8. In that case, a fall to $4 could ensue.
Maker (MKR) Clears Resistance After Bullish Pattern
The MKR price has fallen under a descending resistance line since the beginning of March. The decrease led to a low of $600 in May 2023.
However, the price bounced afterward and broke out from the line on May 29. The bounce was preceded by the creation of a double bottom, which is considered a bullish pattern. Moreover, the pattern was combined with a bullish divergence in the RSI (green line), another bullish sign.
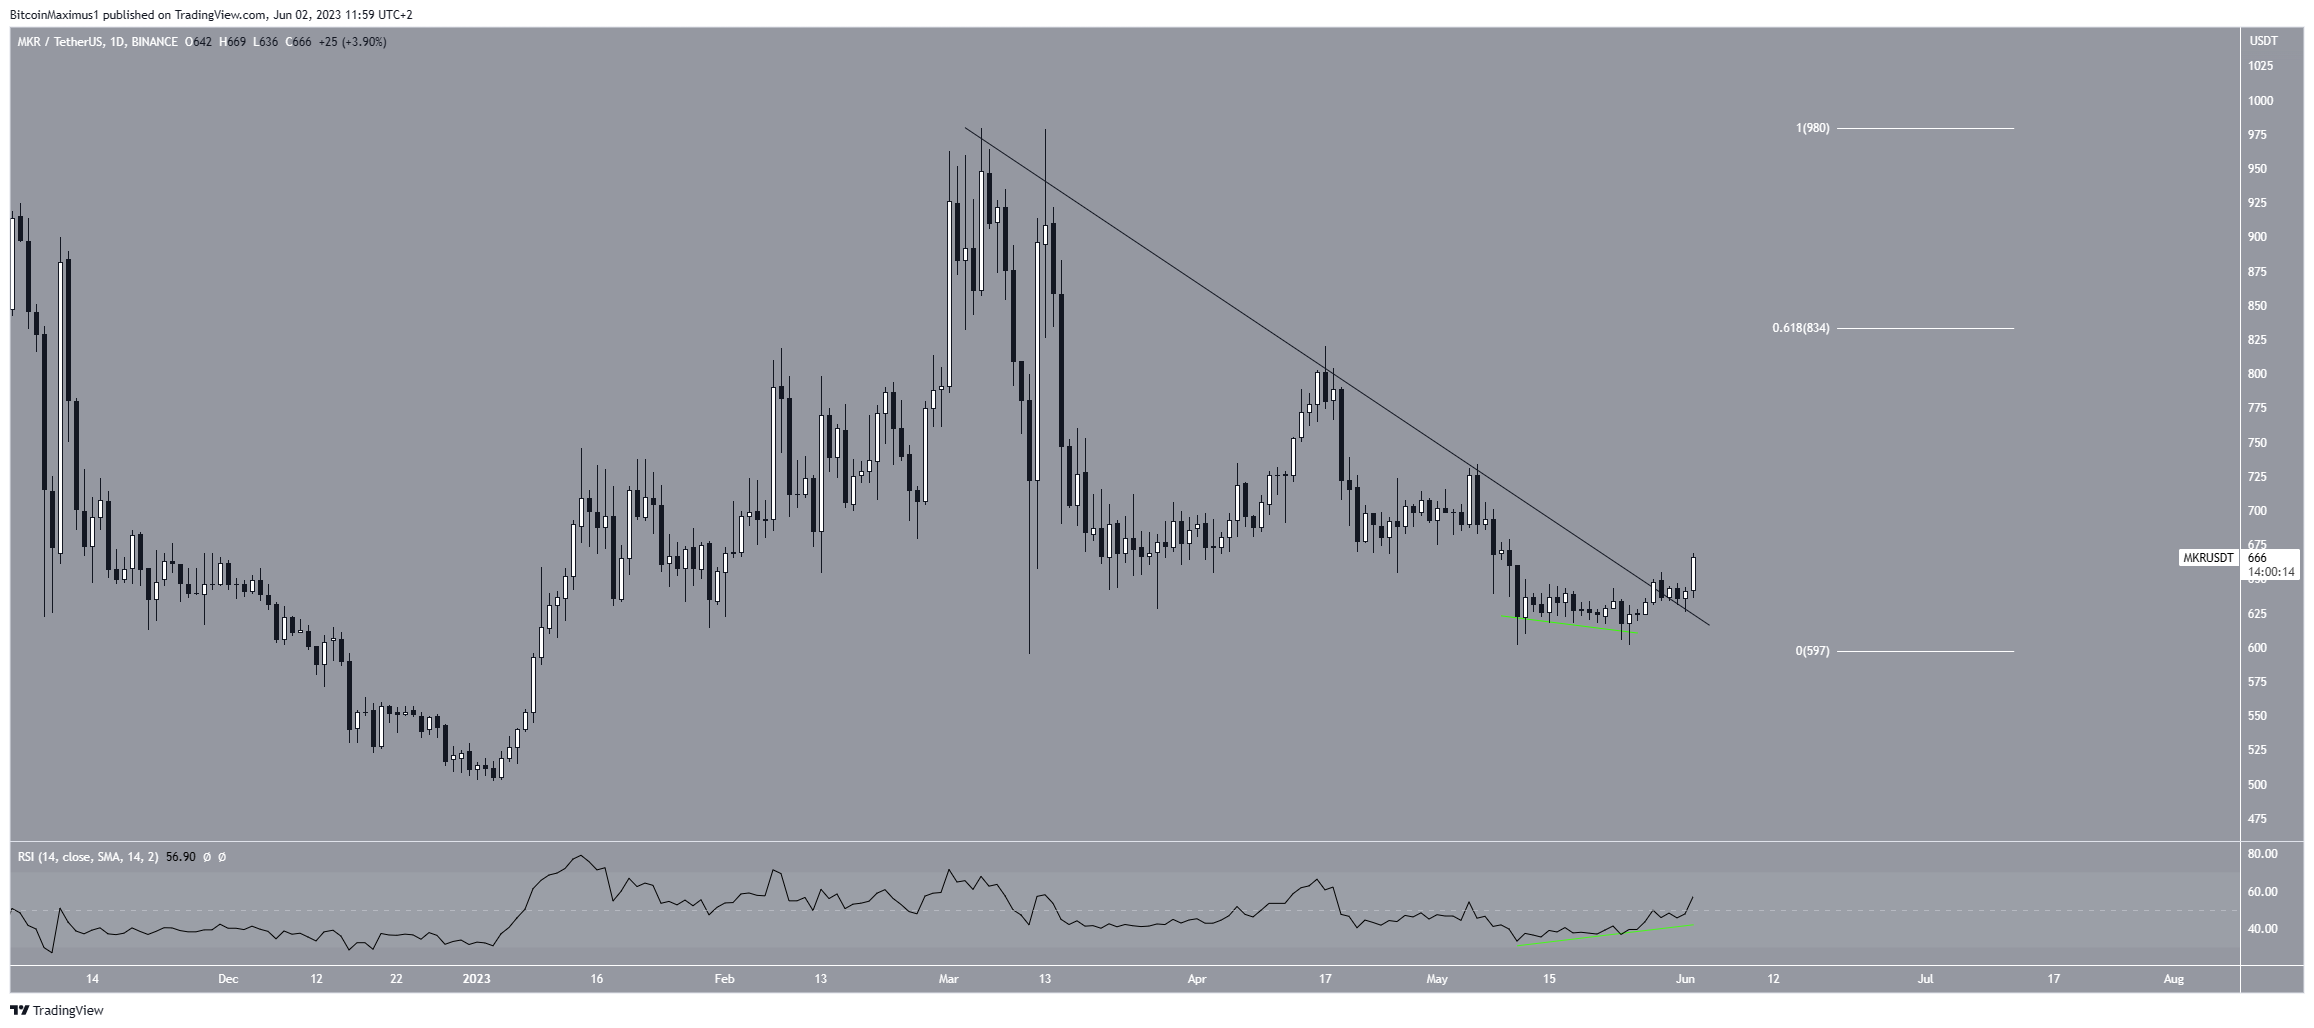
If the upward movement continues, the next resistance will be at $834. However, if the price fall below $600, a sharp plunge to $500 could follow.
Quant (QNT) Price Clears Major Resistance
The QNT price has fallen under a descending resistance line since the beginning of February. The decrease led to a low of $96 in May 2023.
However, the altcoin’s price bounced afterwards and broke out from the line on May 28. This led to a new high of $120 on June 1. Since the price broke out from the line, it is likely that the correction is complete.
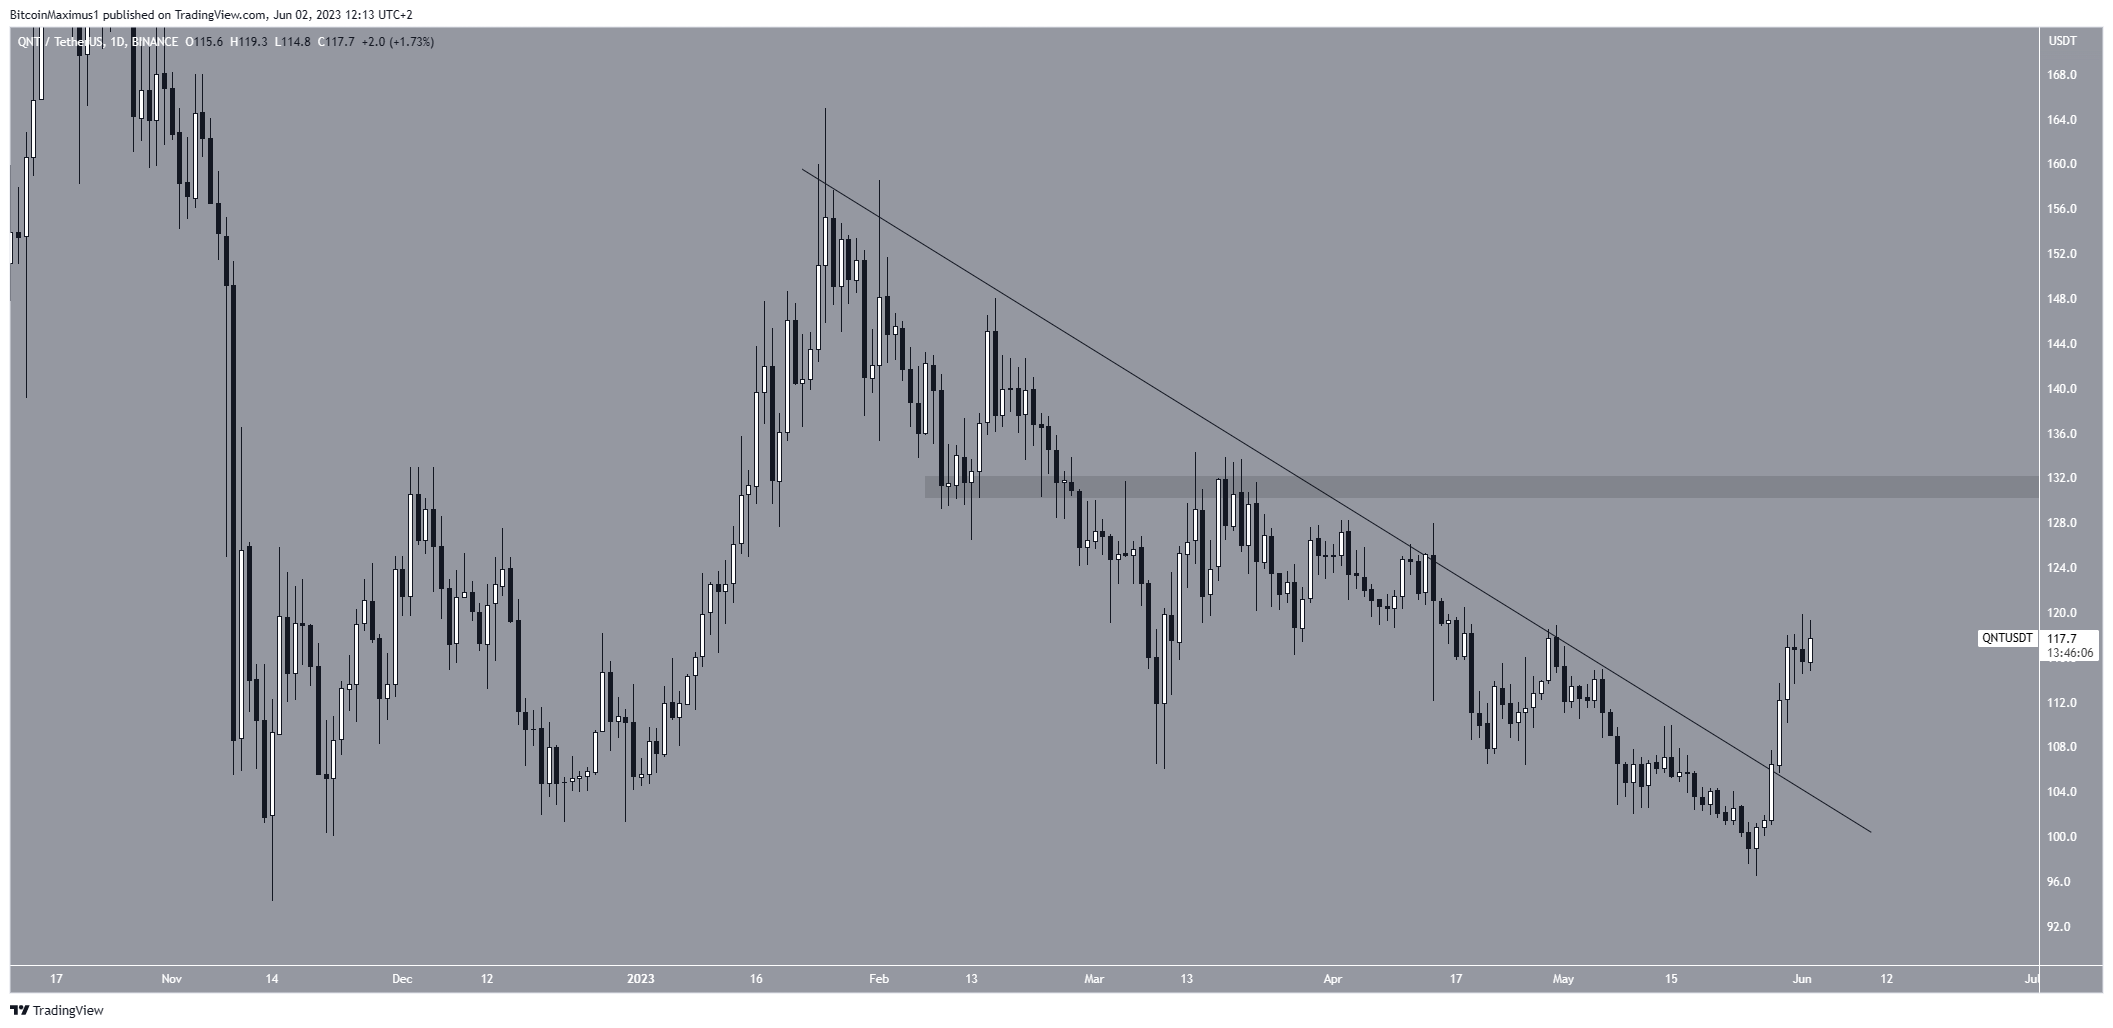
If the upward movement continues, the next resistance will be at $132. However, if the price suffers a reversal, it could fall to the next closest support at $100.
Can Sun (SUN) Break Out Above Long-Term Resistance
The SUN price had fallen under a descending resistance line since October 2022. The line has caused numerous rejections, the most recent on May 22 (red icon), 2023. However, the SUN price is attempting to break out again.
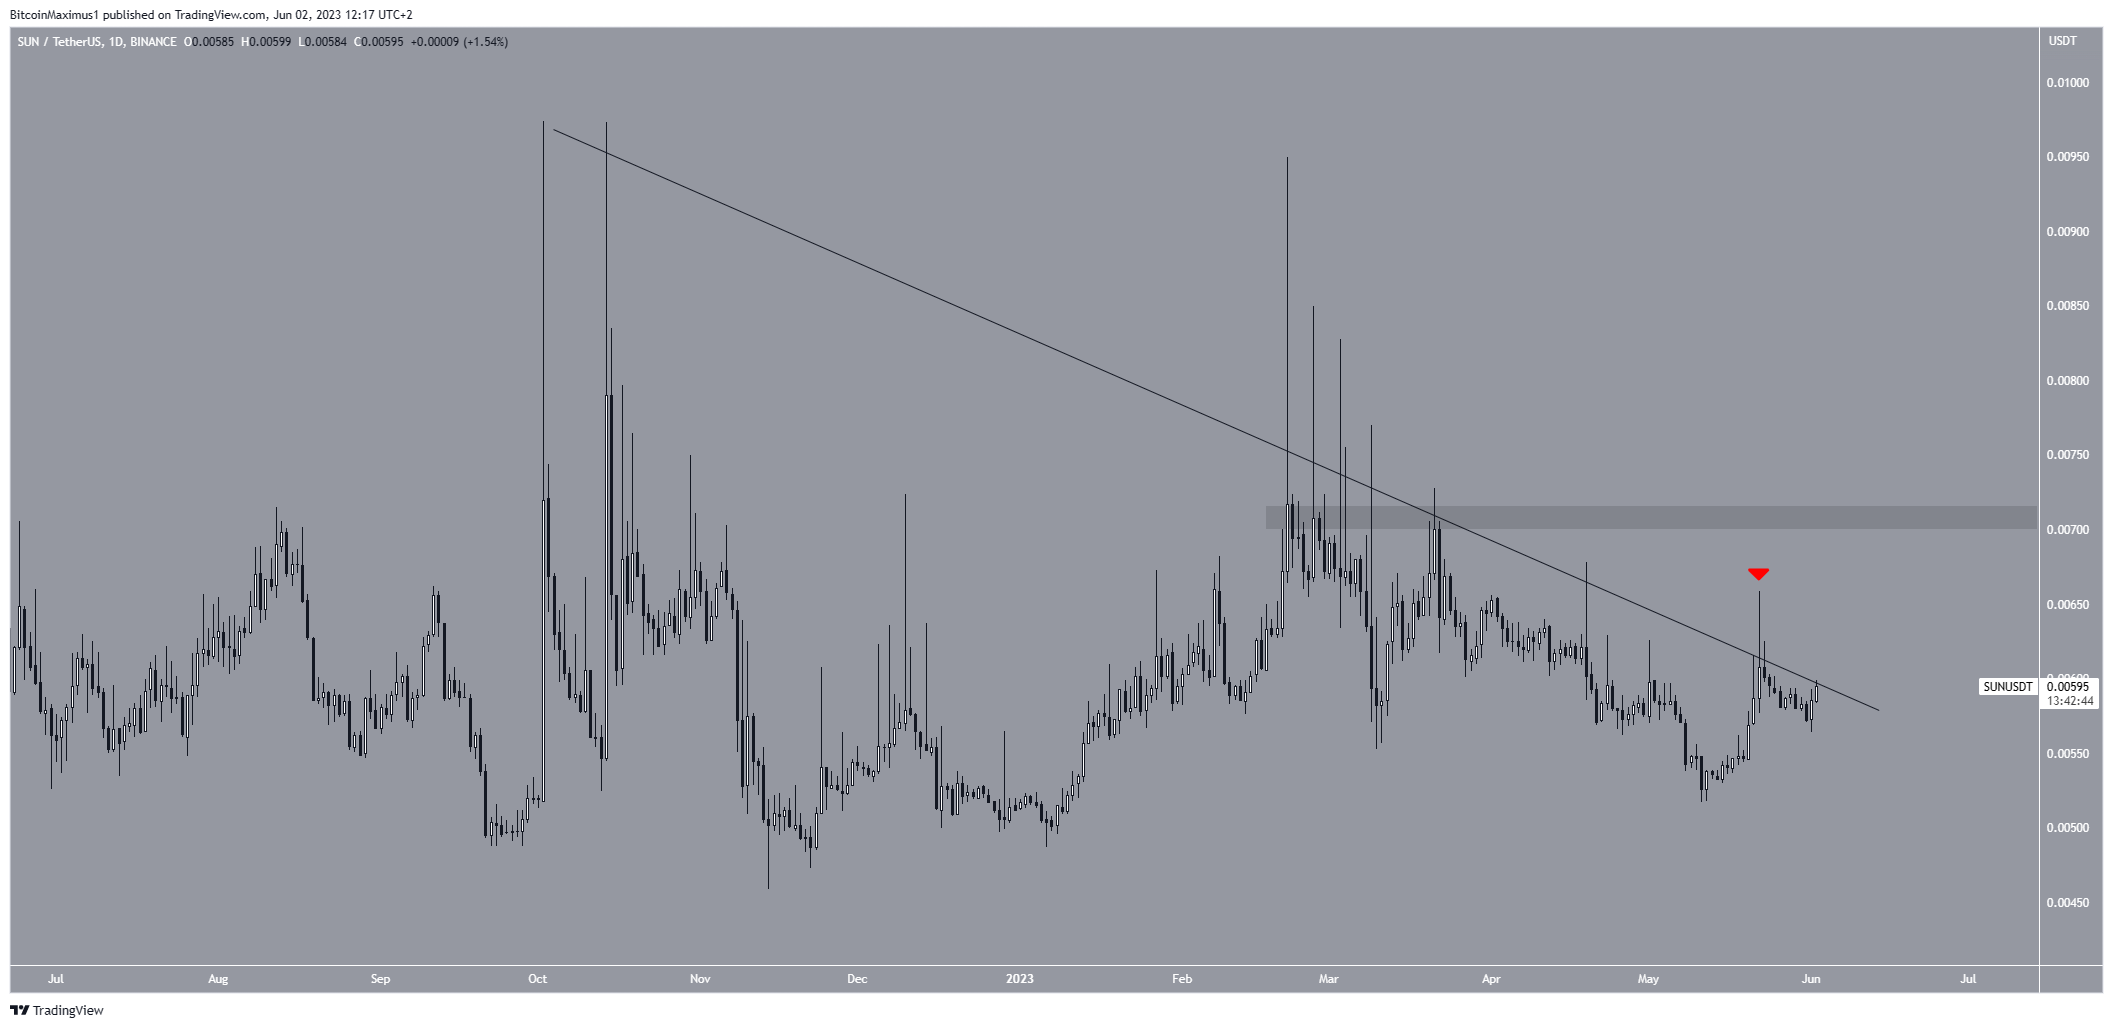
If it is successful, it could increase to the next resistance at $0.0072. However, if a rejection follows, a drop to $0.005 will be on the cards.
For BeInCrypto’s latest crypto market analysis, click here


