![2018 Bitcoin Fractal Suggests BTC Has Bottomed [Premium Analysis]](/_mfes/post/_next/image/?url=https%3A%2F%2Fassets.beincrypto.com%2Fimg%2FZCONk_xhzc6TqH5kngV60WLwBzE%3D%2Fsmart%2F012d211311c44cf2a5d8e6059e438920&w=1920&q=75)
On November 25, 2019, the Bitcoin price reached a low of $6618 and immediately reversed — reaching a high of $7913 after four days. It has been decreasing since.
The decrease has taken the shape of a descending wedge. If the Bitcoin price continues trading inside this wedge until the end of December and breaks out, it would validate a fractal from 2018 that suggests the price has already reached a bottom.
Cryptocurrency analyst and trader @davthewave outlined a fractal for the Bitcoin price in which the movement since the low on November 25 is similar to that of the December 2018 bottom.
… the capitulation should not be as aggressive as last time.
Taking the medium term moving average [200 MDA], there's a good chance the extension below it would only amount to half this time round with reduced volatility and an ongoing bull market in mind. pic.twitter.com/yas5SYafmD
— dave the wave🌊🌓 (@davthewave) December 16, 2019
Additionally, he used the 200-day moving average (MA) to show that volatility has been decreasing during the second movement. Let’s take a closer look at this fractal and see its implications if it indeed plays out.
Moving Average Volatility
The fractal indicates that the movement after the December 15, 2018 bottom is similar to that after November 25, 2019. In order to outline the reduced volatility, the trader has used the 200-day MA.
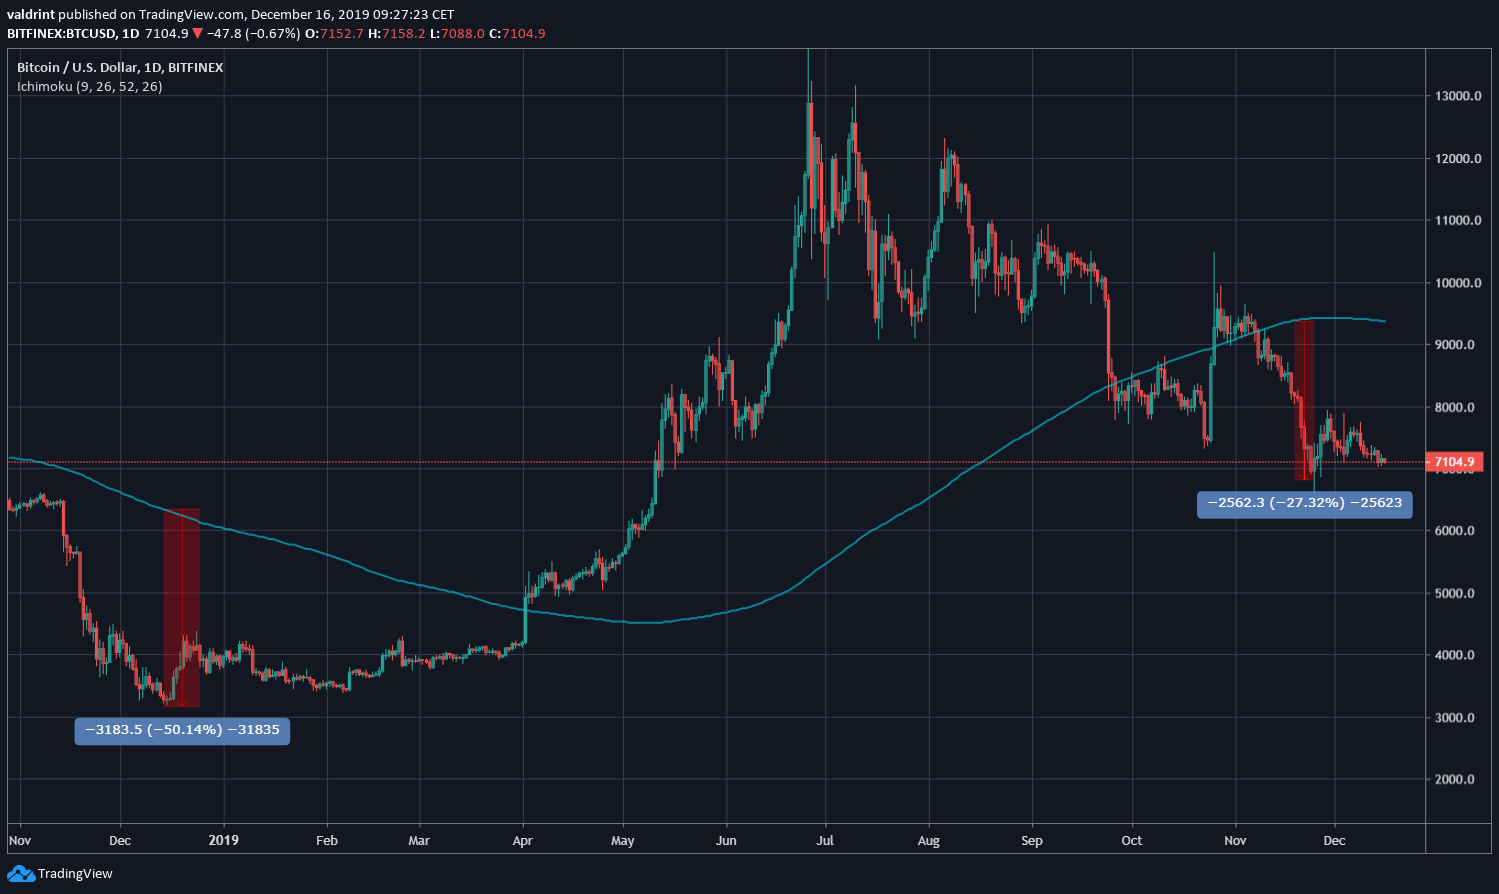
On December 15, 2018, the price as 50 percent below its 200-day MA. On November 25, 2019, it was roughly 27 percent below it — indicating that, while the decrease was substantial, the price remained close to its 200-day MA.
2018 Bitcoin Movement
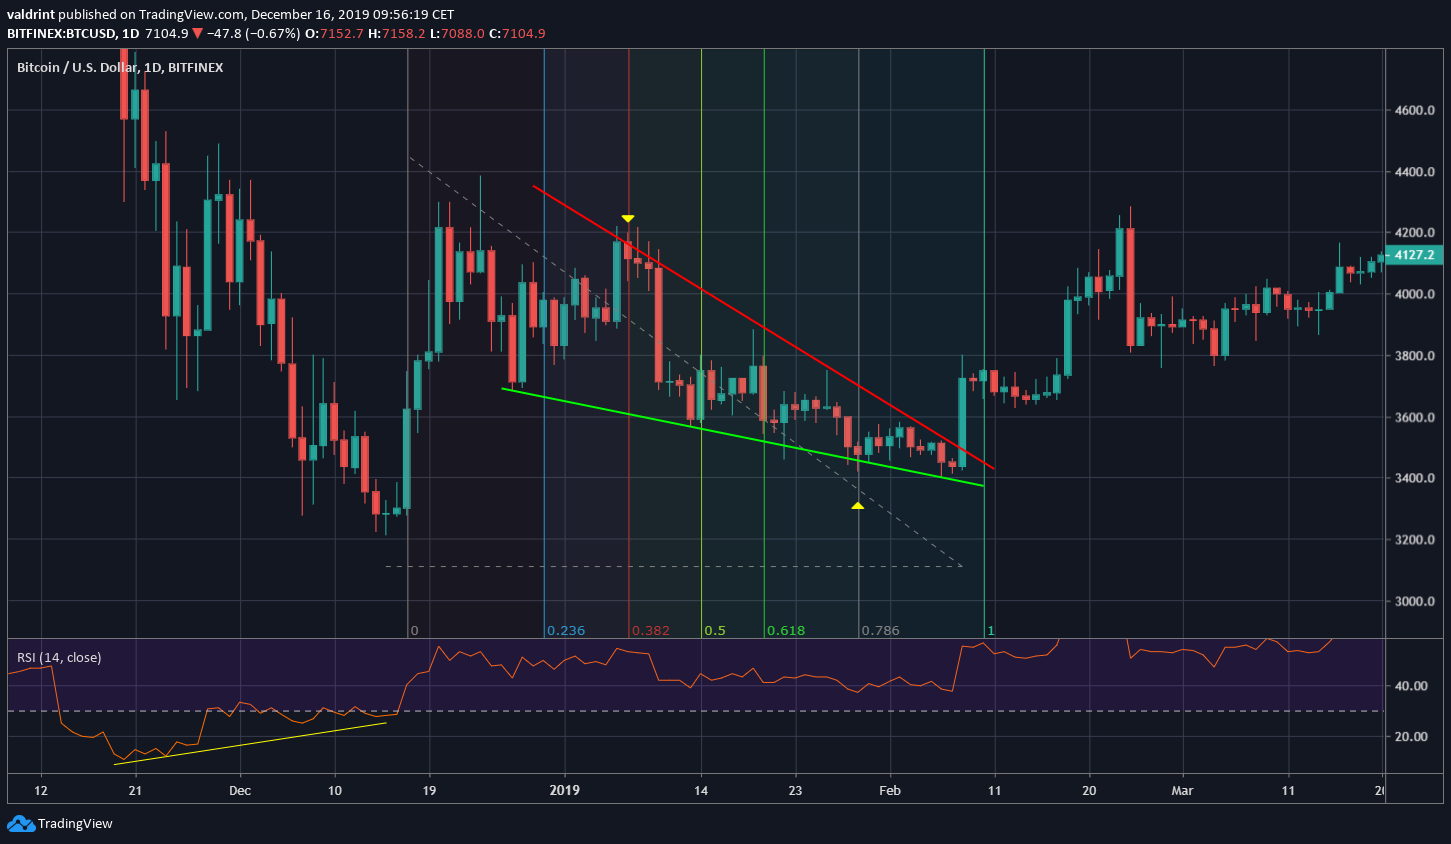
The December 2018 bottom was preceded by a bullish divergence in the RSI. Afterward, the Bitcoin price increased all the way to $4400 before creating a descending wedge. The RSI was slightly below 40 throughout this wedge.
The decrease from the wedge began slightly after the 0.382 level and continued until the 0.786 one — when the price reached the support line of the wedge. Afterward, the price broke out and again reached $4400.
2019 Movement
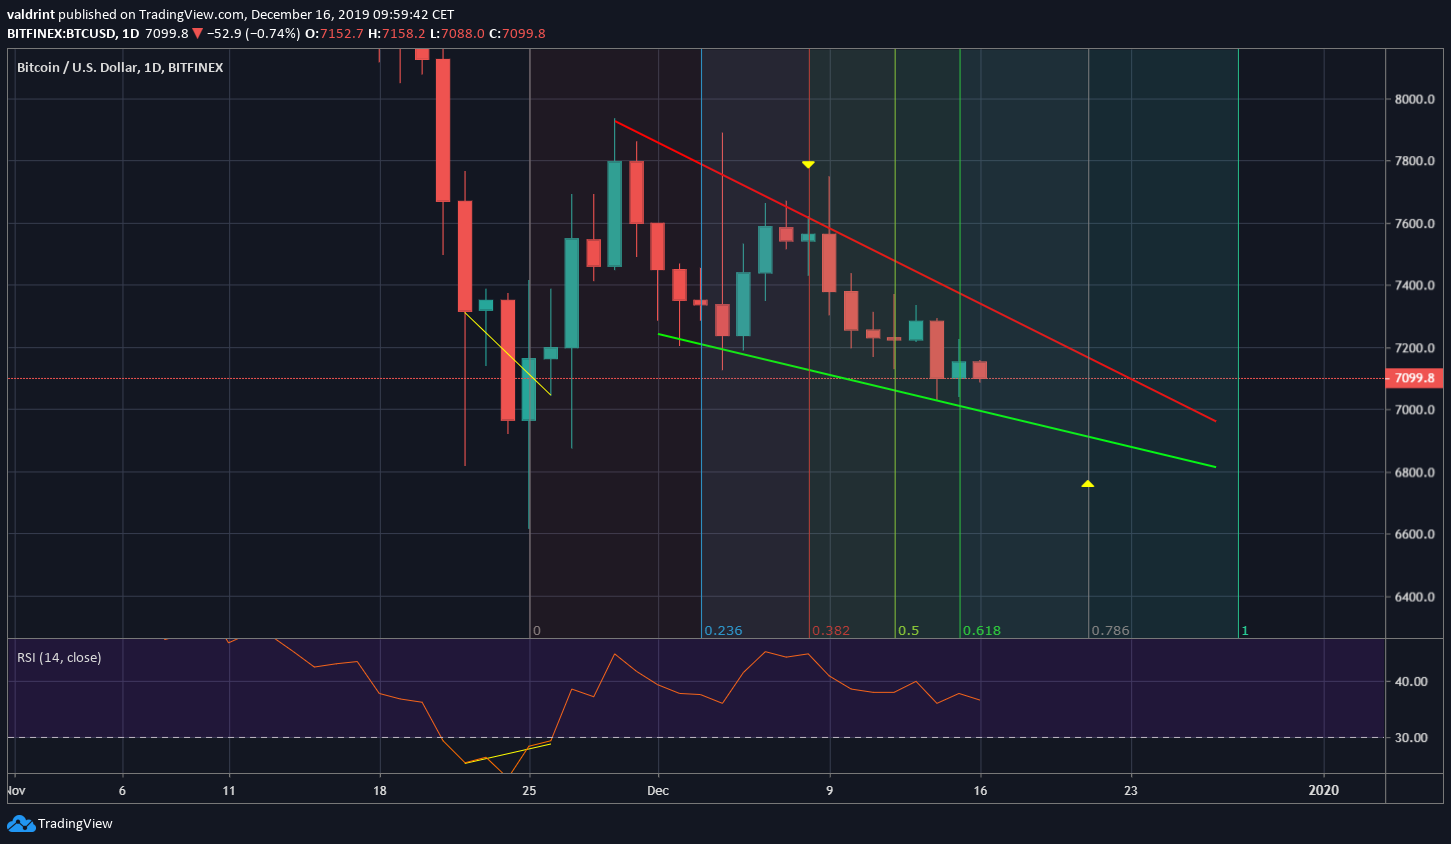
The 2019 movement has transpired over a slightly shorter period of time. It was also preceded by bullish divergence in the RSI, albeit not as clear as the one in 2018. The Bitcoin price initiated an upward move towards $7900 shortly after and created a descending wedge. The RSI has been slightly below 40 since.
Similarly, the Bitcoin price decrease began shortly after the 0.382 line. If the fractal continues to hold, BTC will make a low near $6950 on December 21 — right at the 0.786 line. Afterward, it should break out on December 28 and again reach $7900.
To conclude, if BTC continues following the fractal laid out in 2018, it will continue trading inside the wedge for the majority of December before breaking out near December 28. Additionally, the fractal suggests that the Bitcoin price has already made a low on November 25 and will not decrease below $6900 again.
