


On March 12, the Bitcoin price began a rapid decrease and reached a low of $3,850 the next day. However, it proceeded to move upward and reached a weekly close above the 200-week moving average (MA). Since its inception, the BTC price has never closed below this MA.
Cryptocurrency trader @davthewave tweeted a long-term BTC chart that shows two long-term moving averages (MA), the 200- and 30-week ones. He states that once they come into contact with each other, a rapid upward move is likely to follow. He also outlined a period in the 2015 BTC price movement that shows the beginning of the previous upward move that transpired as soon as these MAs touched each other.
200 MDA [30 MWA] yet to meet the 200 MWA average.
4th quarter rendezvous then off to the races…. pic.twitter.com/X07uI2LmNq
— dave the wave🌊🌓 (@davthewave) April 8, 2020
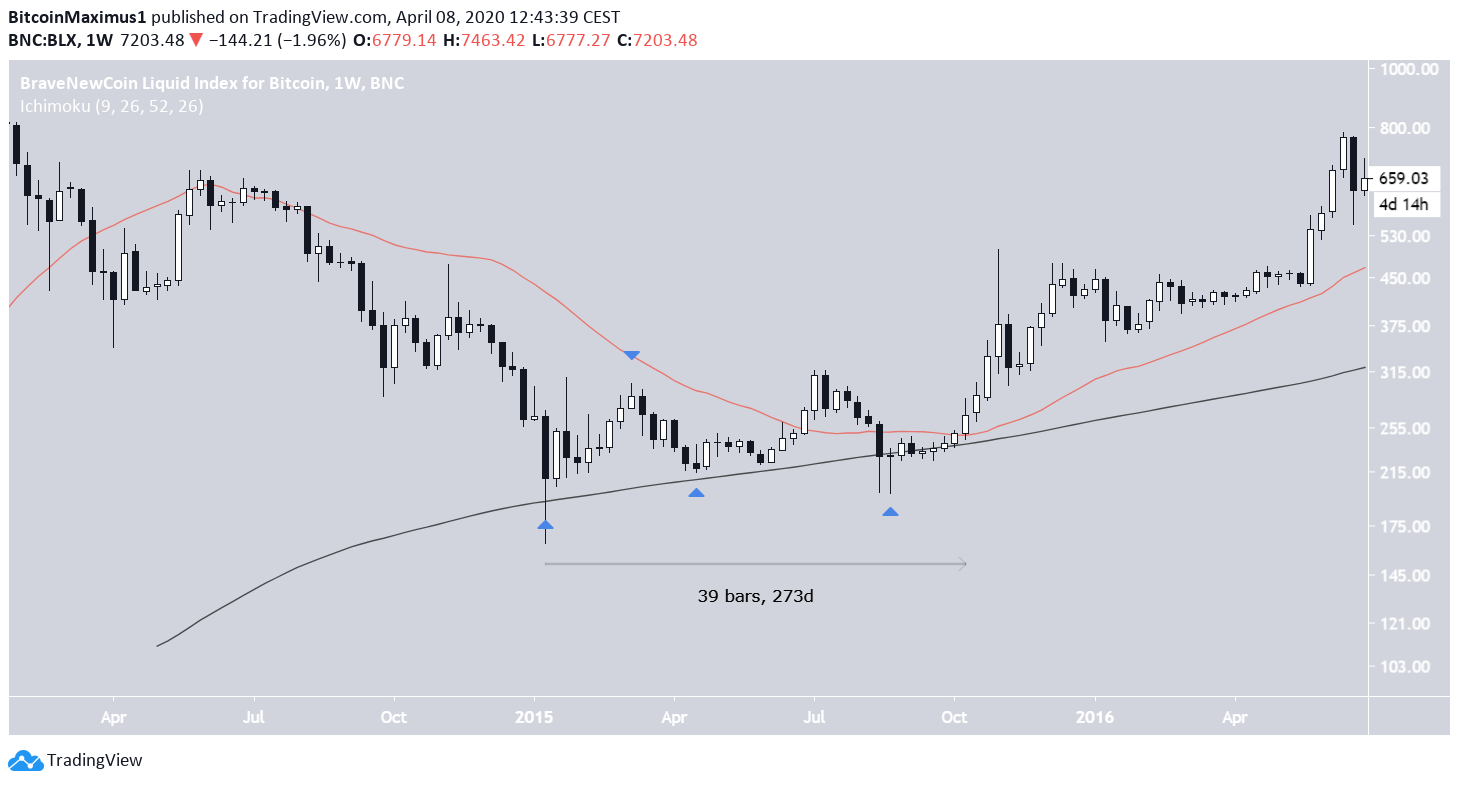
2015 Bitcoin Movement
In January 2015, the BTC price decreased below its 200-week MA. However, it created a long lower wick and proceeded to close above it. The ensuing upward move took the price slightly below the 30-week MA, before validating the 200-week MA once more.
Afterward, the price increased above the 30-week MA, before returning to validate the 200-week MA for the third and final time.
What followed next was a touch of the two MAs before the price began an upward move that eventually led to the all-time high price reached in December 2017.
The time period since the price first reached the 200-week MA to the beginning of the upward move was 273 days.
2020 Movement
In the 2020 movement, the BTC price reached the 200-week MA on March 11. Similar to 2015, the price initially decreased well below this MA but proceeded to close above it. The ensuing upward move has taken the price almost all the way to the 30-week MA.
If the pattern laid out in 2015 transpired, the BTC price is likely to decrease to the 200-week MA before beginning an upward move and then falling to the same MA for the third and final time.
Afterward, the price is expected to begin an upward move. If this entire pattern takes the same amount of time as it did in 2015, the upward move is expected to begin on Dec. 7.
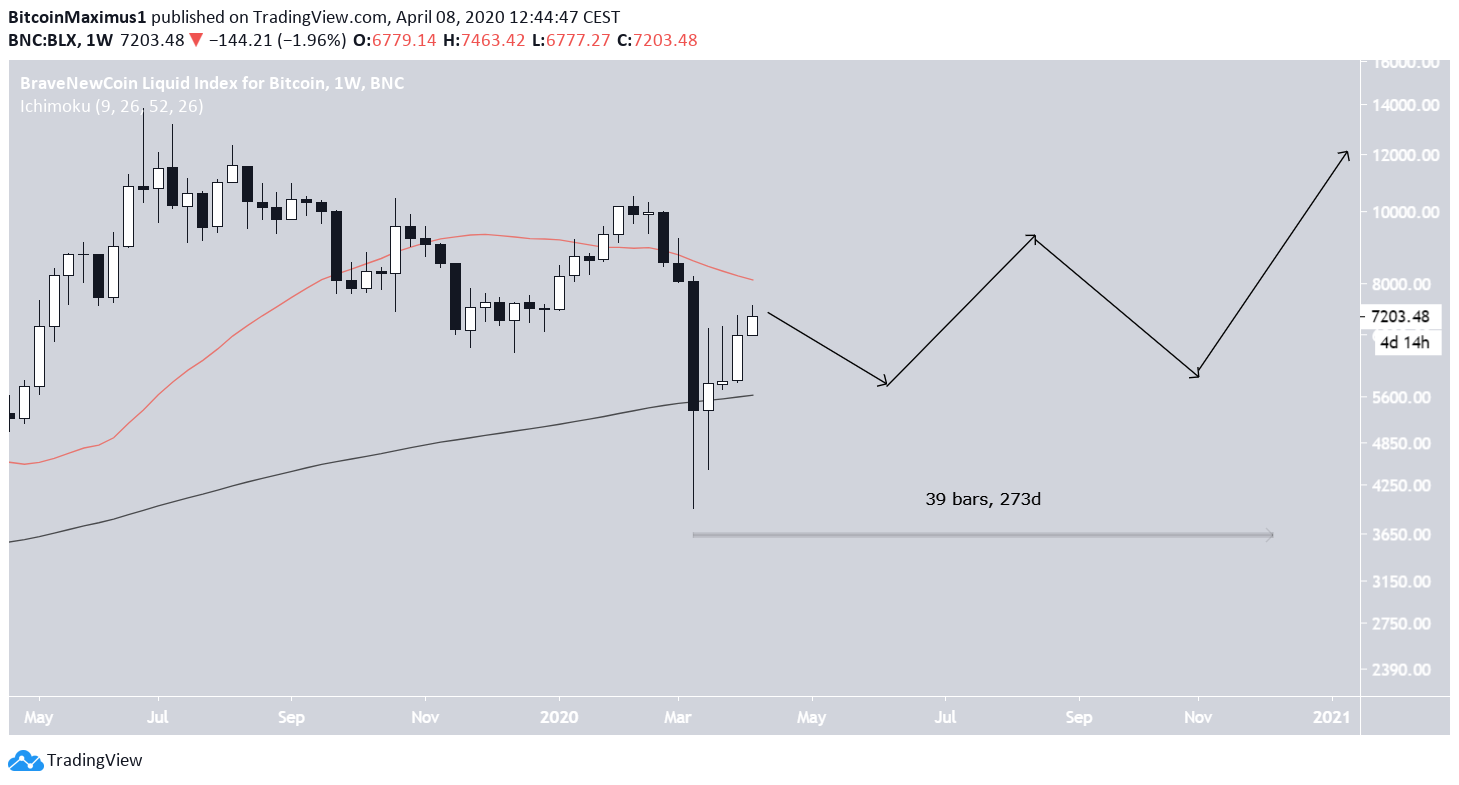
To conclude, the BTC price movement relative to its 200-week MA is very similar to that of January 2015. If the price continues following this pattern, it should begin an upward move in December of this year.


