


The Bitcoin price has been decreasing since reaching a high of $10,491 on February 13. The decrease has been rapid and has taken the form of an A-B-C correction, which is nearing its end.
Bitcoin (BTC) Price Highlights
- Bitcoin might have completed an A-B-C correction.
- The RSI has begun to generate bullish divergence.
- The price is following a descending support line.
- It could be trading inside an inverse head and shoulders (H&S) pattern.
- There is resistance at $8500.
Trader @SmartContracter tweeted a Bitcoin chart, in which the price has already completed an A-B-C correction. He suggests that the best-case scenario for the future BTC price movement would be some range trading for the next few weeks, followed by a breakout.
best case scenario for $btc is we accumulate here for a few weeks and build up some steam for a breakout pic.twitter.com/s3MEFltkGI
— Bluntz (@Bluntz_Capital) March 11, 2020
End of the Correction
Prior to the A-B-C correction, the BTC price likely completed a five wave Elliott formation.The formation began on December 17, 2019 with a low of $6477 and ended on February 13, 2020 with a high of $10,491. Since then, the price has been decreasing, following an A-B-C correction.
Using a Fib retracement tool, we can see that the Bitcoin price has fallen below the 0.618 Fib level without experiencing any retracement. The next support area is found at the 0.786 Fib level at $7450.
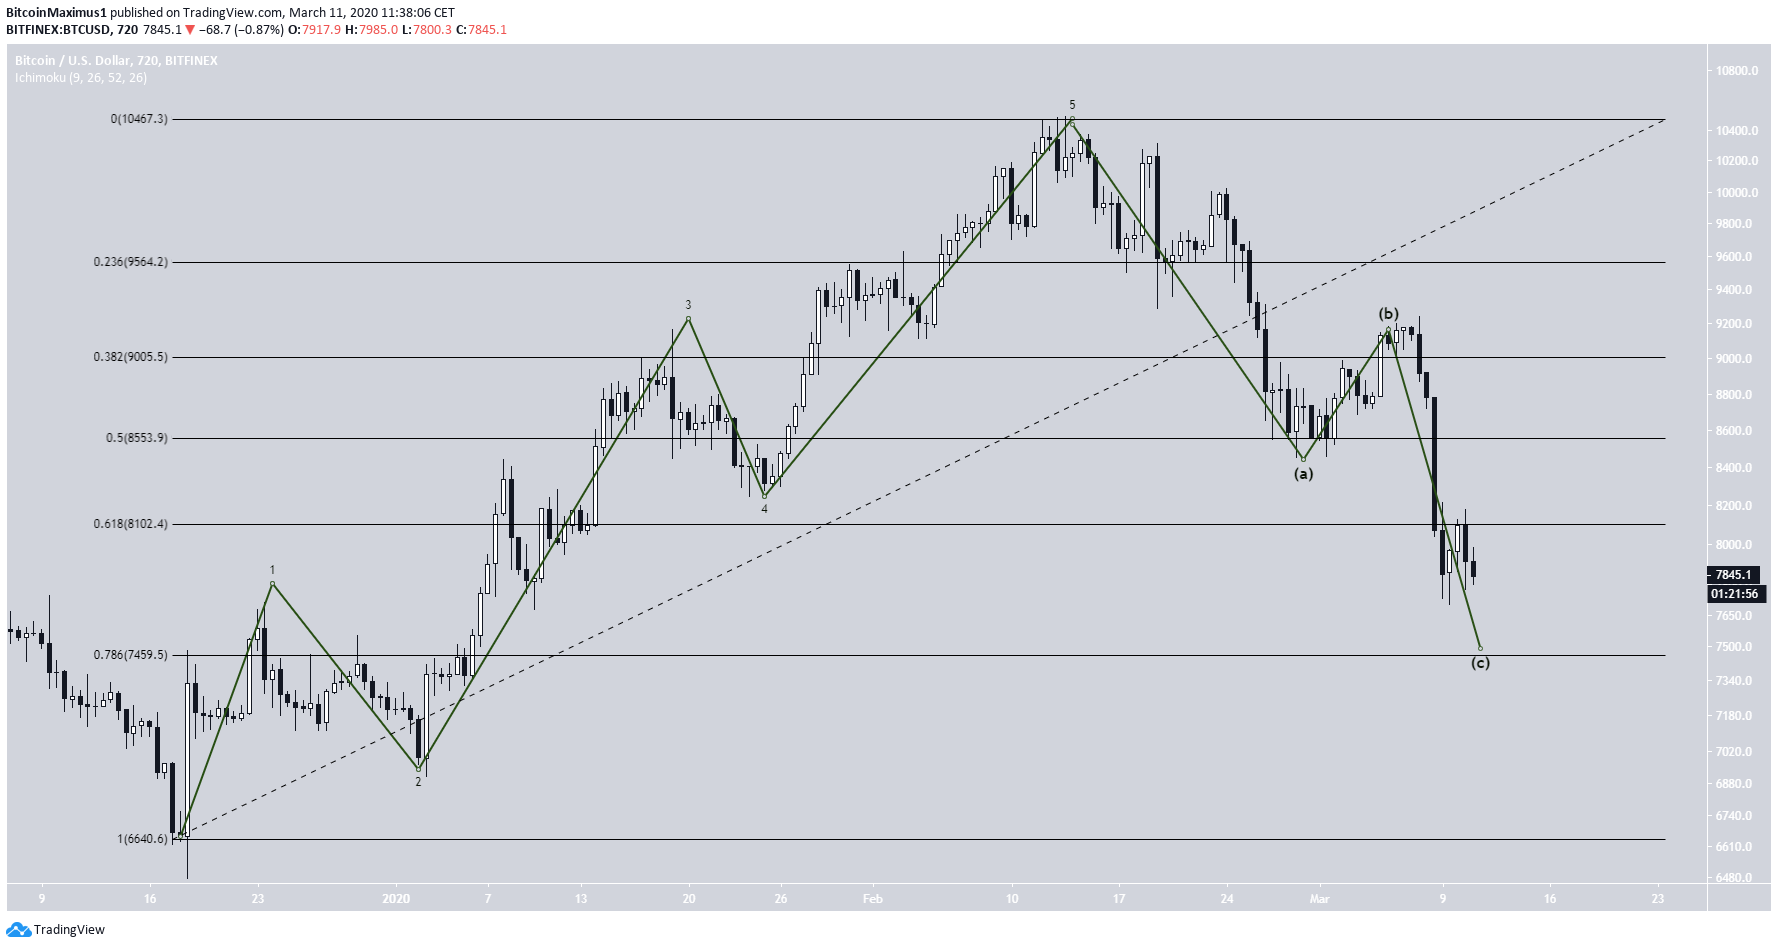
Looking closer, we can see a descending support line that the Bitcoin price is following, along with some bullish divergence in the RSI.
The support line will coincide with the 0.786 Fib level on March 13, so the price could reach a low of $7450 by then. If the movement outlined in the tweet happens, the price would consolidate between $7450-$8100 (0.618 level) afterward.

Head and Shoulders
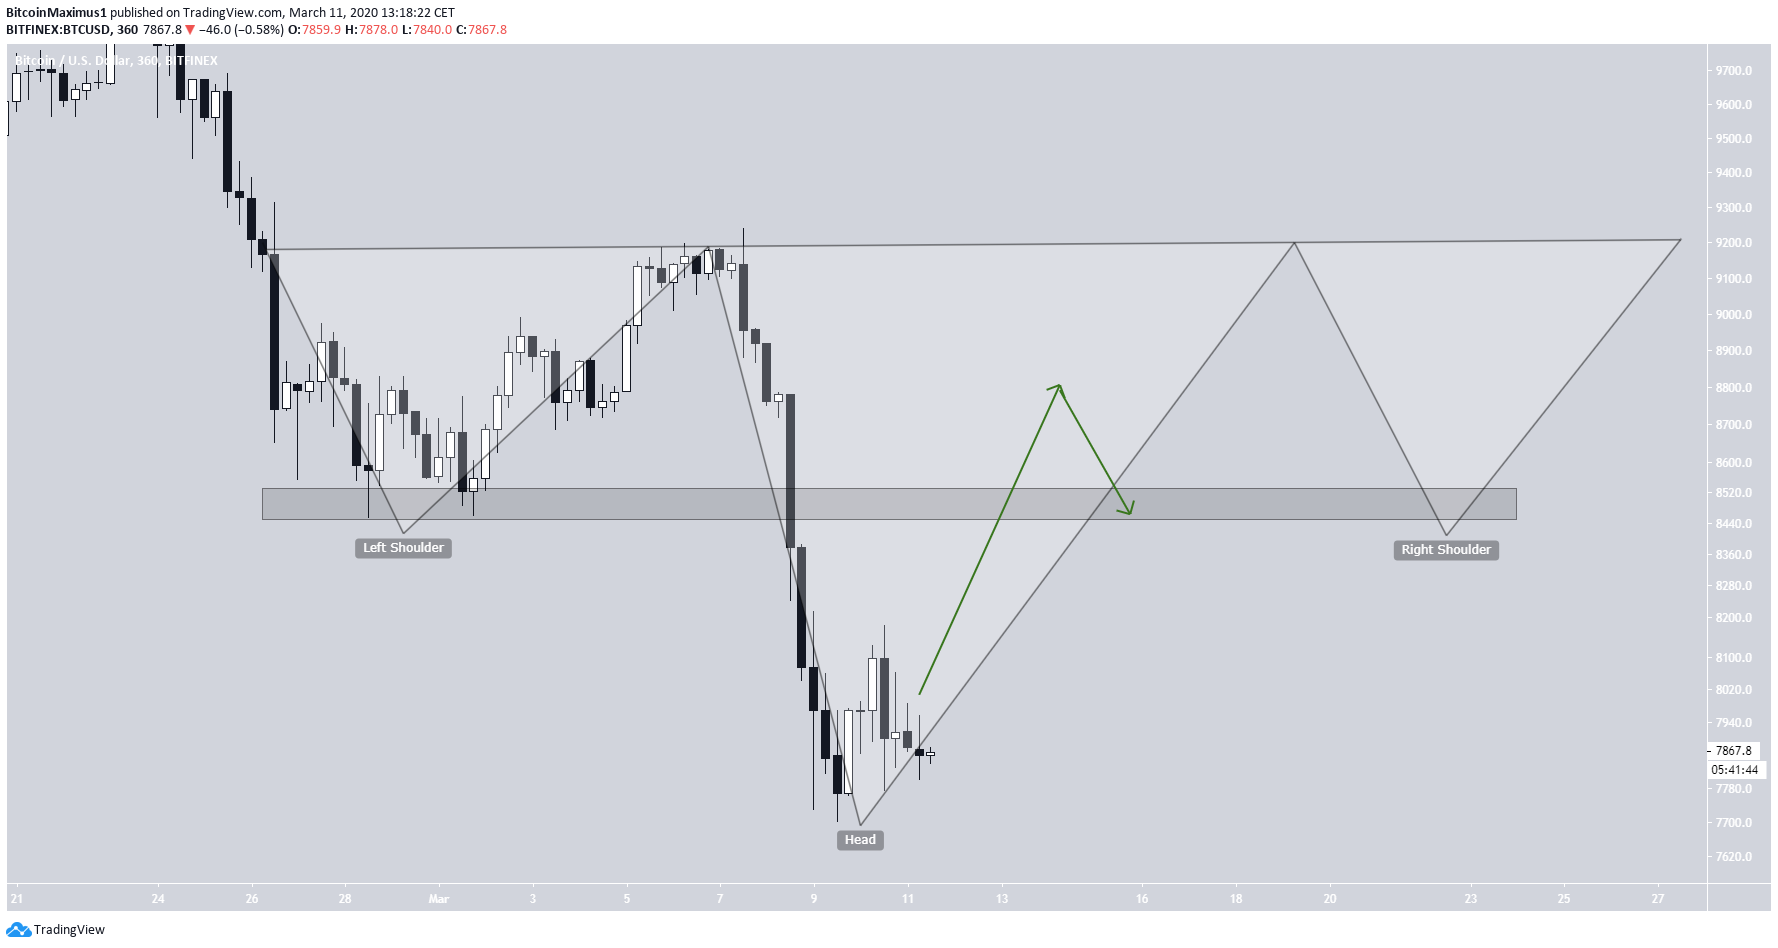
There is another possibility, which suggests that the Bitcoin price has already reached a bottom and will begin to increase instead. The idea was proposed by @davthewave, who stated that he believes the price is trading inside both long- and short-term inverse head and shoulders (H&S) patterns. We discussed the possibility of the creation of the longer-term inverse H&S in our previous article — in this section, we will only analyze the short-term one.
Freebie from alts page [fee based]
BTC/ USD
Short term/ more speculative
Something like this wouldn't surprise me – a mini reverse head and shoulders within the right shoulder of the larger one… pic.twitter.com/4BHXQtmSnh
— dave the wave🌊🌓 (@davthewave) March 11, 2020
The long-term inverse head and shoulders has been in place for 177 days. The mini version of it is transpiring entirely inside the right shoulder.

The area that will determine if the price will indeed create this pattern is found at $8500. If the price were to increase above it and validate it as support afterward, it would indicate that it is creating the head from the H&S pattern.
Afterward, this area is expected to act as the bottom of the right shoulder.
If instead, the price gets rejected by the area, it is likely to continue and complete the correction outlined in the first section.
To conclude, the BTC price is either nearing the end of its correction or has already done so. Whether it manages to flip the $8500 area as will determine if BTC will make a lower low or begin to increase immediately.


