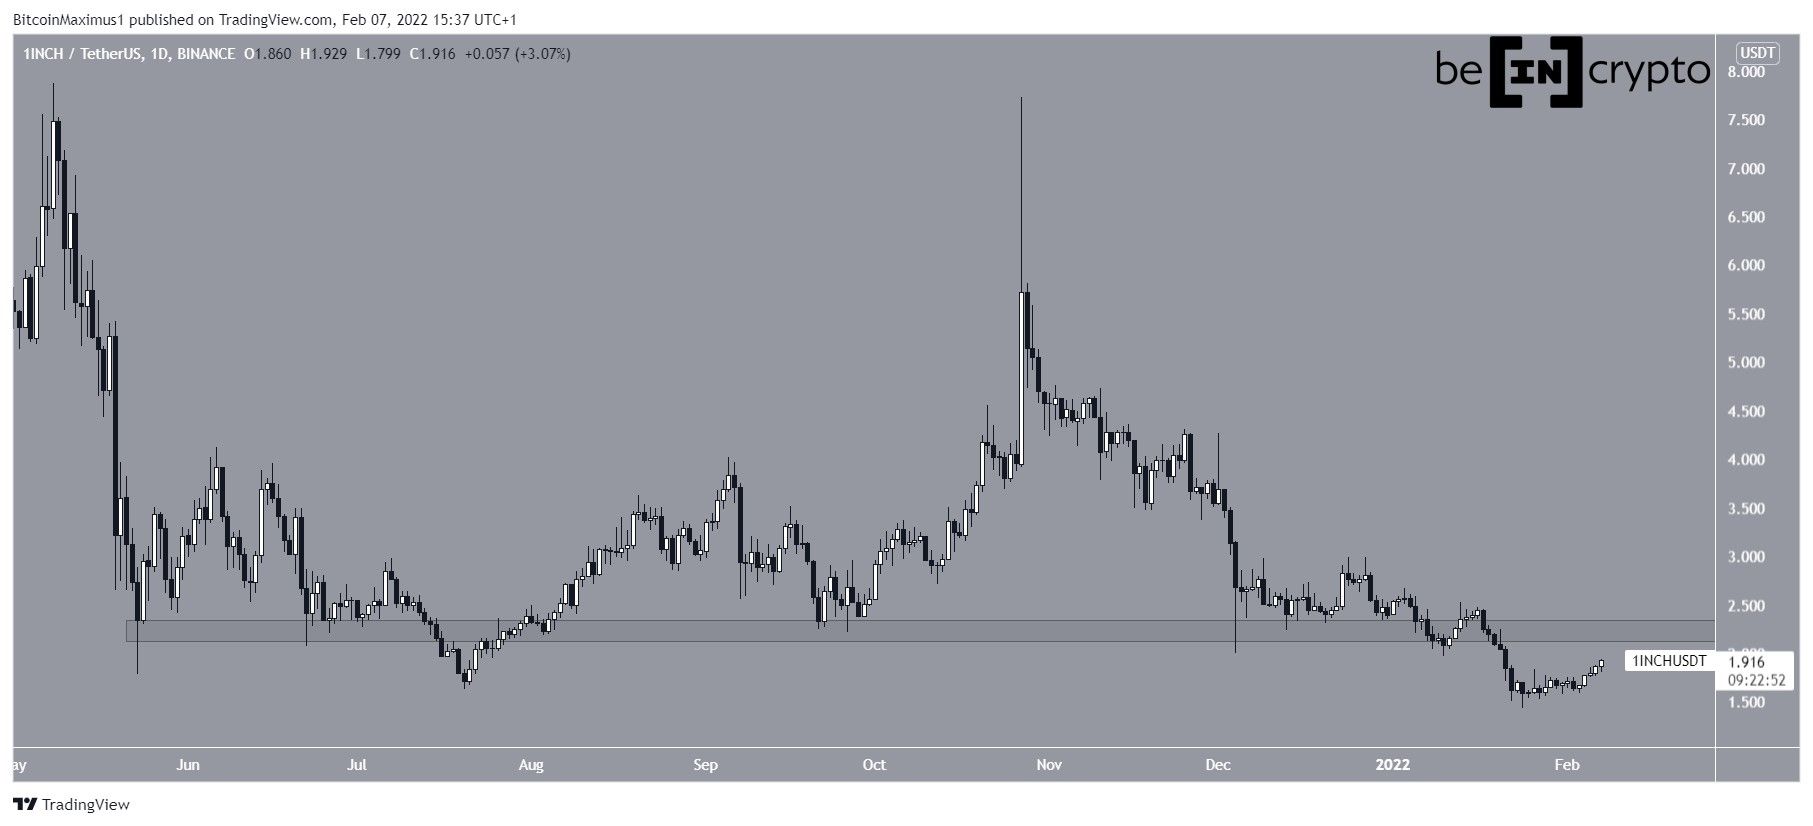
1Inch (1INCH) has potentially completed its long-term correction after its bounce on Jan 24. This would be confirmed by a reclaim of the $2.20 horizontal area.
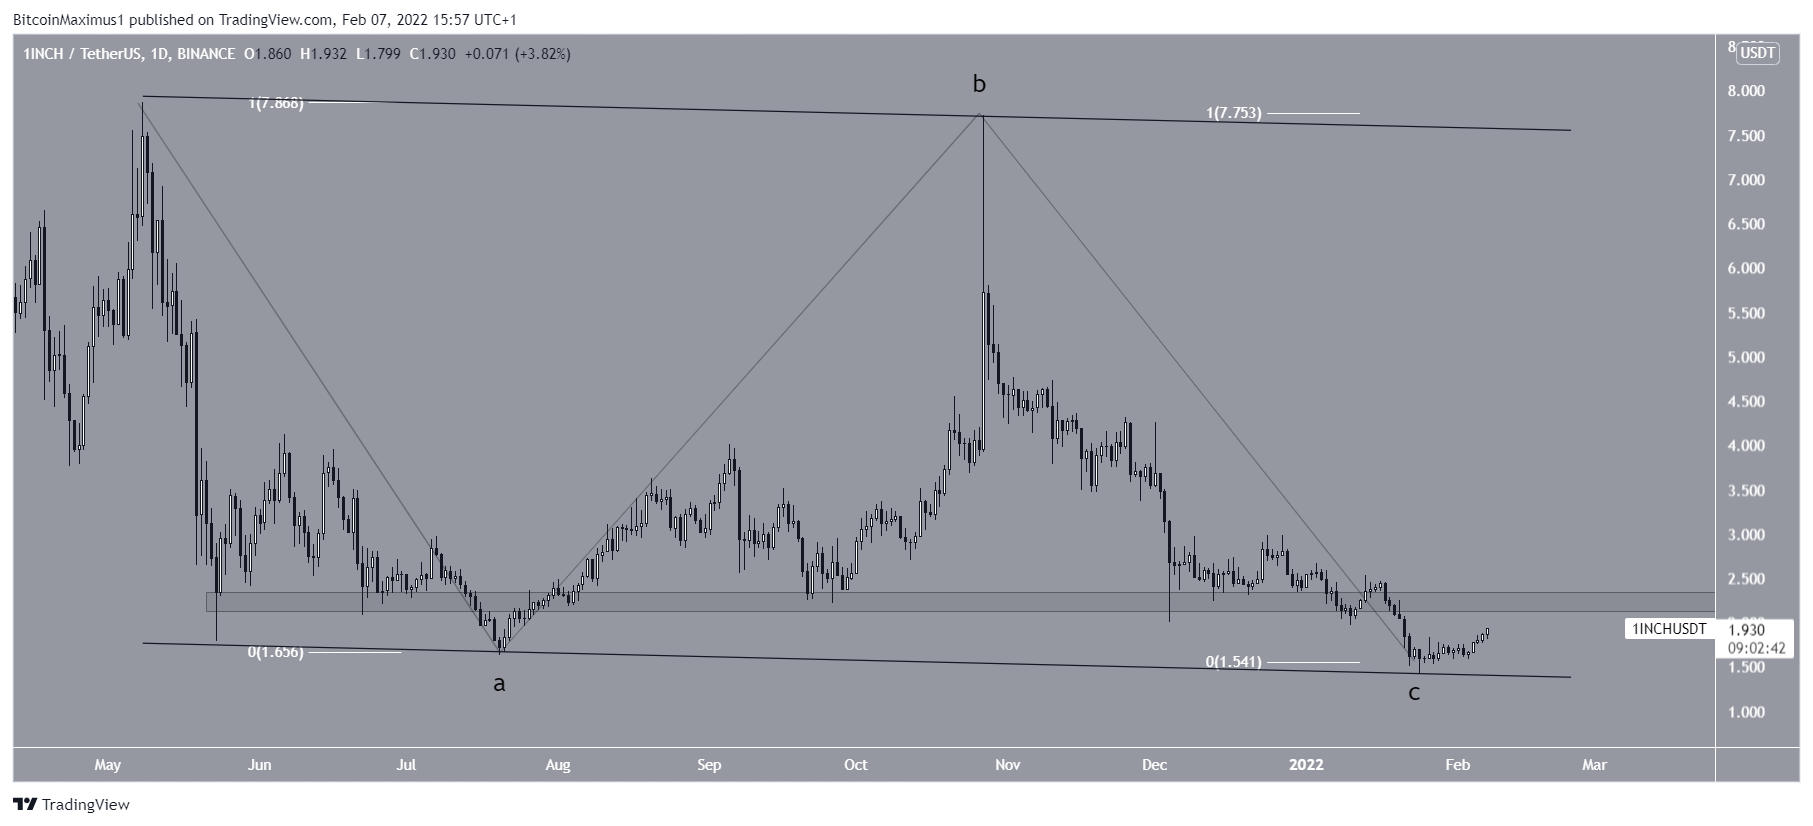
1INCH has been falling since Oct 27, when it reached a high of $7.77. This was a slightly lower high relative to the all-time high price of May 8. This created a long upper wick, after which the token decreased considerably.
So far, it has reached a low of $1.42, doing so on Jan 24. A slight bounce began afterwards and 1INCH has been moving upwards since.
It is approaching the $2.20 area, which had previously acted as support since May 2021. Its reclaim would go a long way in confirming that the trend is now bullish.
Current movement
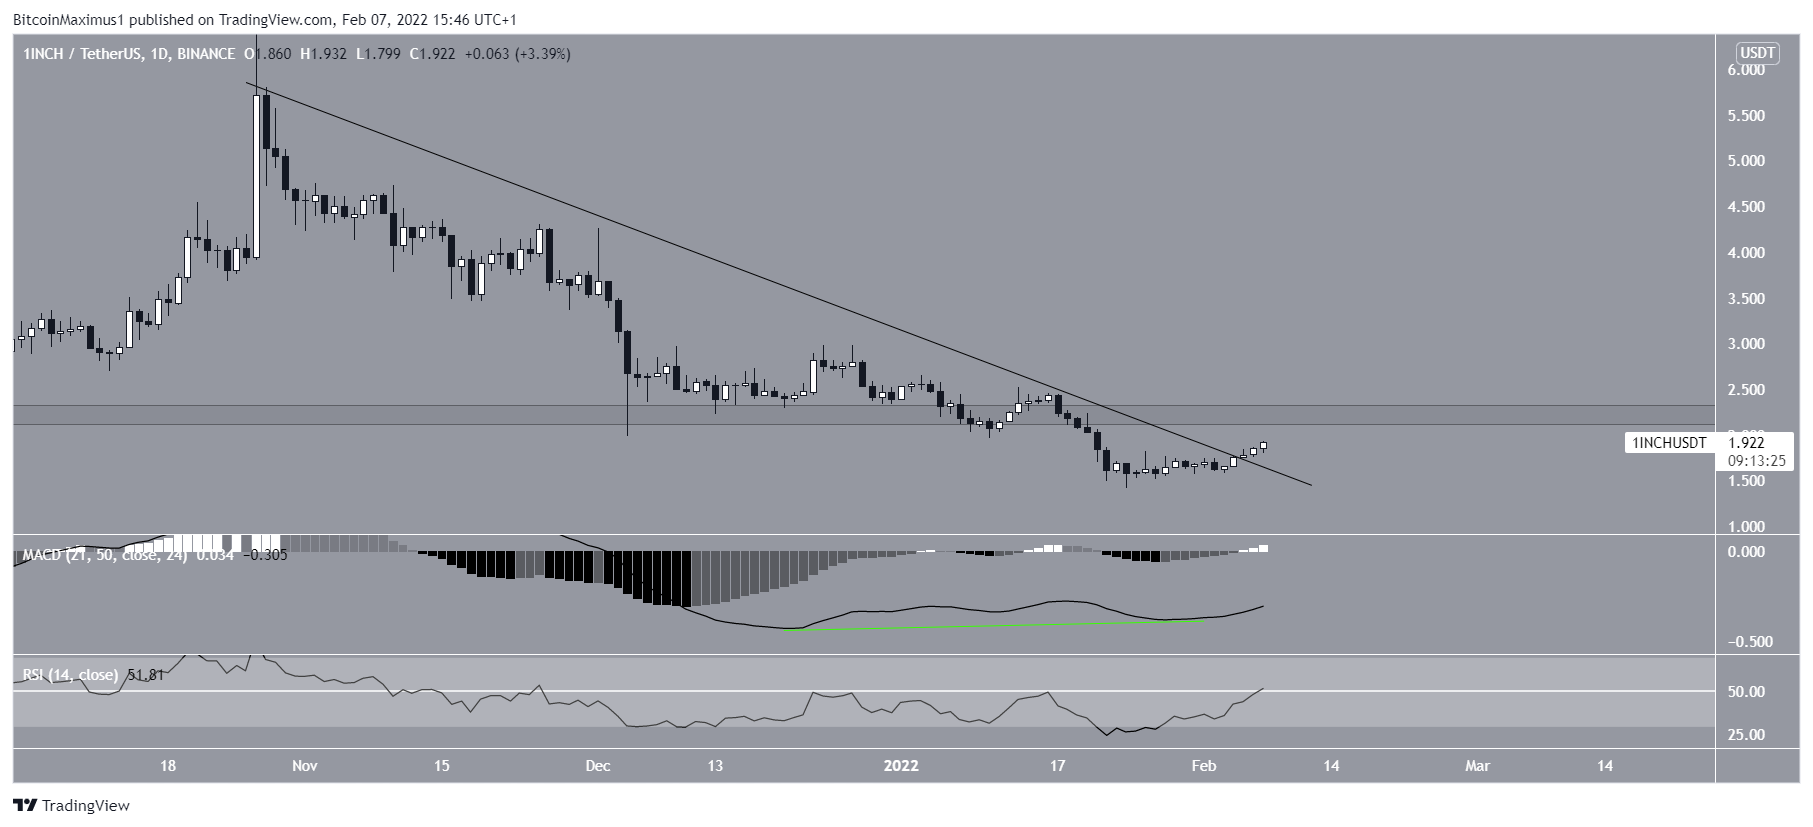
A closer look reveals that 1INCH has broken out from a descending resistance line that had been in place since the aforementioned high.
Furthermore, technical indicators are showing bullish signs. This is especially visible in the significant bullish divergence that has developed in the MACD. Such a pronounced bullish divergence very often precedes bullish trend reversals.
In addition to this, the RSI has also moved above 50. The RSI is a momentum indicator, and readings above 50 are considered bullish.
Therefore, technical indicators in the daily time-frame suggest that the 1INCH trend is bullish, and the token will eventually reclaim the $1.22 horizontal resistance area.
1INCH wave count analysis
Cryptocurrency trader @Ewfib tweeted a chart of 1INCH, stating that the token has completed a flat corrective structure.
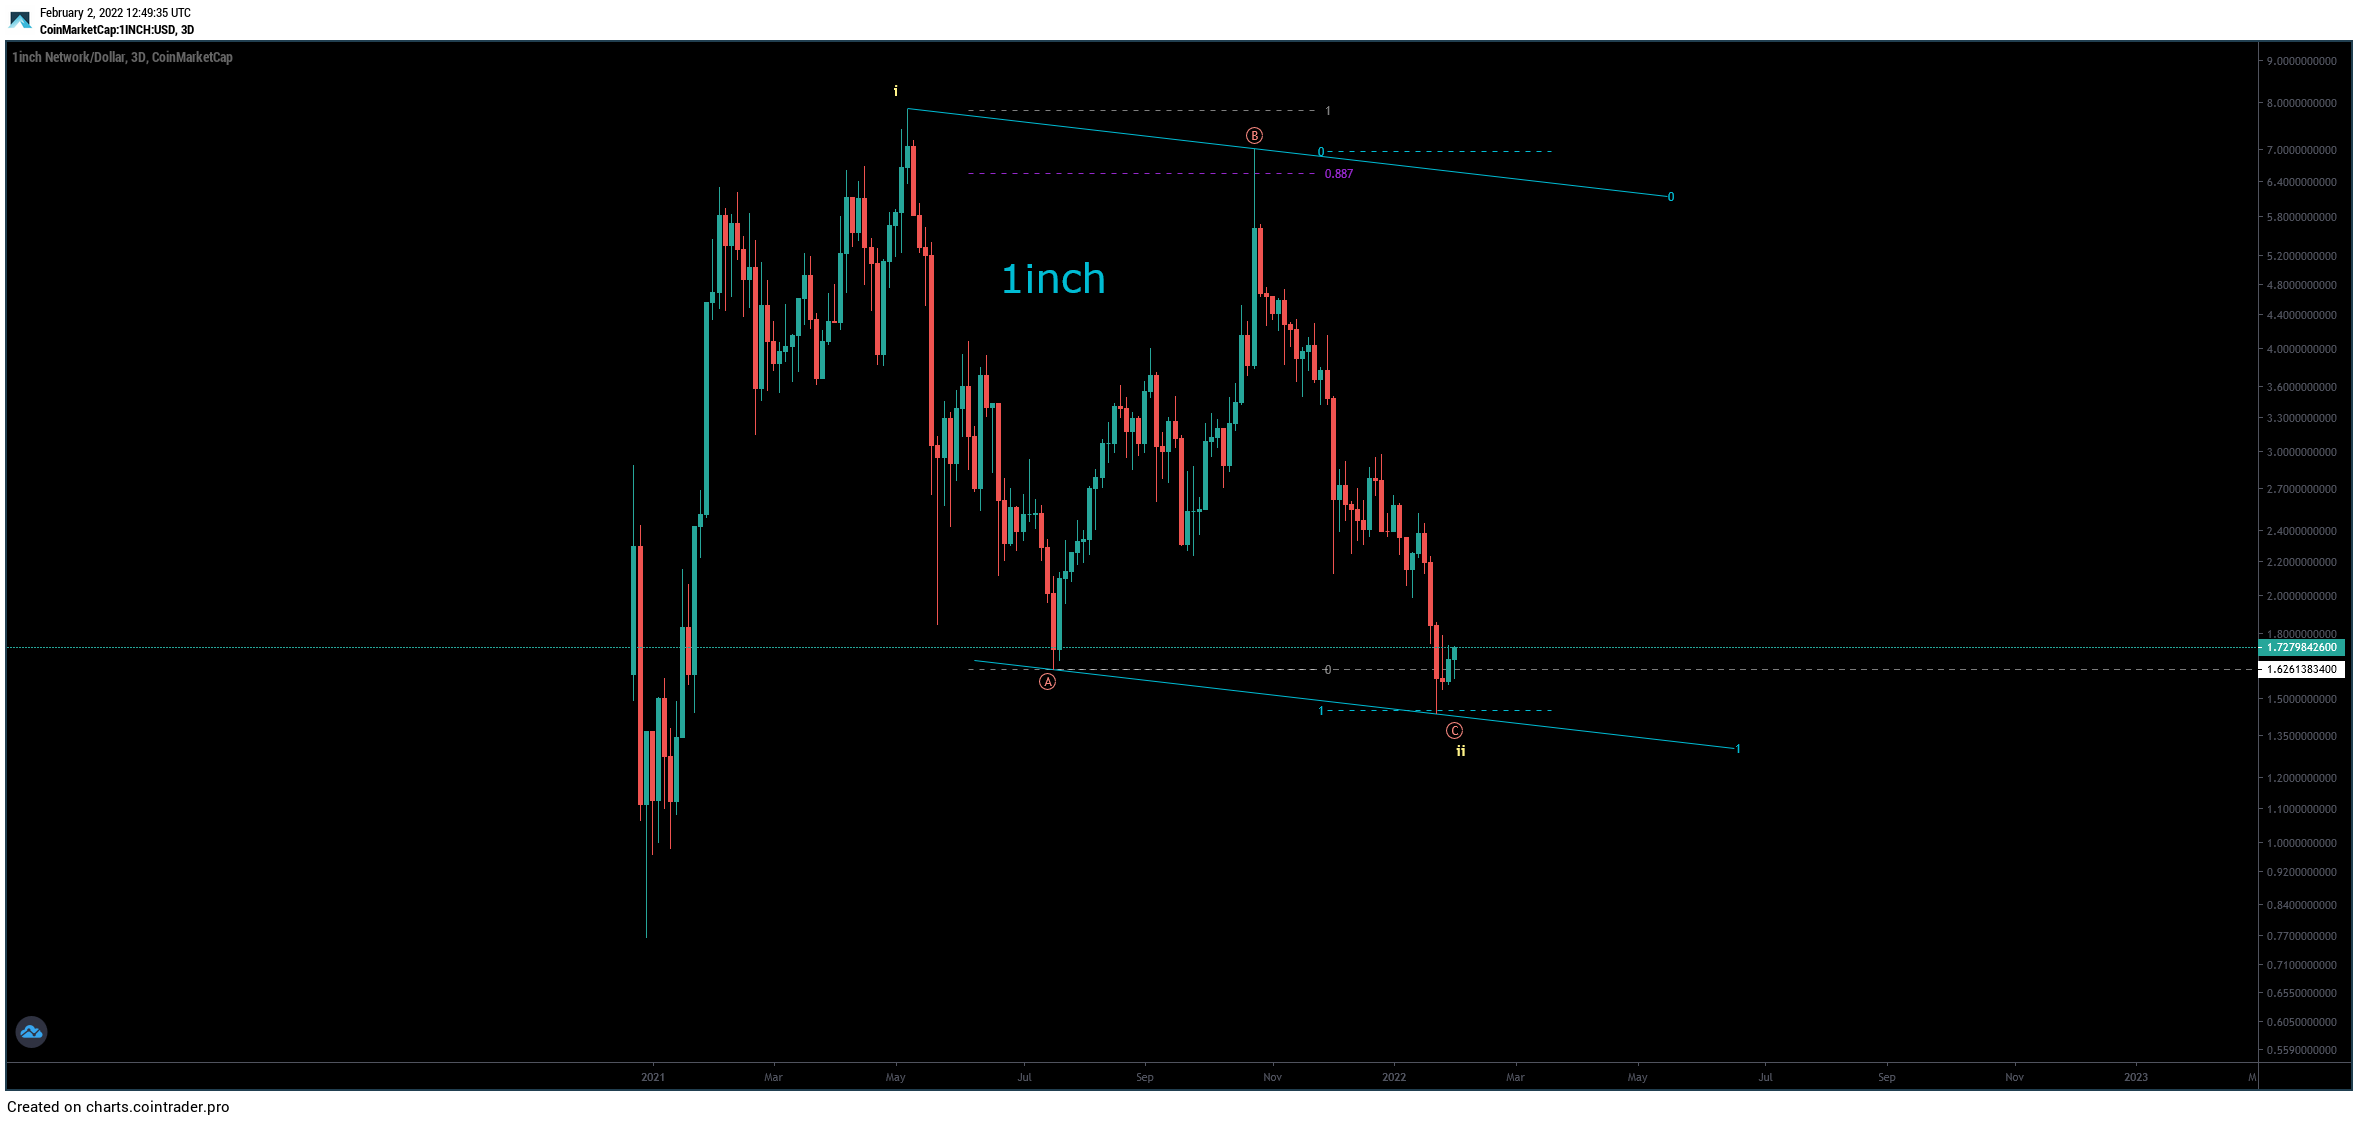
The most likely wave count does indicate that 1INCH has completed a flat corrective structure, in which waves A:C have had an exactly 1:1 ratio. This is the most common ration in such structures.
In addition to this, the entire movement since the May all-time high can be contained inside a descending parallel channel. The Jan 24 low served to validate the support line of this channel.
If correct, 1INCH has begun a new bullish impulse that will take it to a new all-time high price and beyond.