

On Feb 2, 10,000 Bitcoin (BTC) that were previously stolen from Bitfinex finally moved. In this article, BeInCrypto will take a look at the effect of this move on several on-chain indicators.
Coin days destroyed
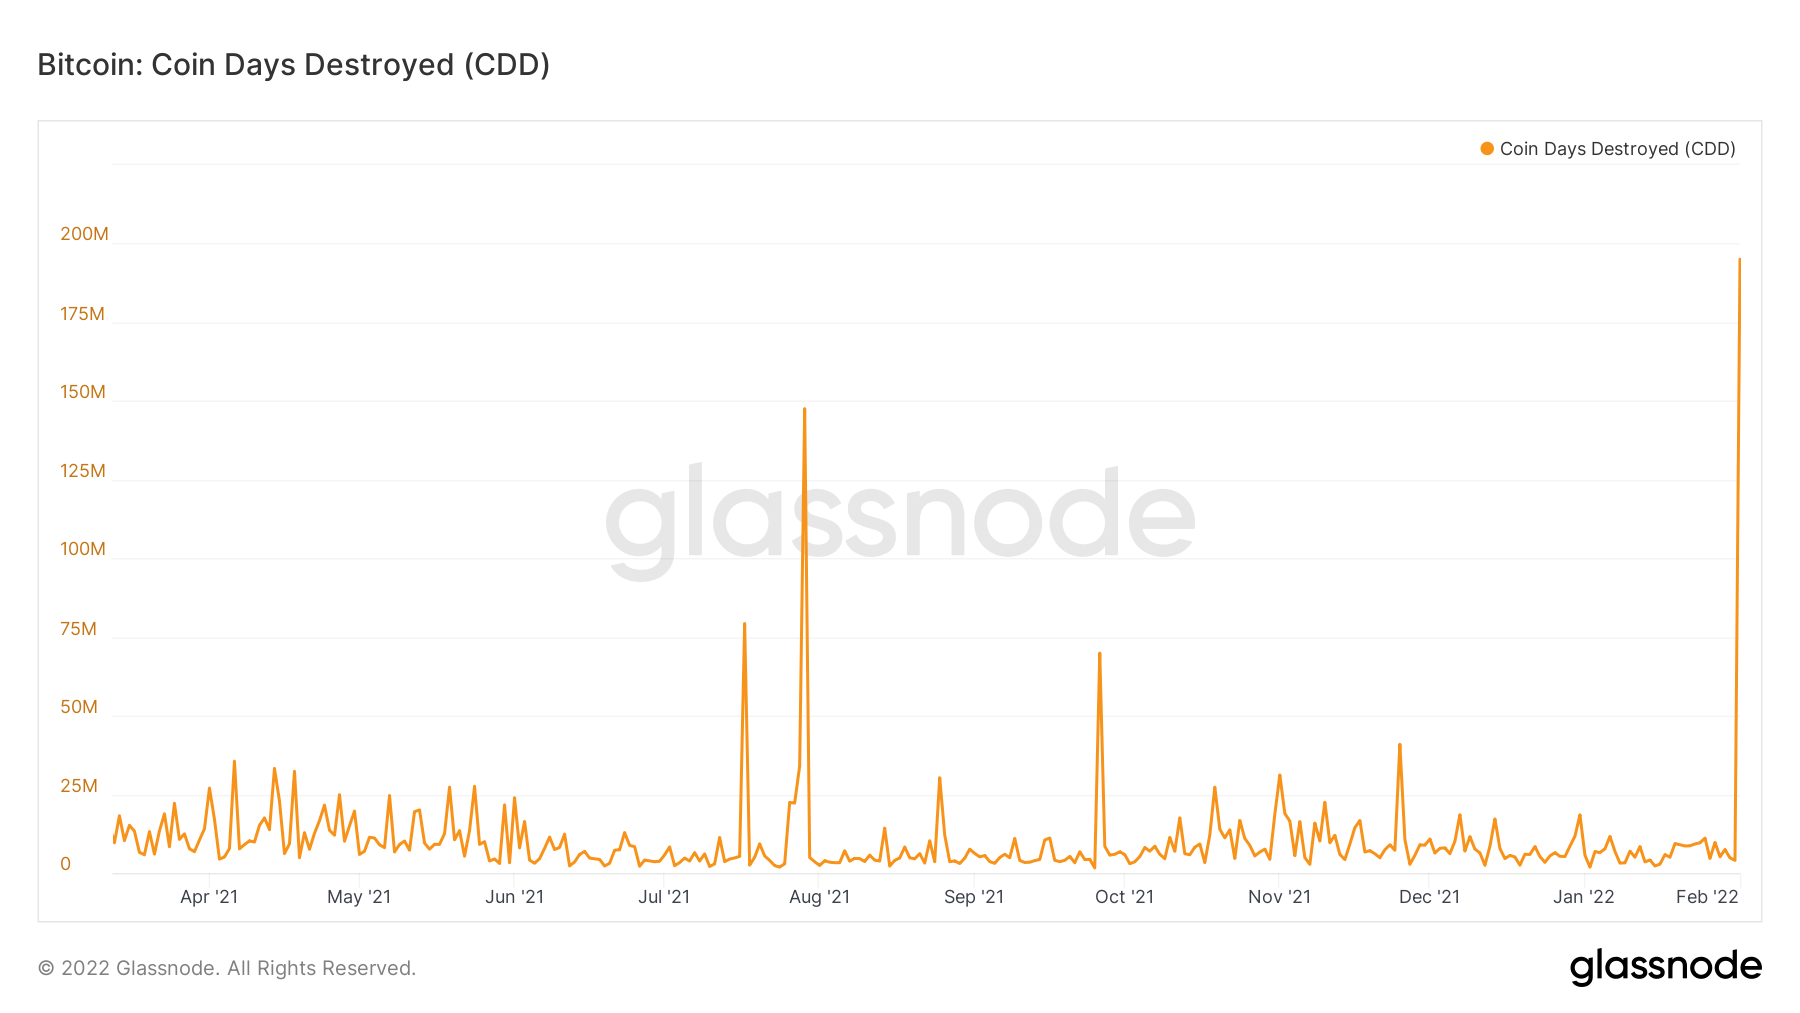
The first indicator that is noticeably affected by this move is Coin Days Destroyed (CDD). This is a lifespan indicator that accumulates one coin day for each day that a BTC remains unspent. Once it is spent, all these accumulated days are then destroyed.
On Feb 2, 195,057,413 coin days were destroyed. Since the sale amounted to a total of 10,000 BTC, each one of them would have to accumulate 1950 coin days in order to arrive at this reading.
This is in line with the fact that the BTC previously had not moved since 2016.
Long-term BTC holders
Another indicator that shows that the sale was clearly visible is the “Hodler Net Position change.” The indicator isolates accounts of long-term holders and then measures whether they have increased or decreased their total holdings.
The indicator turned negative for the first time since Dec 2021.
However, despite this drop, this will likely not cause an end to the accumulation that has been going on since Dec. Rather, it is likely that this is a one off event and not a change in the behavior of holders.

Spent BTC outputs
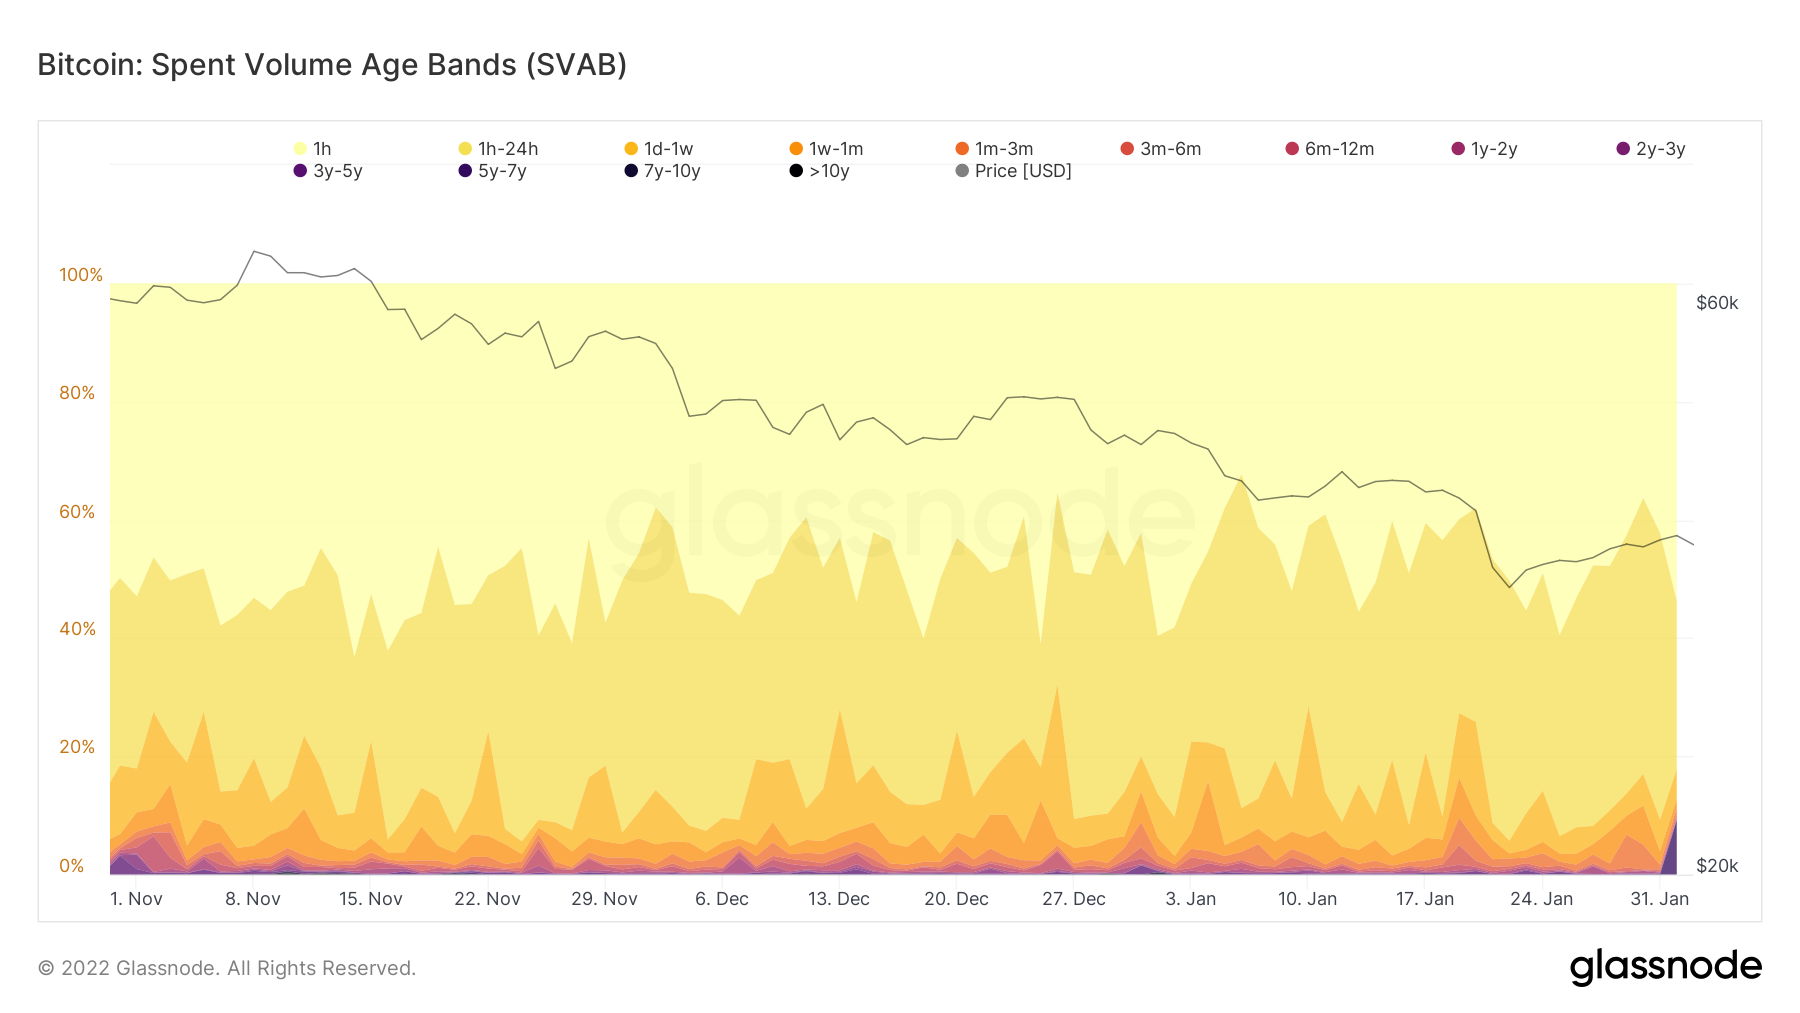
The spent volume age bands show the total amount of BTC transfer volume based on the coin’s age. Currently, roughly 90% of the volume comes from coins that have last moved 24 hours ago.
However, there is an interesting increase that comes from the 5-7 year bands.
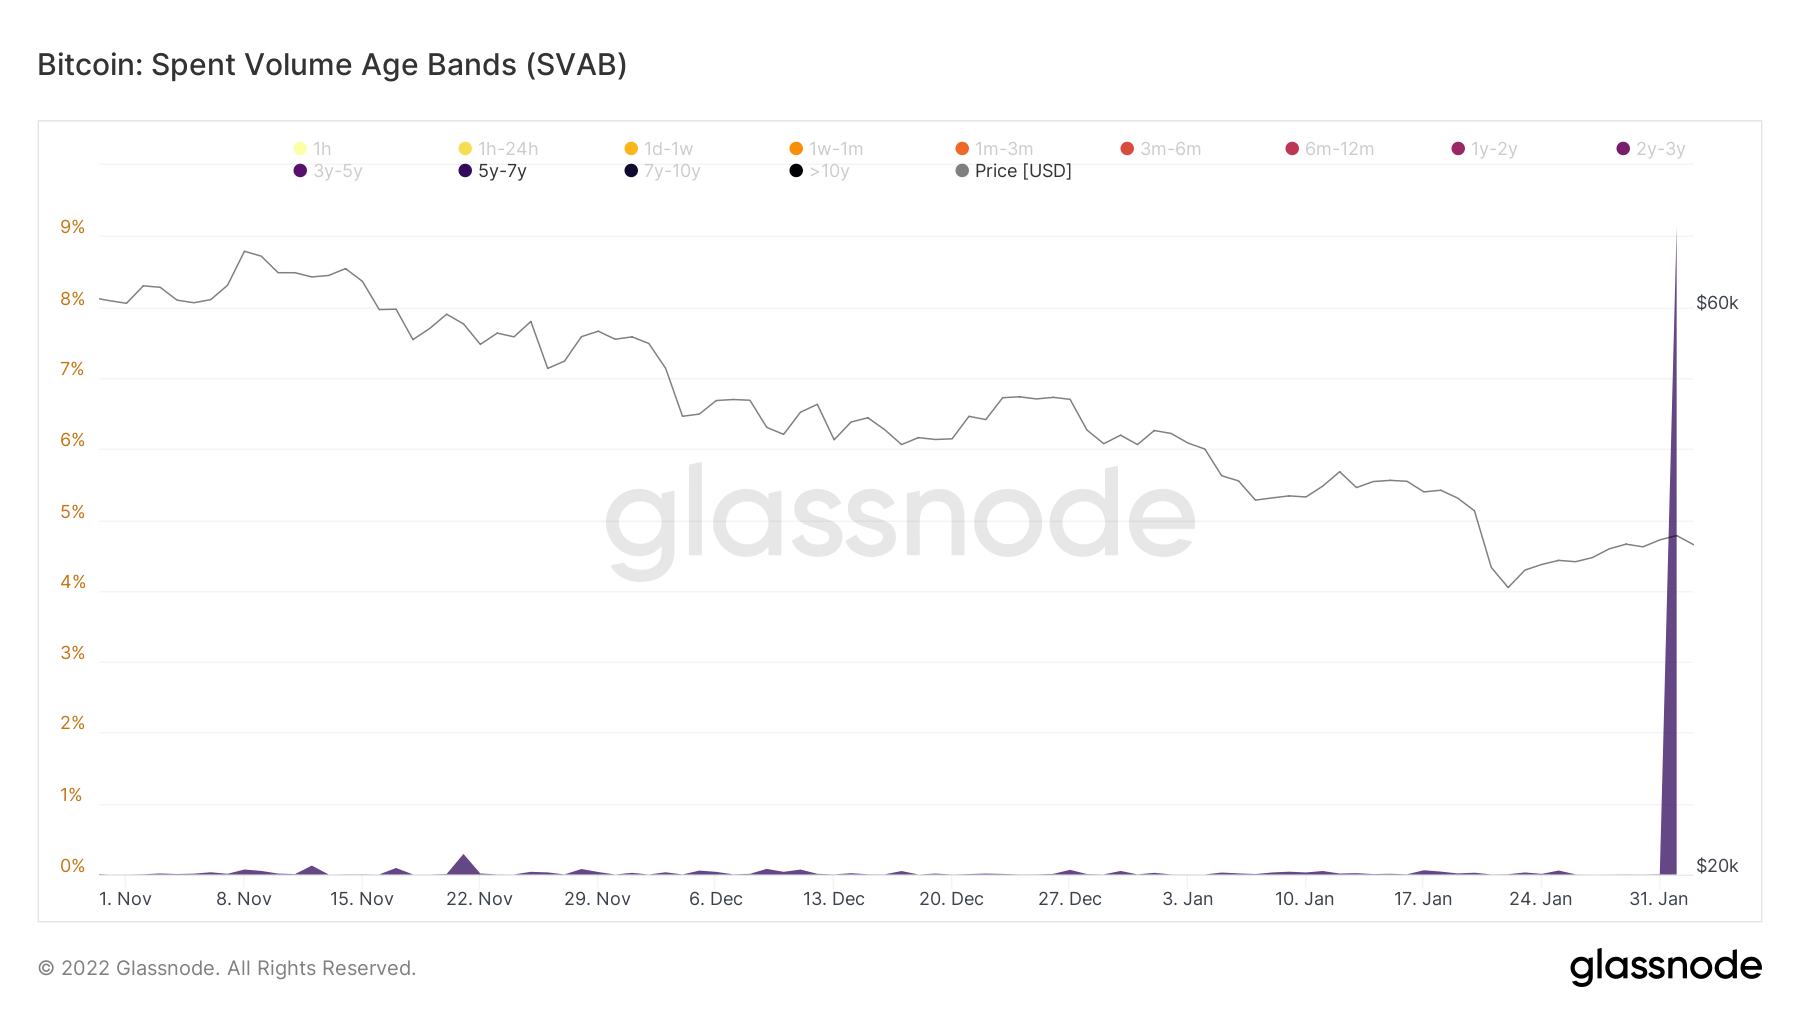
A closer look reveals that the band spiked to 9% of the total volume on Feb 2. Considering that 2016 falls within this 5-7 time range, this was caused as a result of the movement of the aforementioned 10,000 BTC.
SOPR
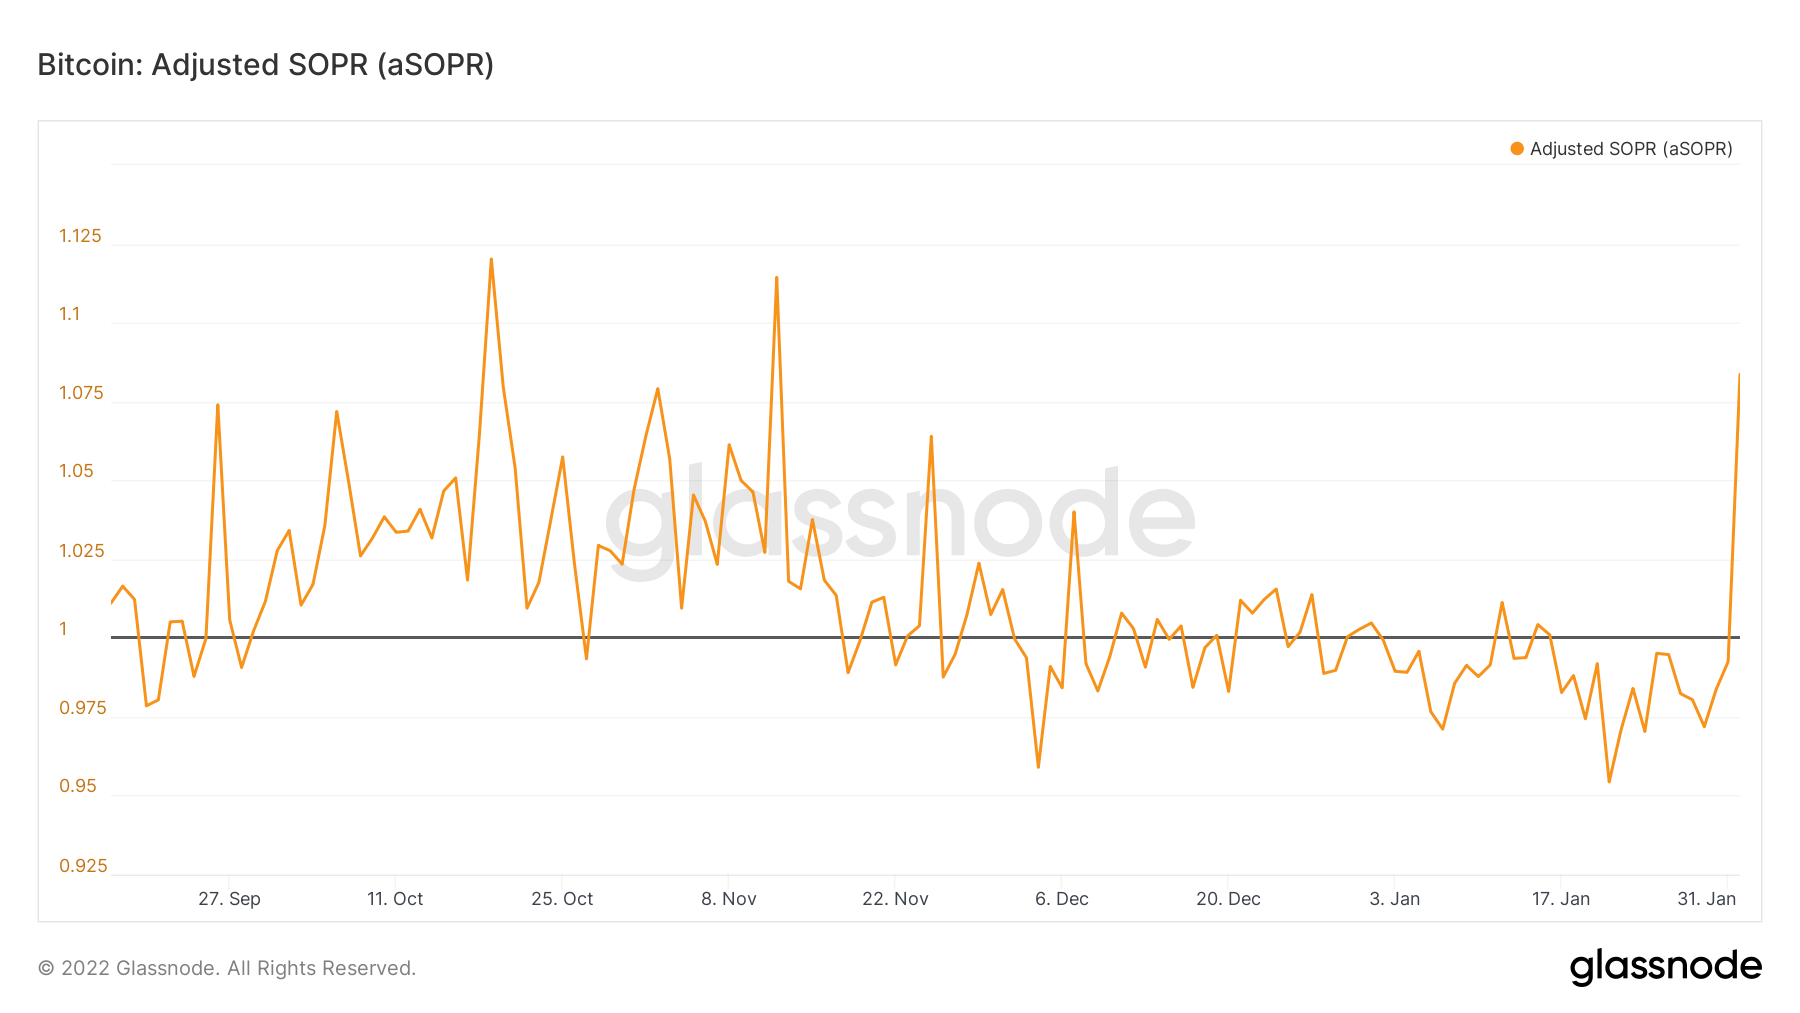
Finally, Spent Output Profit Ratio (SOPR) measures the aggregate profit or loss in the market for each day. Values above 1 indicate that the BTC market is in aggregate profit.
On Feb 2, the indicator spiked considerably, reaching a high of 1.075, which is the highest value since early Nov.
Since the BTC purchased in 2016 were worth considerably less than the current price, their sale is recorded as significant profit and is sufficient to offset the rest of the losses in the market.
For BeInCrypto’s latest Bitcoin (BTC) analysis, click here
Disclaimer
In line with the Trust Project guidelines, this price analysis article is for informational purposes only and should not be considered financial or investment advice. BeInCrypto is committed to accurate, unbiased reporting, but market conditions are subject to change without notice. Always conduct your own research and consult with a professional before making any financial decisions. Please note that our Terms and Conditions, Privacy Policy, and Disclaimers have been updated.
