

0x (ZRX) has been increasing at an accelerated rate since the beginning of March but has yet to break out from a long-term resistance line.
ZRX has been falling underneath a descending resistance line since reaching an all-time high price of $2.39 on April 21, 2021. The downward movement has so far led to a low of $0.245 on Feb. 24.
The price has been moving upwards since and has managed to reclaim the $0.72 horizontal area. This is a crucial level, since it has intermittently acted as both support and resistance since Aug. 2020.
However, ZRX failed to break out above the aforementioned resistance line and was rejected (red icon) on April 21. The price has returned to the $0.72 area once more and bounced.
A breakout from this line would be required in order to confirm that the long-term correction is complete.

Future movement
Technical indicators in the daily time frame are bullish but do not show confidence in the strength of the trend.
Both the MACD and RSI are increasing, the former is positive, and the latter is above 50. However, neither of the indicators has a steep upward slope, suggesting that bulls do not have momentum.

Cryptocurrency trader @cryptojobs3 tweeted a ZRX chart, stating that the price has broken down from a short-term pattern and is likely to continue moving downwards.
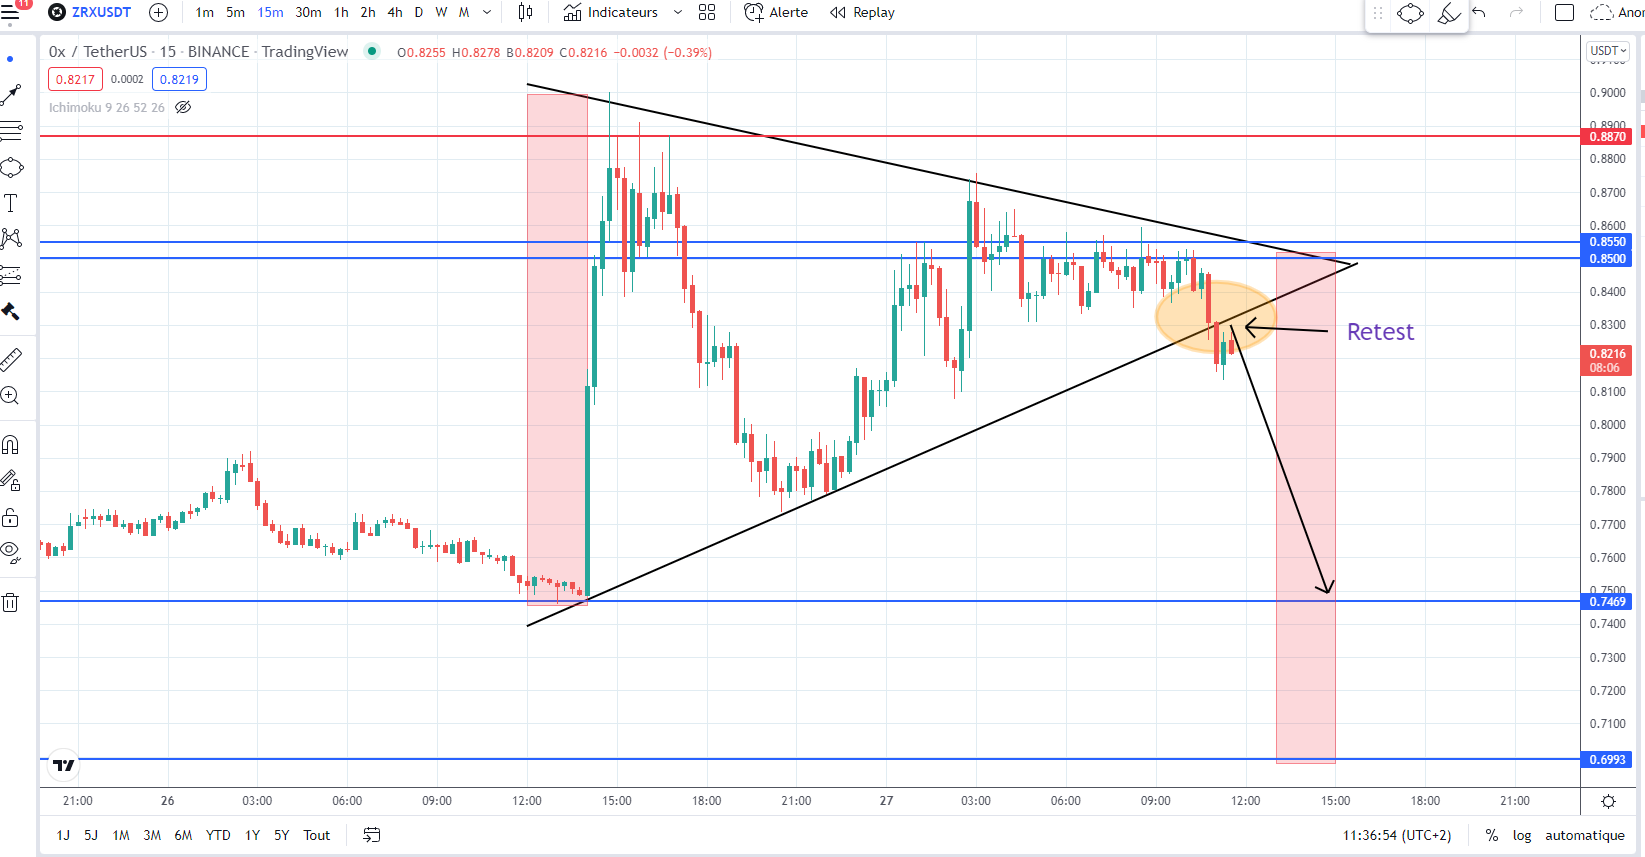
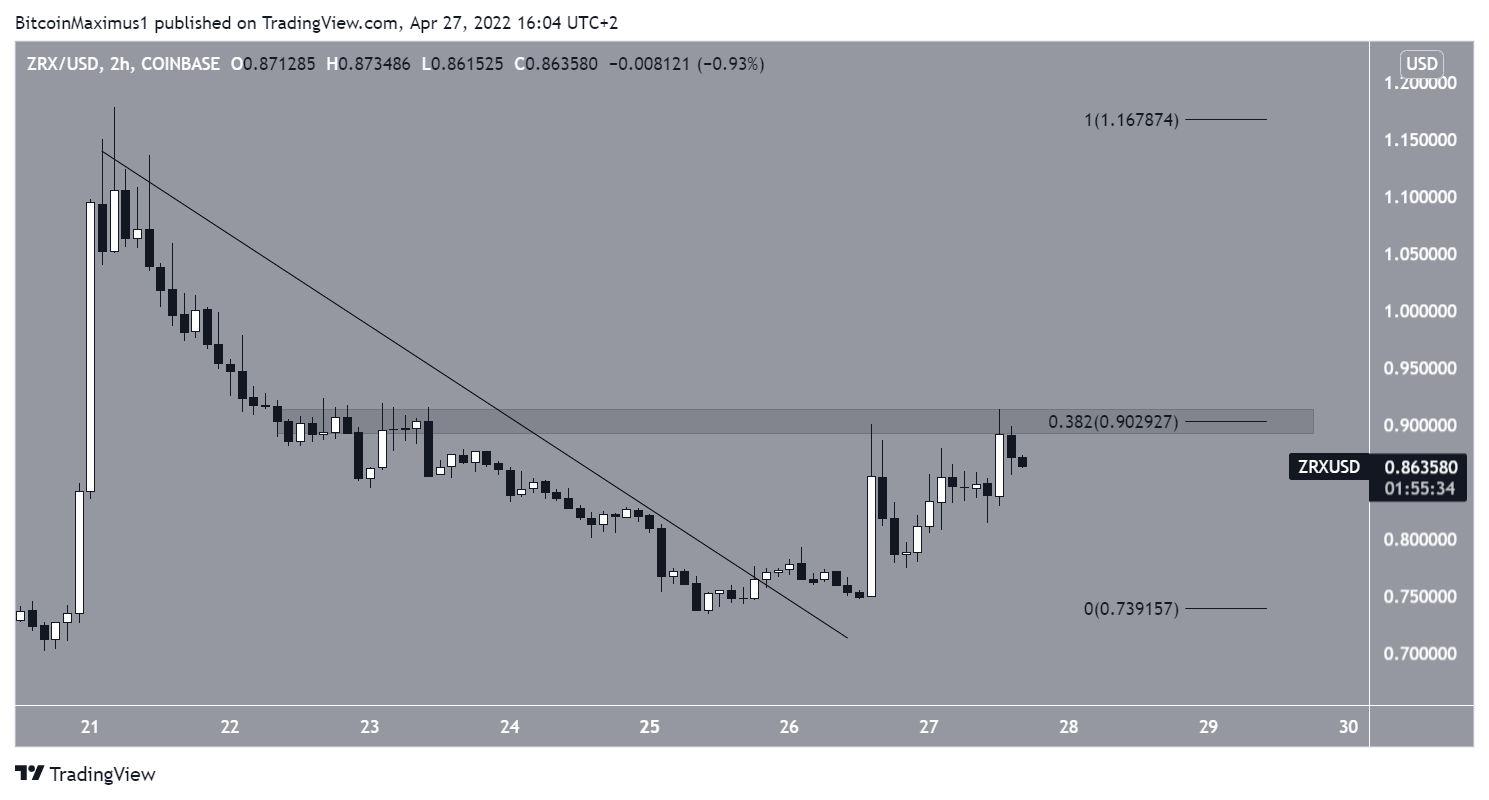
Since the tweet, the price has regained its footing and broken out from a short-term descending resistance line. Currently, it is attempting to clear the $0.90 area. This is both a horizontal resistance area and the 0.382 Fib retracement resistance level.
If it is successful in doing so, another attempt at breaking out from the long-term resistance line would be expected.
ZRX/BTC
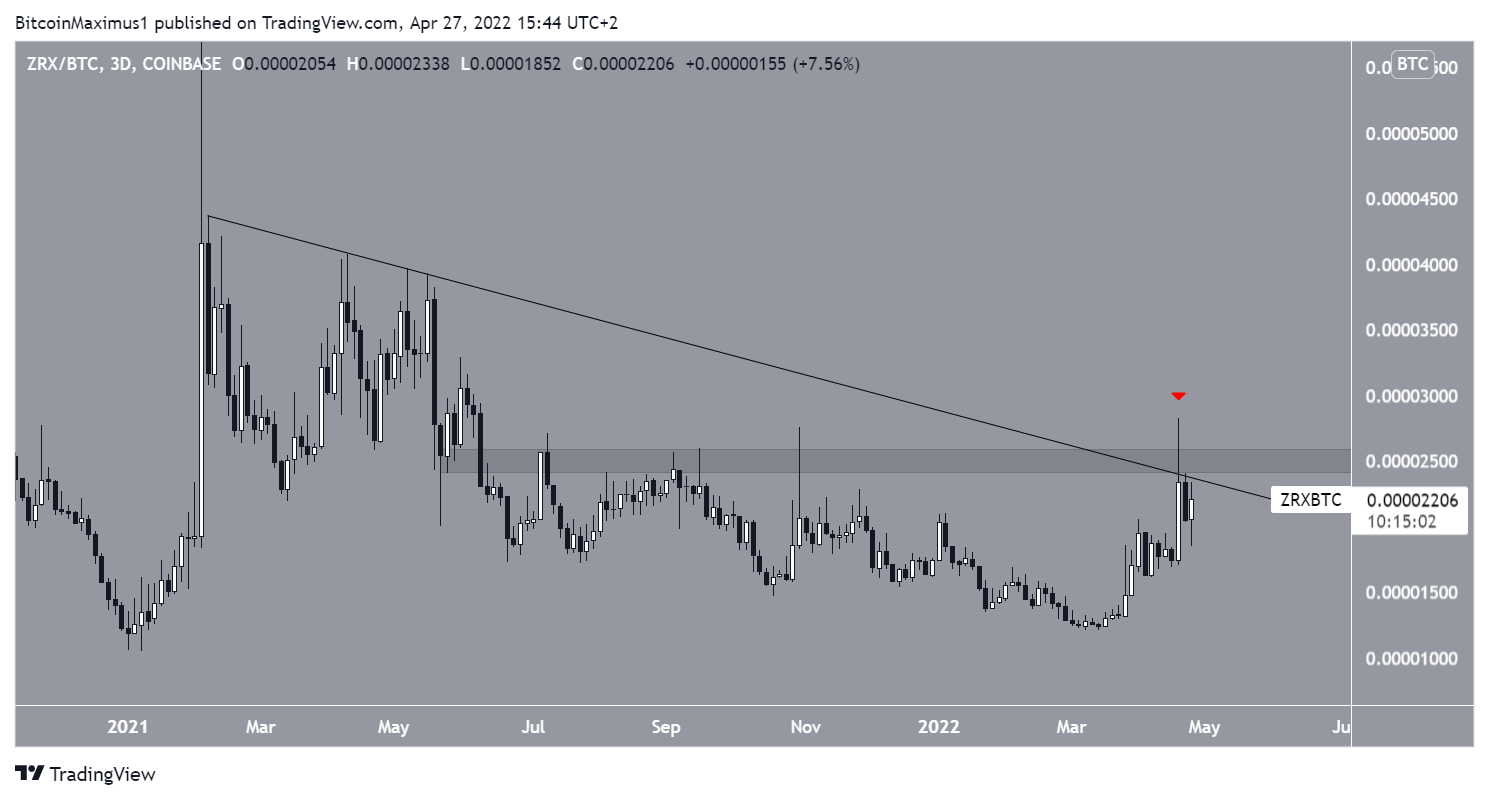
The ZRX/BTC chart is similar to the ZRX/USD one. The price has been following a descending resistance line since Feb. 2021 and was rejected (red icon) on April 21, 2022.
However, unlike the USD pair, the price is also facing resistance from the 2500 satoshi area, which currently coincides with the descending resistance line. Therefore, the importance of the line is increased.
Until ZRX manages to break out from it, the trend cannot be considered bullish.
For BeInCrypto’s latest Bitcoin (BTC) analysis, click here
Disclaimer
In line with the Trust Project guidelines, this price analysis article is for informational purposes only and should not be considered financial or investment advice. BeInCrypto is committed to accurate, unbiased reporting, but market conditions are subject to change without notice. Always conduct your own research and consult with a professional before making any financial decisions. Please note that our Terms and Conditions, Privacy Policy, and Disclaimers have been updated.
