


The 0x (ZRX) price has been trading in a range between $0.465 and $0.635 since the beginning of the year.
While an eventual breakout is likely, 0x is expected to decrease in the short-term once more before bouncing higher.
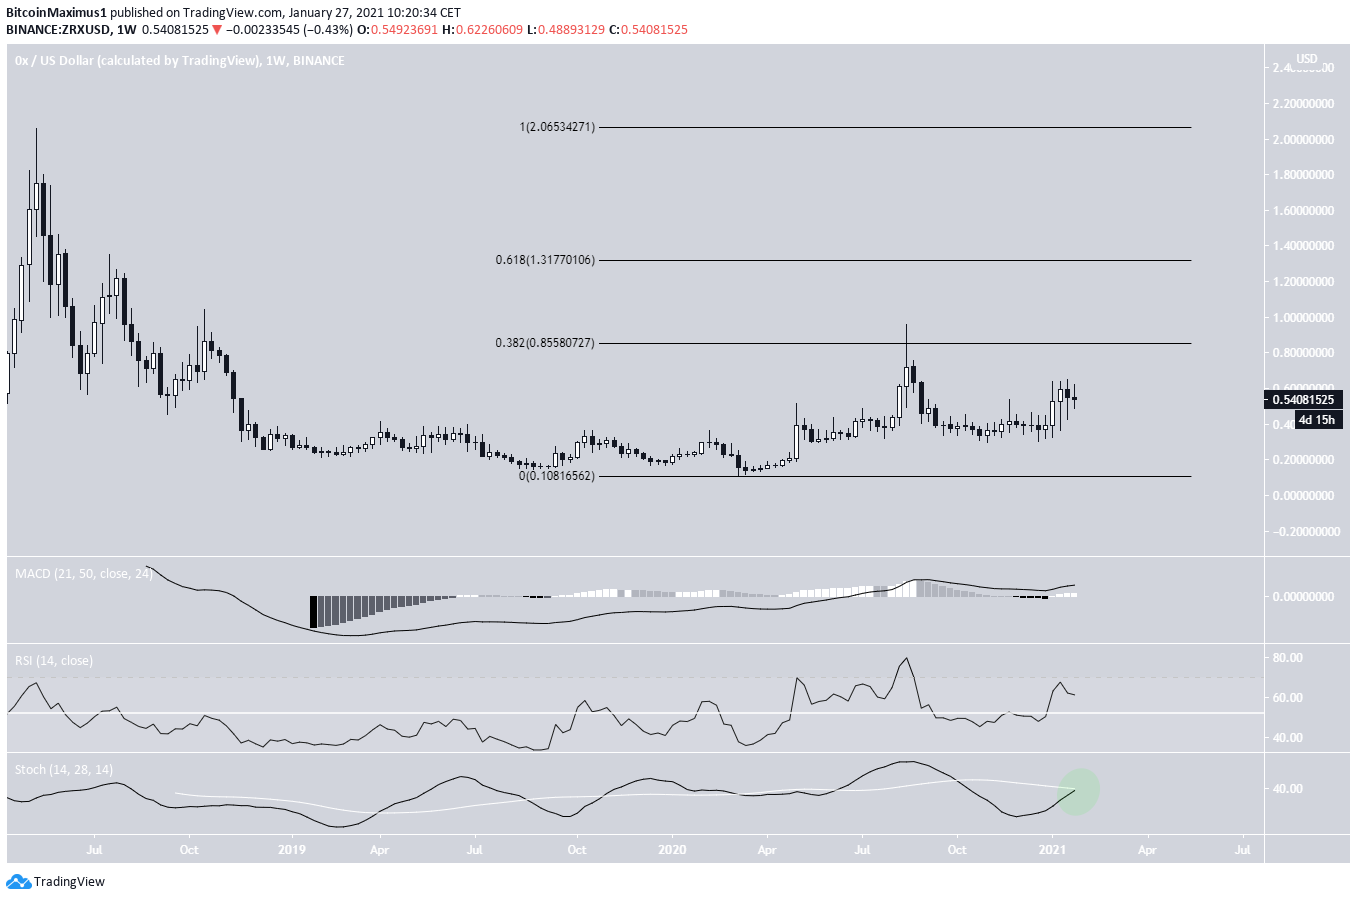
0x Long-Term Levels
The weekly chart shows that despite a significant upward move, ZRX has been decreasing since being rejected by the 0.382 Fib retracement resistance at $0.85 in August 2020.
Despite the decrease, technical indicators are still bullish.
If a breakout were to occur, the next significant resistance area would be found at $1.31, (0.618 Fib retracement level).
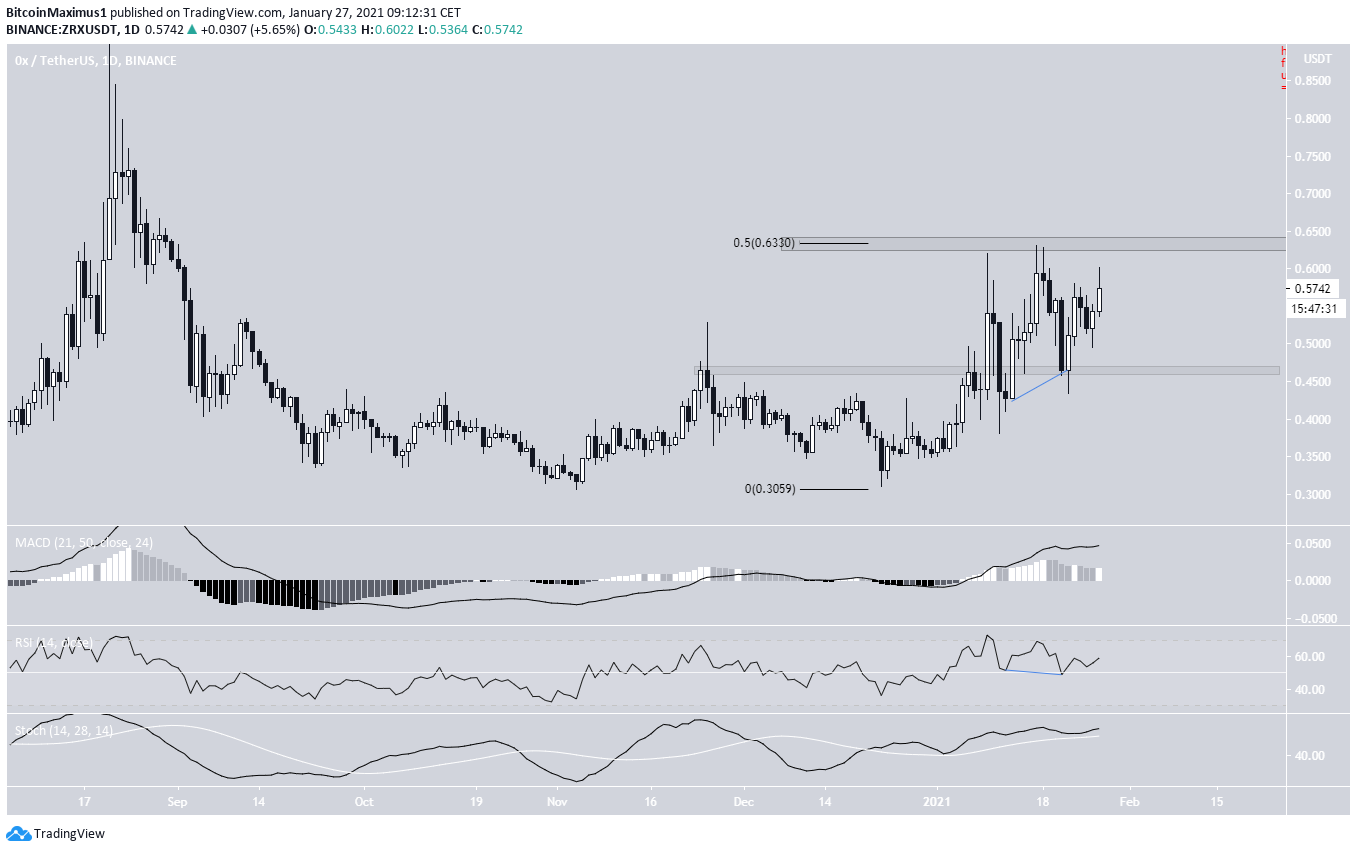
ZRX Moves Above Resistance
ZRX is currently trading between support and resistance at $0.465 and $0.635 respectively. It broke out above the latter on Jan. 9 and re-tested the level as support after.
After the daily RSI generated a hidden bullish divergence, ZRX began another upward move towards resistance. The MACD and Stochastic oscillator are both moving upwards, suggesting that ZRX is likely to re-test this area once more.
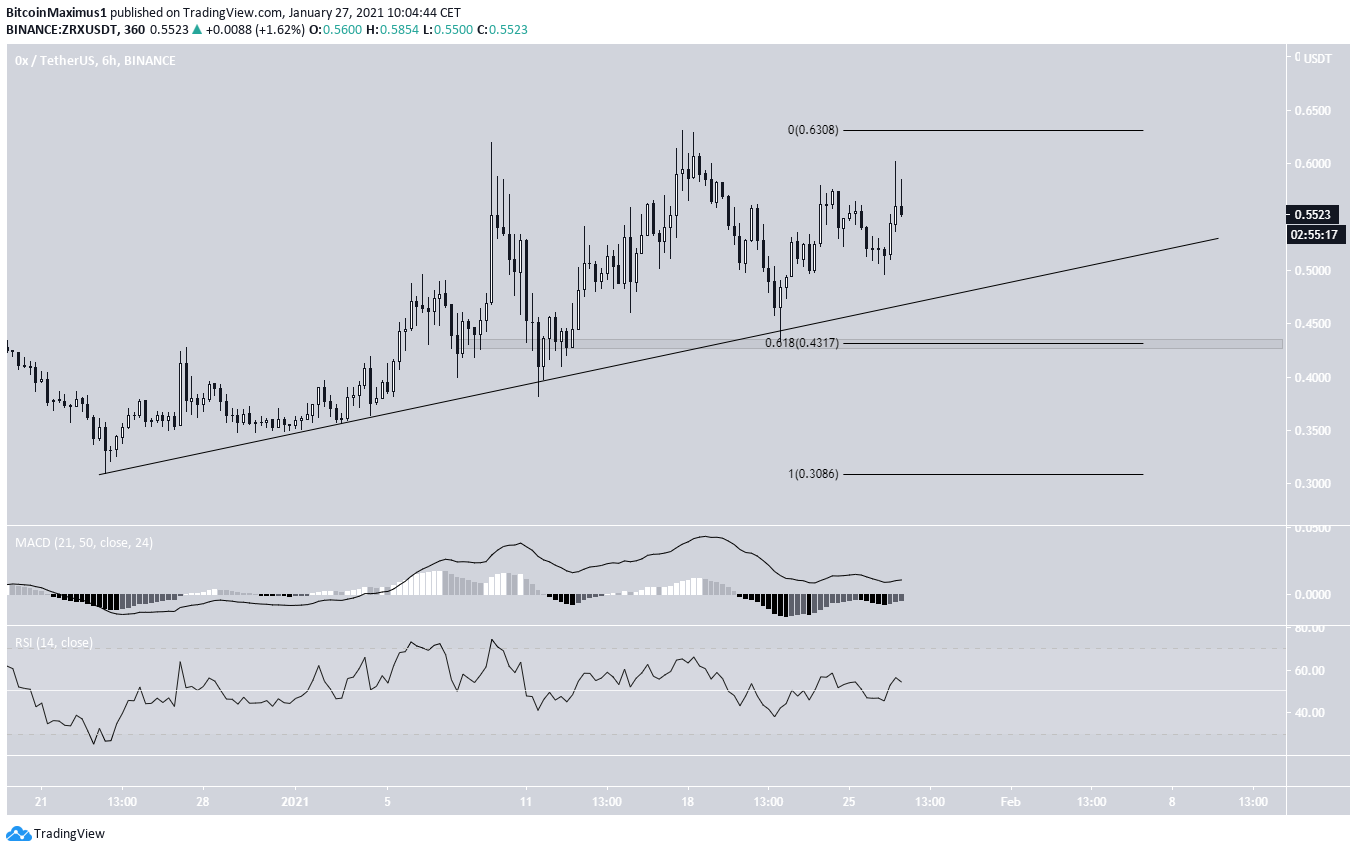
Ascending Support
The six-hour chart shows that ZRX has been following an ascending support line since reaching a low on Dec. 21, 2020. When combined with the previously outlined resistance area, this created an ascending triangle — normally considered a bullish pattern.
However, technical indicators are neutral, providing no clear direction of the trend.
A breakdown from this support line would take ZRX to the 0.618 Fib support at $0.43, but that does not seem likely at the current time. Nevertheless, a re-test and bounce is the most likely scenario.
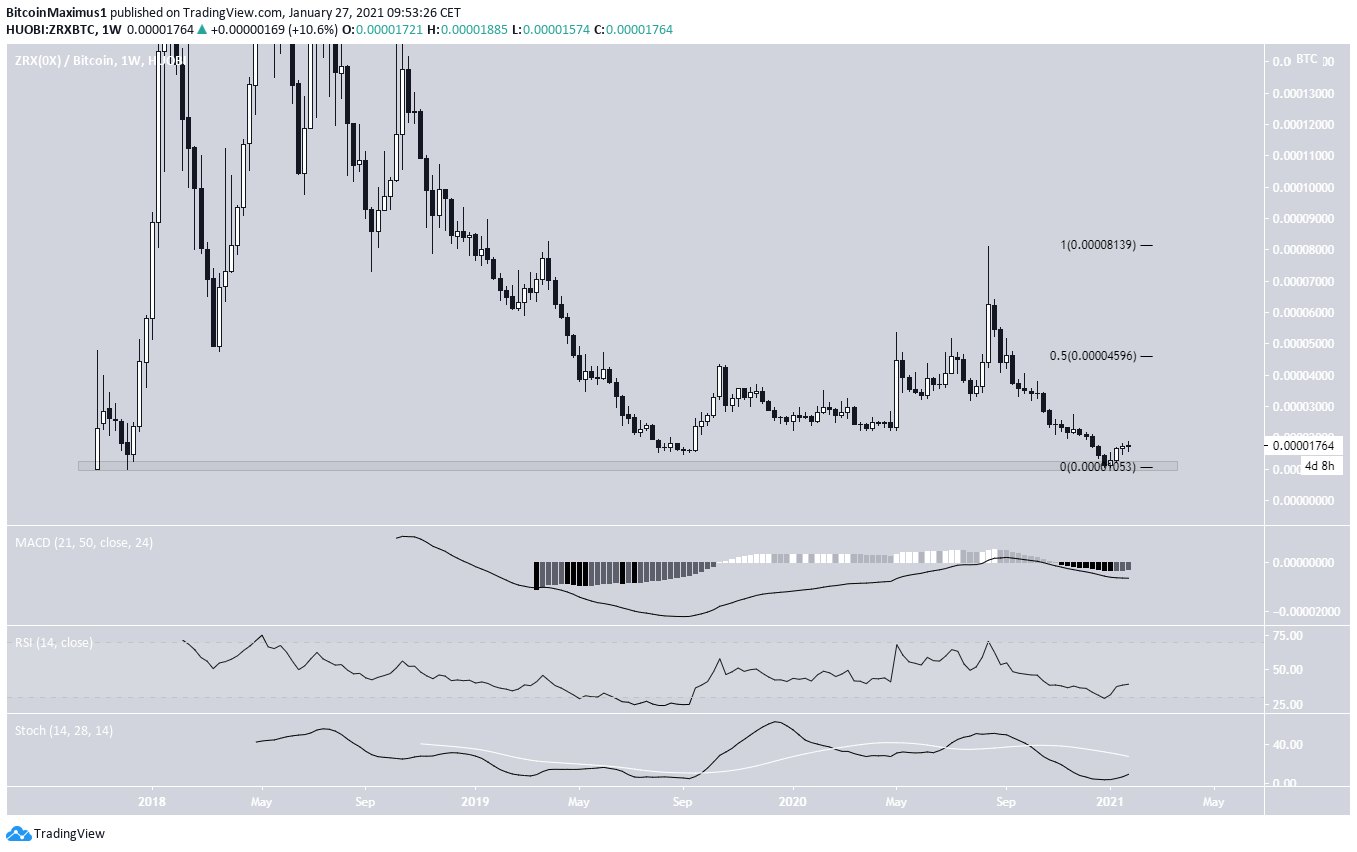
ZRX/BTC
Cryptocurrency trader @CryptoNTez outlined a ZRX chart, stating that the breakout from the current resistance area suggests that it has the potential for a massive increase.
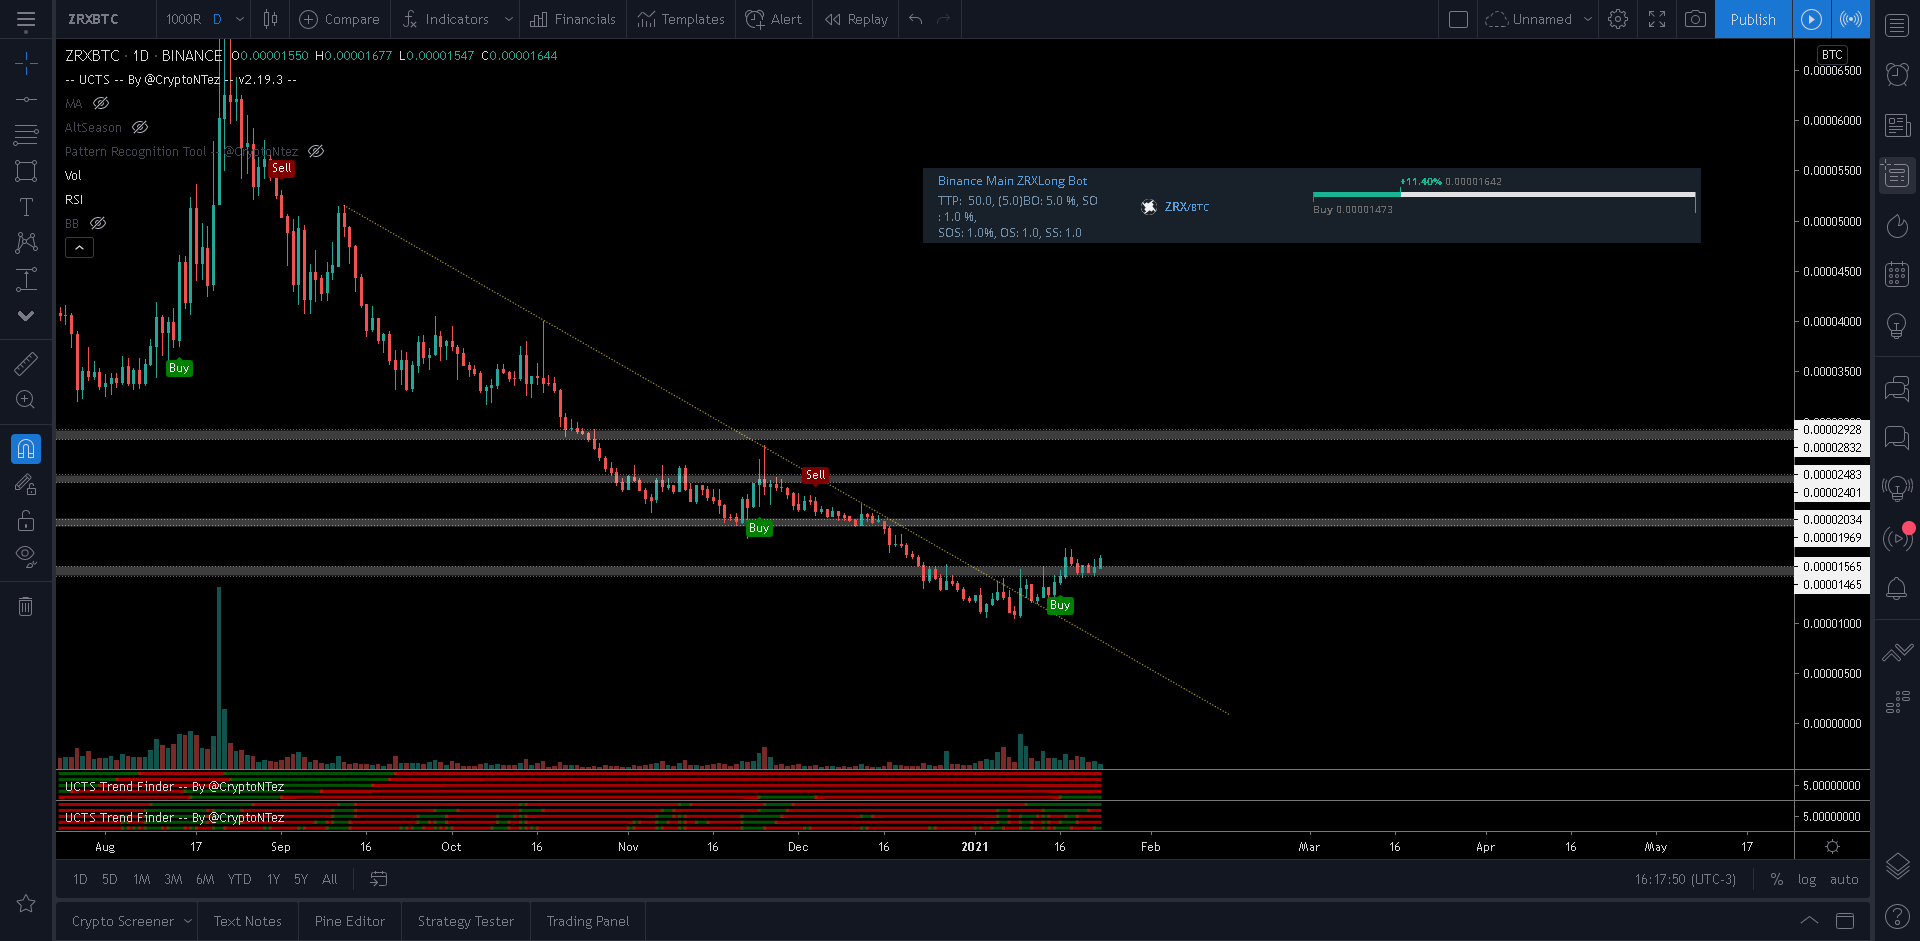
ZRX has bounced at the all-time low 1,150 satoshi area and initiated an upward move. Technical indicators are also gradually turning bullish, but have not confirmed the bullish trend reversal yet.
If ZRX continues increasing, the next closest resistance area would be found at 4,600 satoshis (0.5 Fib retracement level).
Conclusion
ZRX/USD is expected to decrease and validate the ascending support line near $0.50 before possibly bouncing.
ZRX/BTC has bounced at its all-time low support area and is expected to slowly increase toward 4,600 satoshis.
For BeInCrypto’s latest Bitcoin (BTC) analysis click here


