


The Zilliqa (ZIL) price has been increasing since Sept 21 and has reclaimed an important horizontal level while breaking out from a short-term descending resistance line.
The price is likely to continue moving upwards towards the resistance levels outlined below.
Long-Term Levels
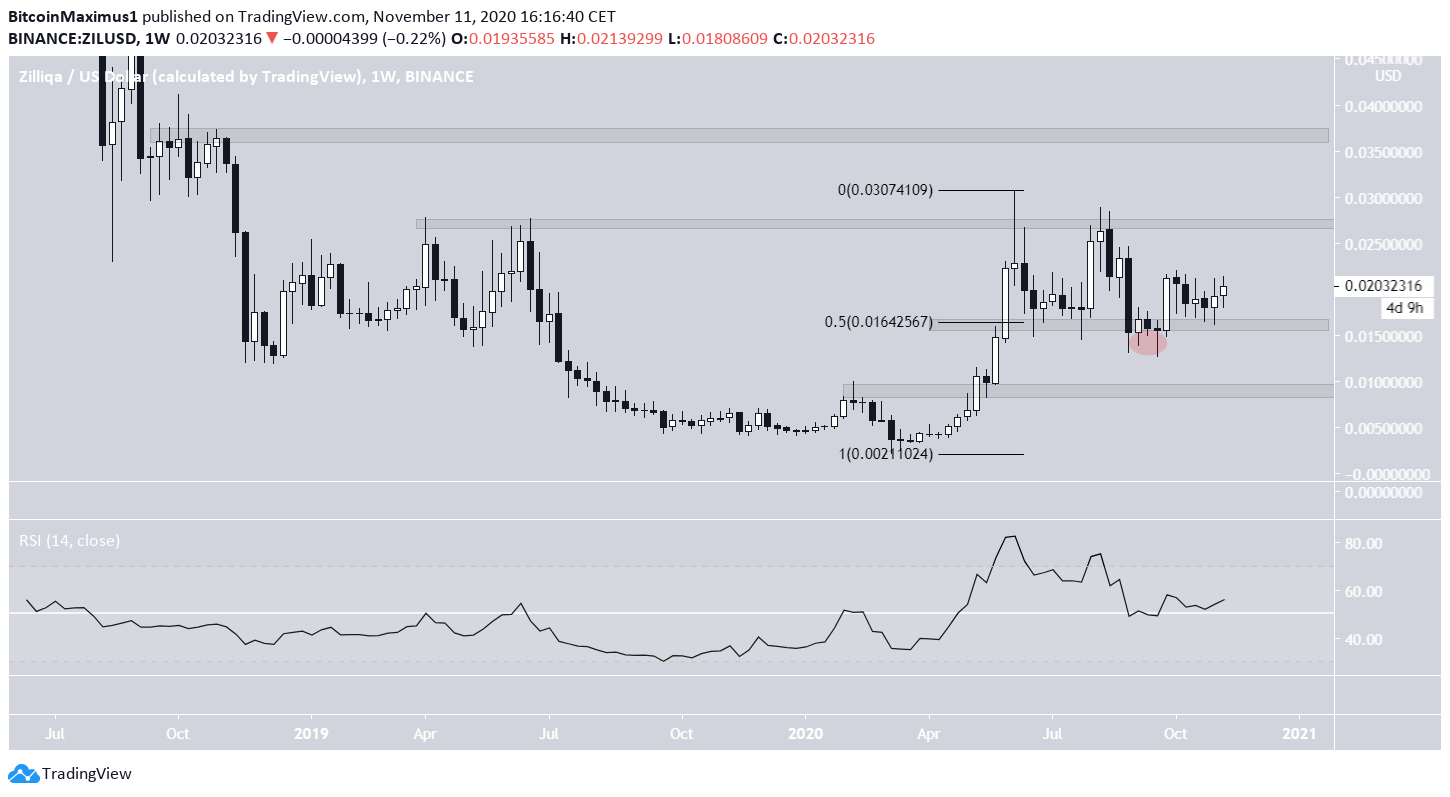
The ZIL price is currently trading above a long-term support level near $0.016, having done so since it broke out in June. While the price purportedly fell below this level in Sept, it subsequently reclaimed it and left a long lower wick in its wake.
The main resistance area is found near $0.027, above which the price has not traded since Oct, with the exception of one wick in July 2020.
While technical indicators do not provide a definitive direction, the RSI is above 50, a bullish sign.
Outside of the current $0.016 – $0.027 range, the closest resistance is at $0.036, while the closest support is at $0.009.
Current Move
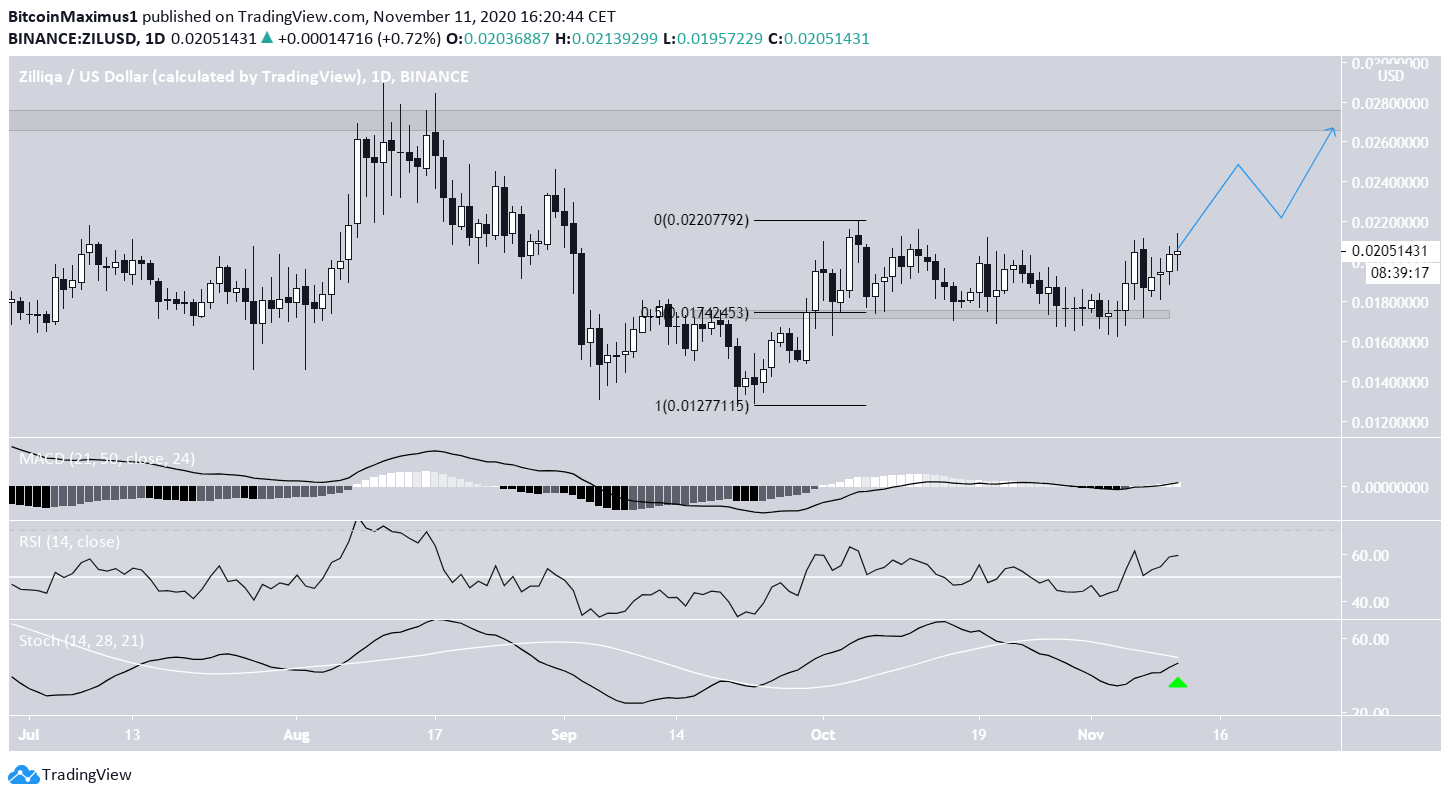
ZIL has been moving upwards since it reached a low of $0.0127 on Sept 21. The price has reclaimed the $0.0175 resistance area, which has now turned to support.
Technical indicators are bullish. The MACD and the RSI are increasing, the former being above 0 and the latter above 50. The Stochastic Oscillator is very close to making a bullish cross.
Therefore, the price should continue increasing towards the previously outlined $0.027 resistance area.
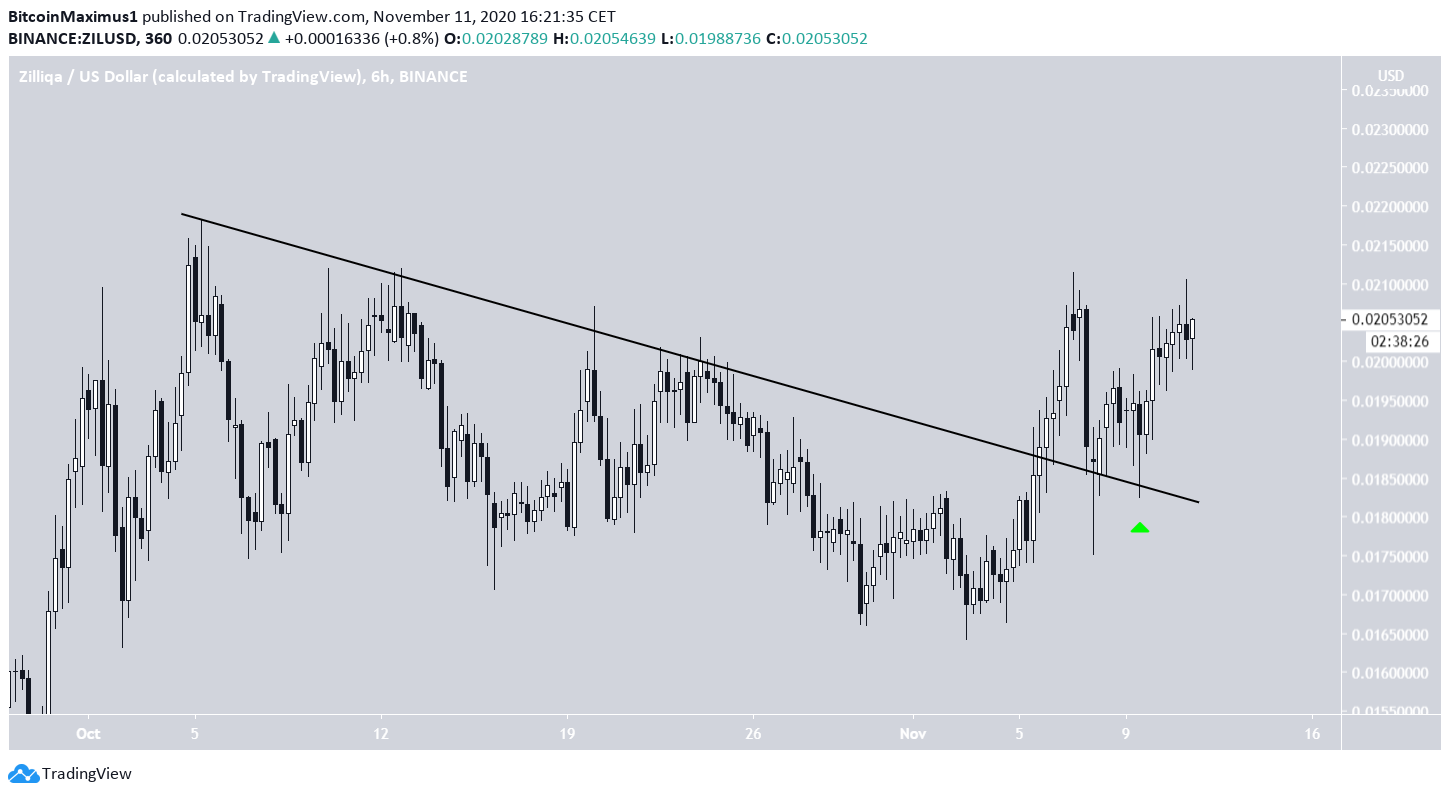
The shorter-term 6-hour chart supports this possibility since ZIL has broken out from a descending resistance line and then validated it as support.
Wave Count
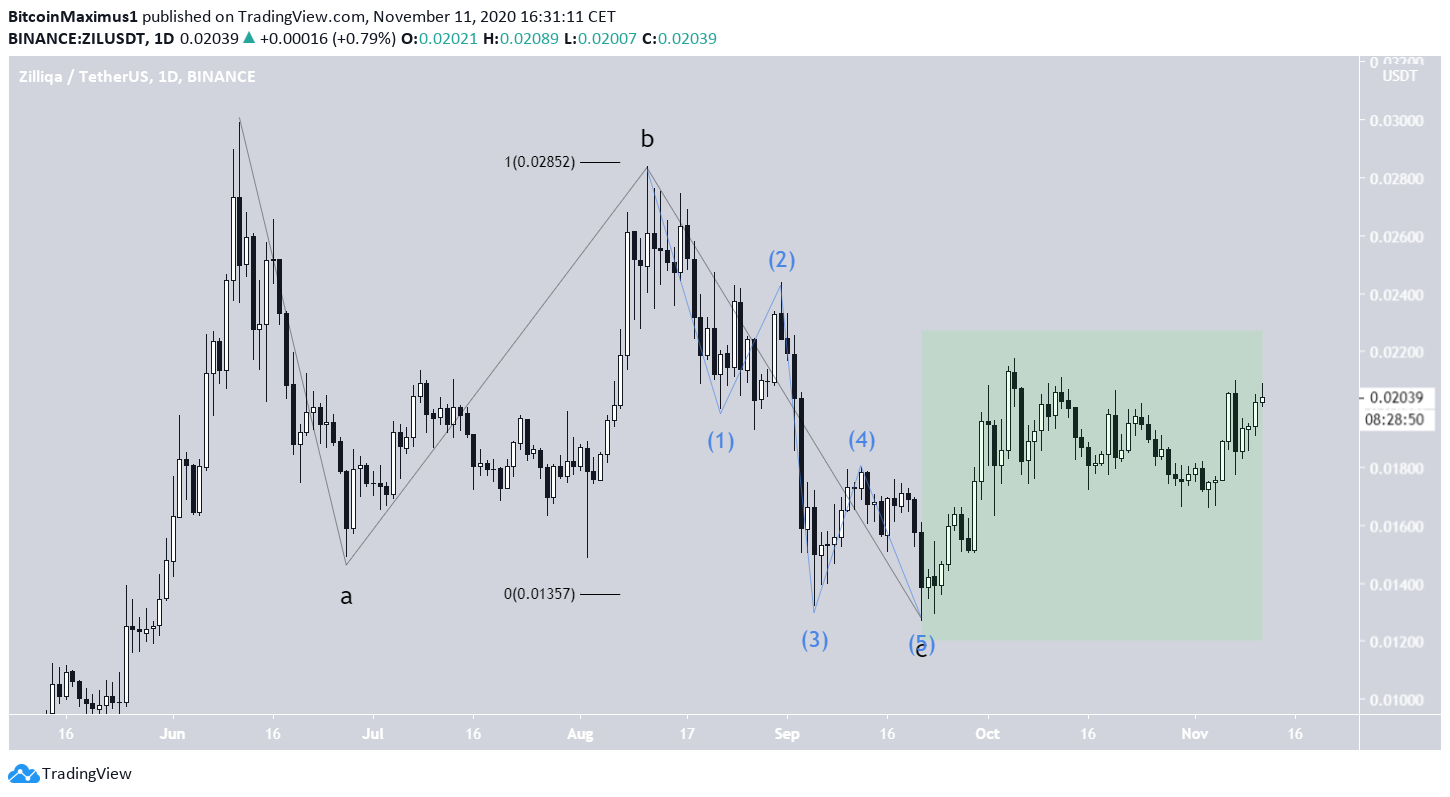
Cryptocurrency trader @Mesawine1 tweeted a ZIL chart, which shows that the price has begun a bullish impulse. If the entire move takes place as expected, ZIL could reach a high above $0.036.
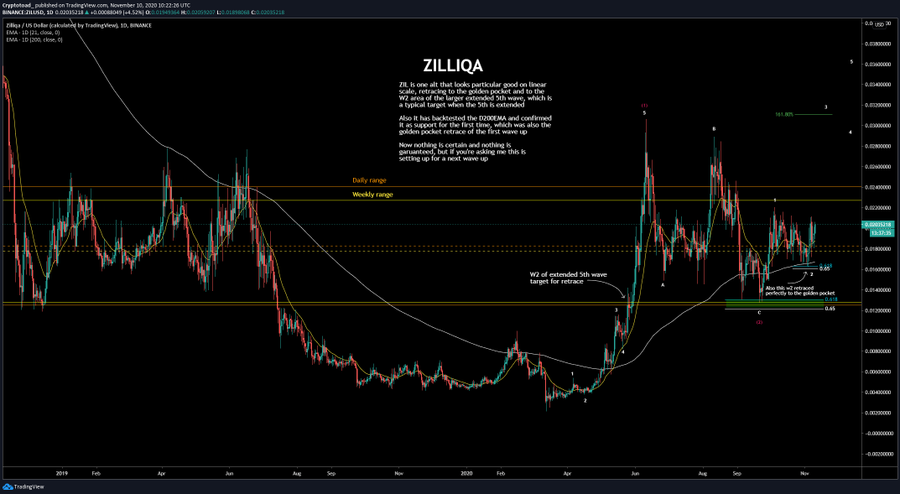
Measuring from the June high, it seems that the price has completed an A-B-C corrective structure (shown in black below), in which the A:C waves have a 1:1 ratio, customary in such corrections.
If the count is accurate, the price has begun a new upward move after the Sept 21 low (highlighted in green). It is likely to take the price towards the resistance areas outlined in the first section, at $0.027 and $0.036, respectively.
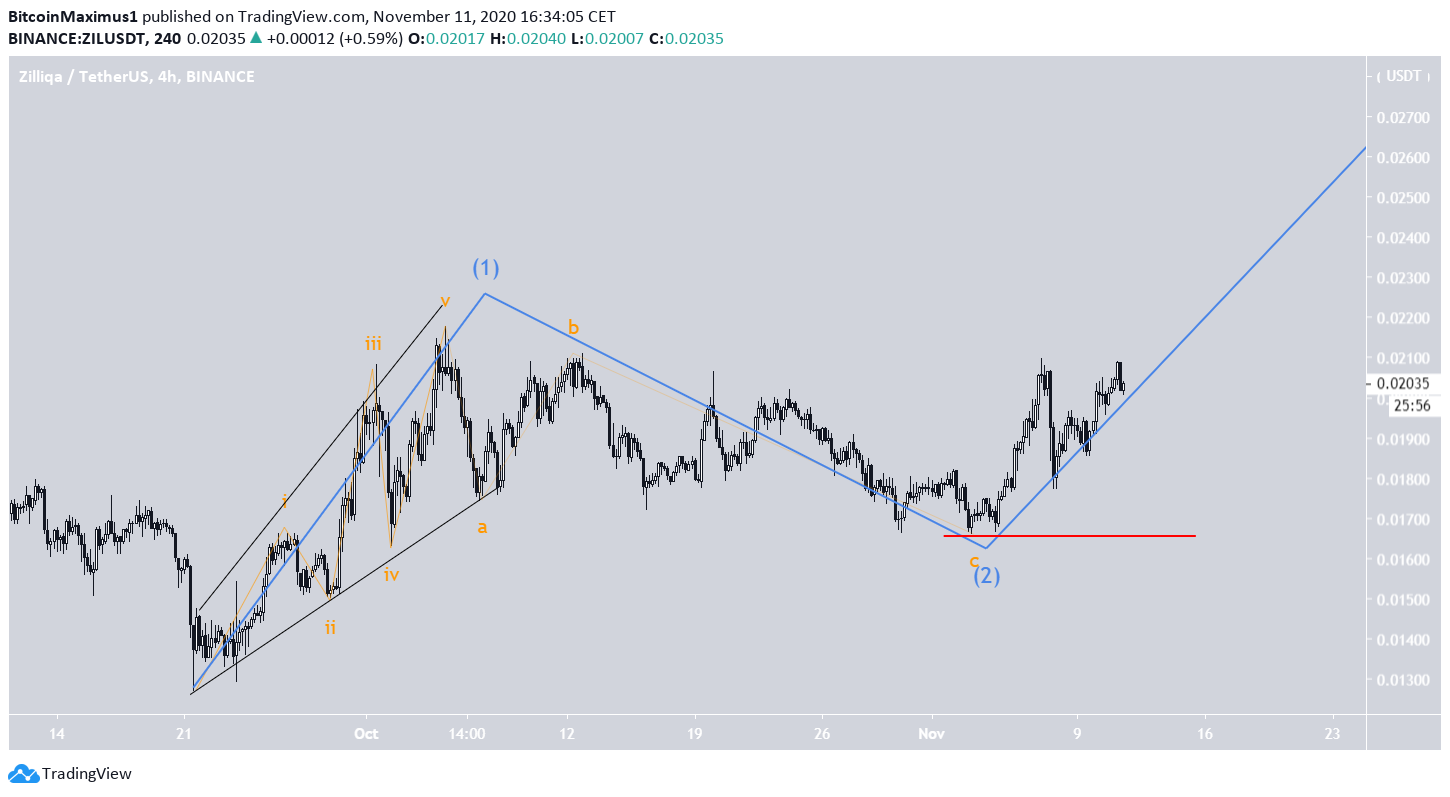
The shorter-term count shows that the price has possibly completed waves one and two of this upward move (blue) and has begun the third one.
A decline below the wave two low (blue) at $0.0165 would invalidate this particular wave count.
Conclusion
To conclude, it’s likely that ZIL has begun a new upward move that should take the price towards the $0.027 resistance area from the Aug highs, and possibly higher.
For BeInCrypto’s latest Bitcoin analysis, click here!
Disclaimer: Cryptocurrency trading carries a high level of risk and may not be suitable for all investors. The views expressed in this article do not reflect those of BeInCrypto.


