


Be[in]Crypto takes a look at the five cryptocurrencies that decreased the most over the past week, more specifically from April 22 to 29.
These cryptocurrencies are:
- Zilliqa (ZIL) : -24.15%
- Near Protocol (NEAR) :-22.66%
- Axie Infinity (AXS) : -22.40%
- Waves (WAVES) : -21.69%
- Theta Network (THETA) : -19.75%
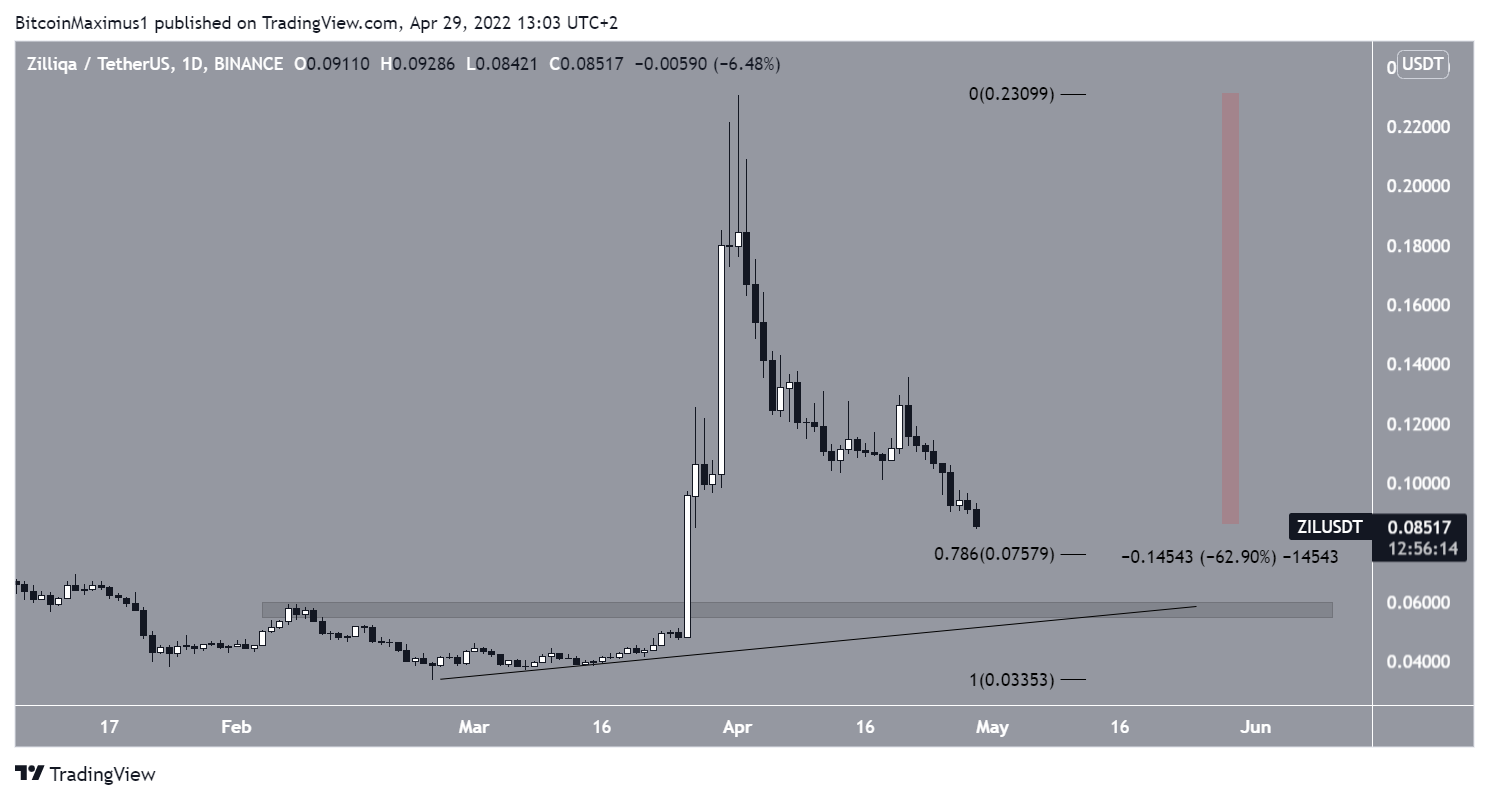
ZIL
ZIL has been falling since reaching a high of $0.23 on April 1. The downward movement has so far led to a low of $0.084 on April 29. Measuring from the April 1 high, this is a decrease of 63%.
ZIL is approaching the 0.786 Fib retracement support level at $0.076, an area that could initiate a bounce.
If the area fails to hold, the next support would be at $0.057. This is both a horizontal support area and coincides with a potential ascending support line.
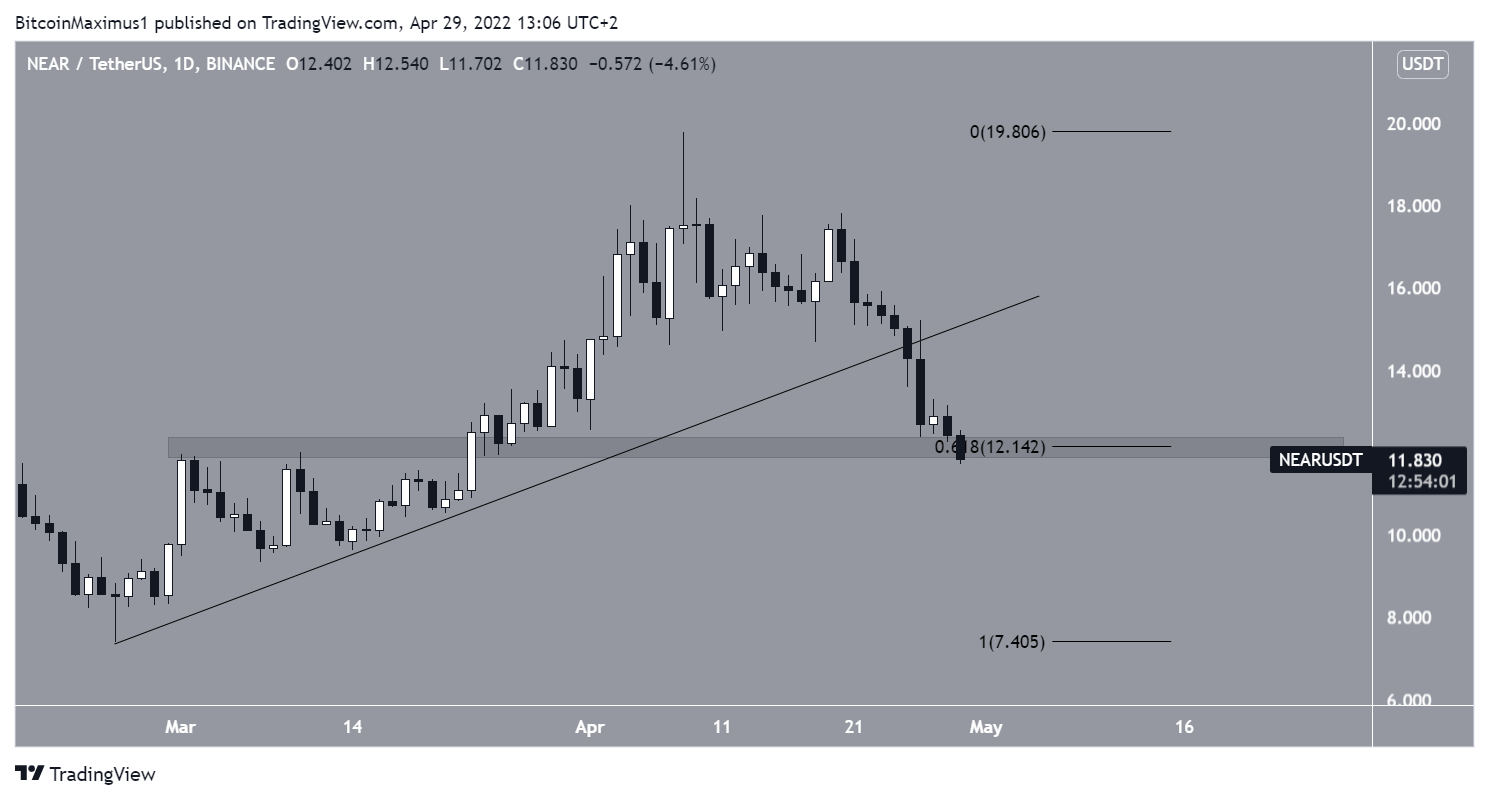
NEAR
NEAR has been decreasing since reaching a high of $19.78 on April 8. On April 25, it broke down from an ascending support line and accelerated its rate of decrease.
Currently, NEAR is holding just above the 0.618 Fib retracement support level at $12.10. If it fails to initiate a bounce above it, the price would be expected to decrease below $10.
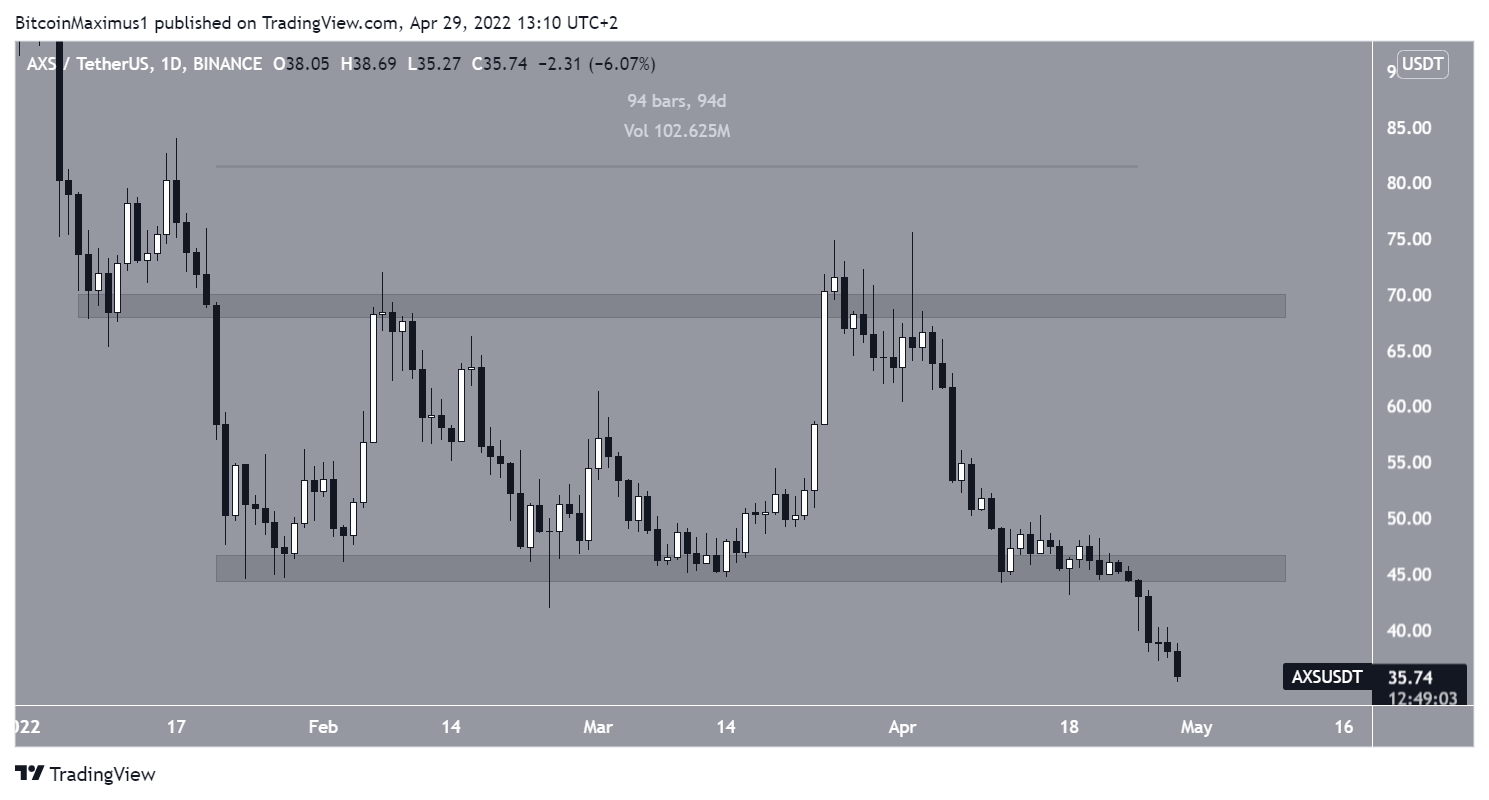
AXS
AXS had been trading in a range between $69 and $45.50 since Jan 2022. Both the resistance and support areas of this range were tested numerous times.
On April 24, AXS broke down from the $45.50 support area and proceeded to reach a low of $35.27 on April 29.
Due to the fact that the range had been in place for 94 days, it is possible that this will be the catalyst for an extended downward movement.
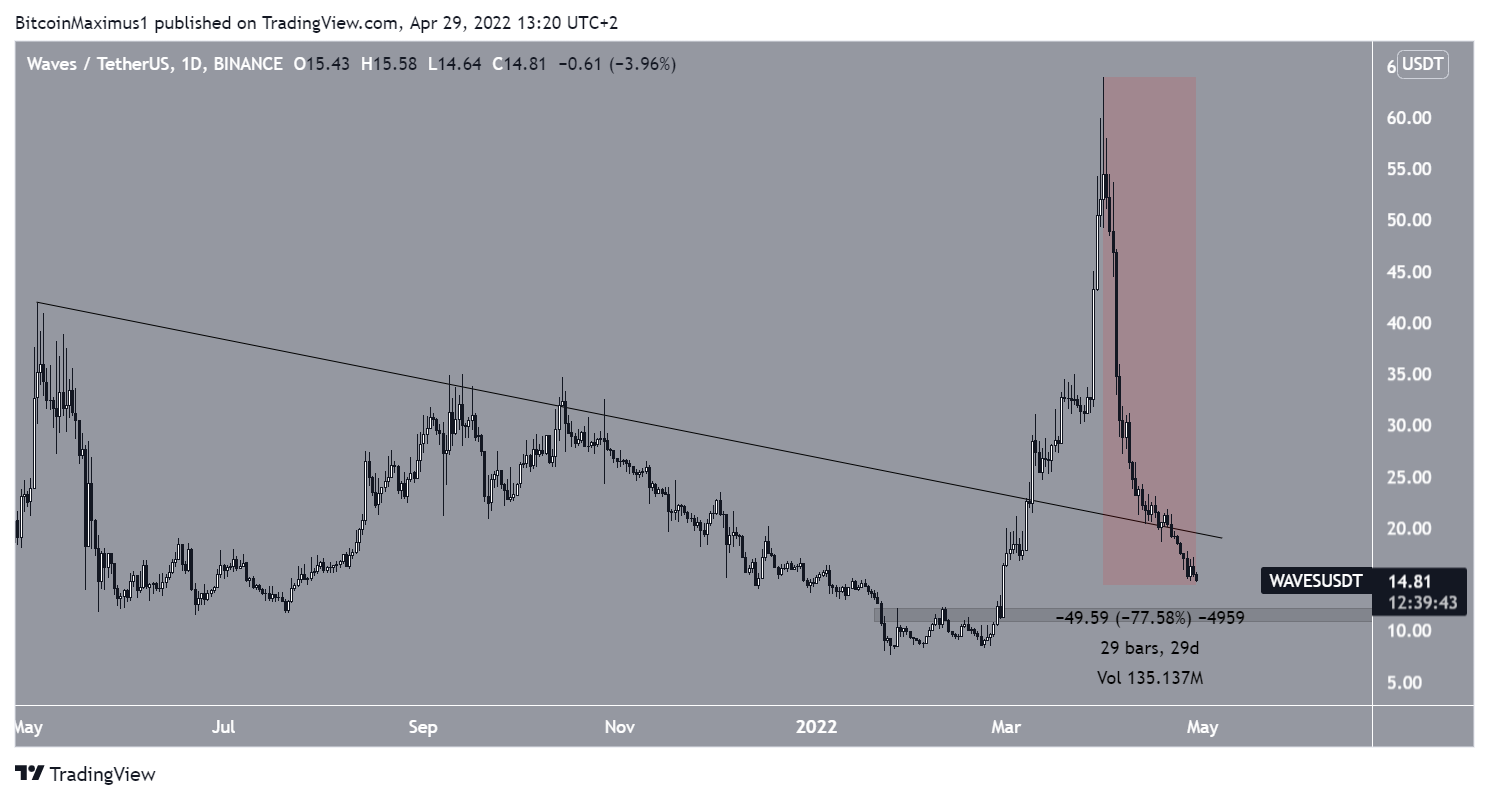
WAVES
Similar to ZIL, WAVES has been falling since reaching a high of $63.93 on March 31. So far, it has decreased by 77.50%.
More importantly, the price has failed to hold on above the previous descending resistance line and has broken down below it.
The next closest support area is at $11.40.
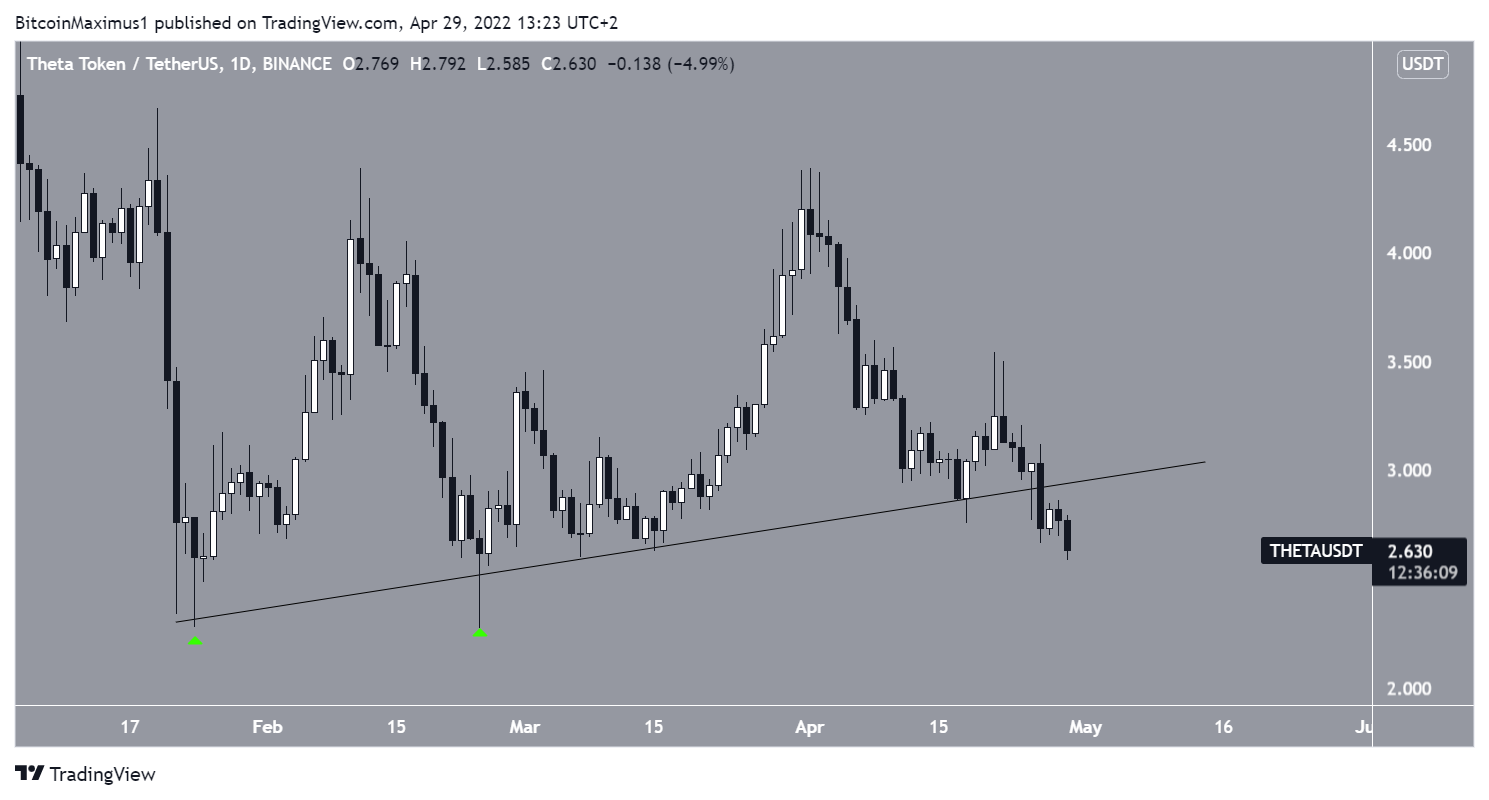
THETA
Similar to NEAR, THETA had been increasing alongside an ascending support line since the beginning of the year. The upward movement led to a high of $4.39 on April 1.
THETA has been moving downwards since and broke down from the line on April 25.
If the downward movement continues, the closest support area would be at $2.15, created by the wick lows of Jan and Feb (green icons).
For Be[in]Crypto’s latest Bitcoin (BTC) analysis, click here


